. 2020 Aug 20;124(33):7138-7151.
doi: 10.1021/acs.jpcb.0c04574. Epub 2020 Aug 6.

Pulsed Third-Spin-Assisted Recoupling NMR for Obtaining Long-Range 13C-13C and 15N-13C Distance Restraints

Affiliations

Pulsed Third-Spin-Assisted Recoupling NMR for Obtaining Long-Range 13C-13C and 15N-13C Distance Restraints

Martin D Gelenter et al. J Phys Chem B. .

Abstract

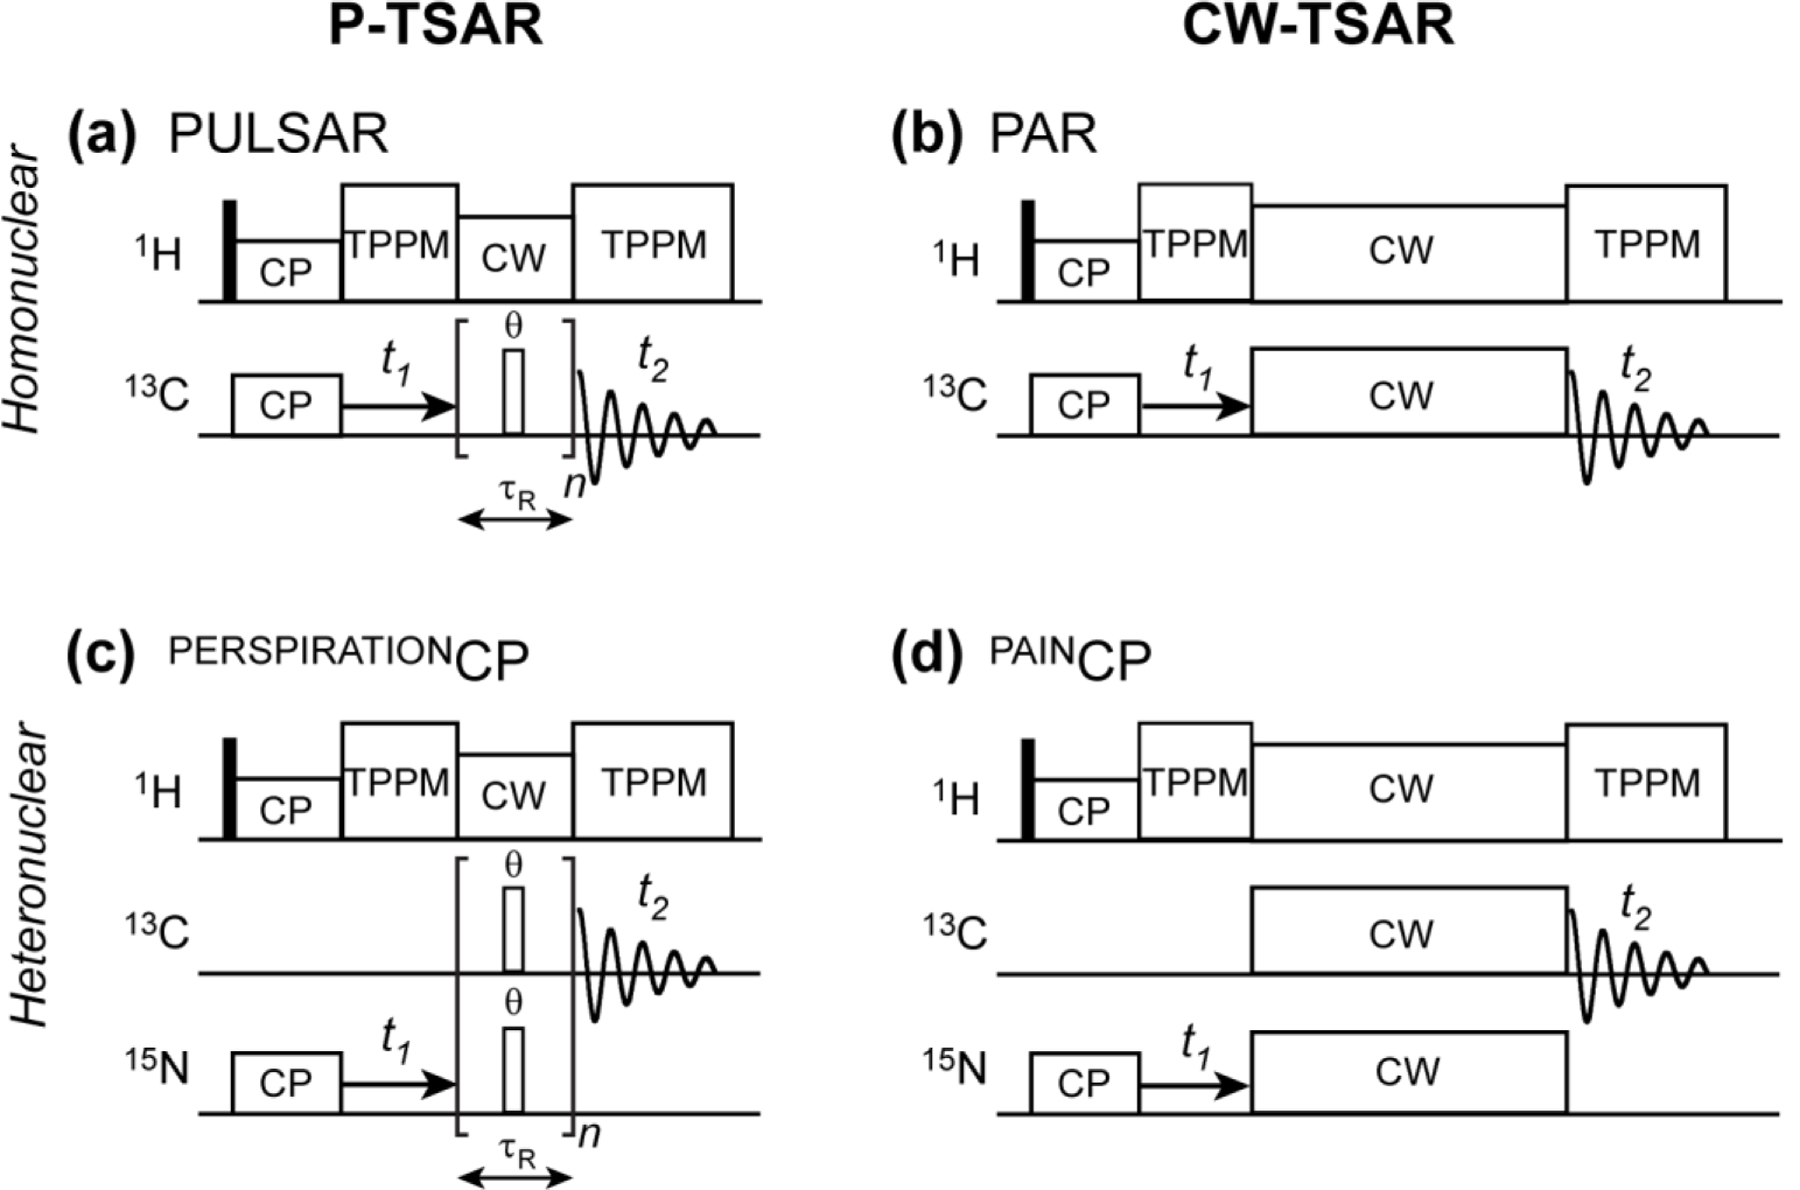
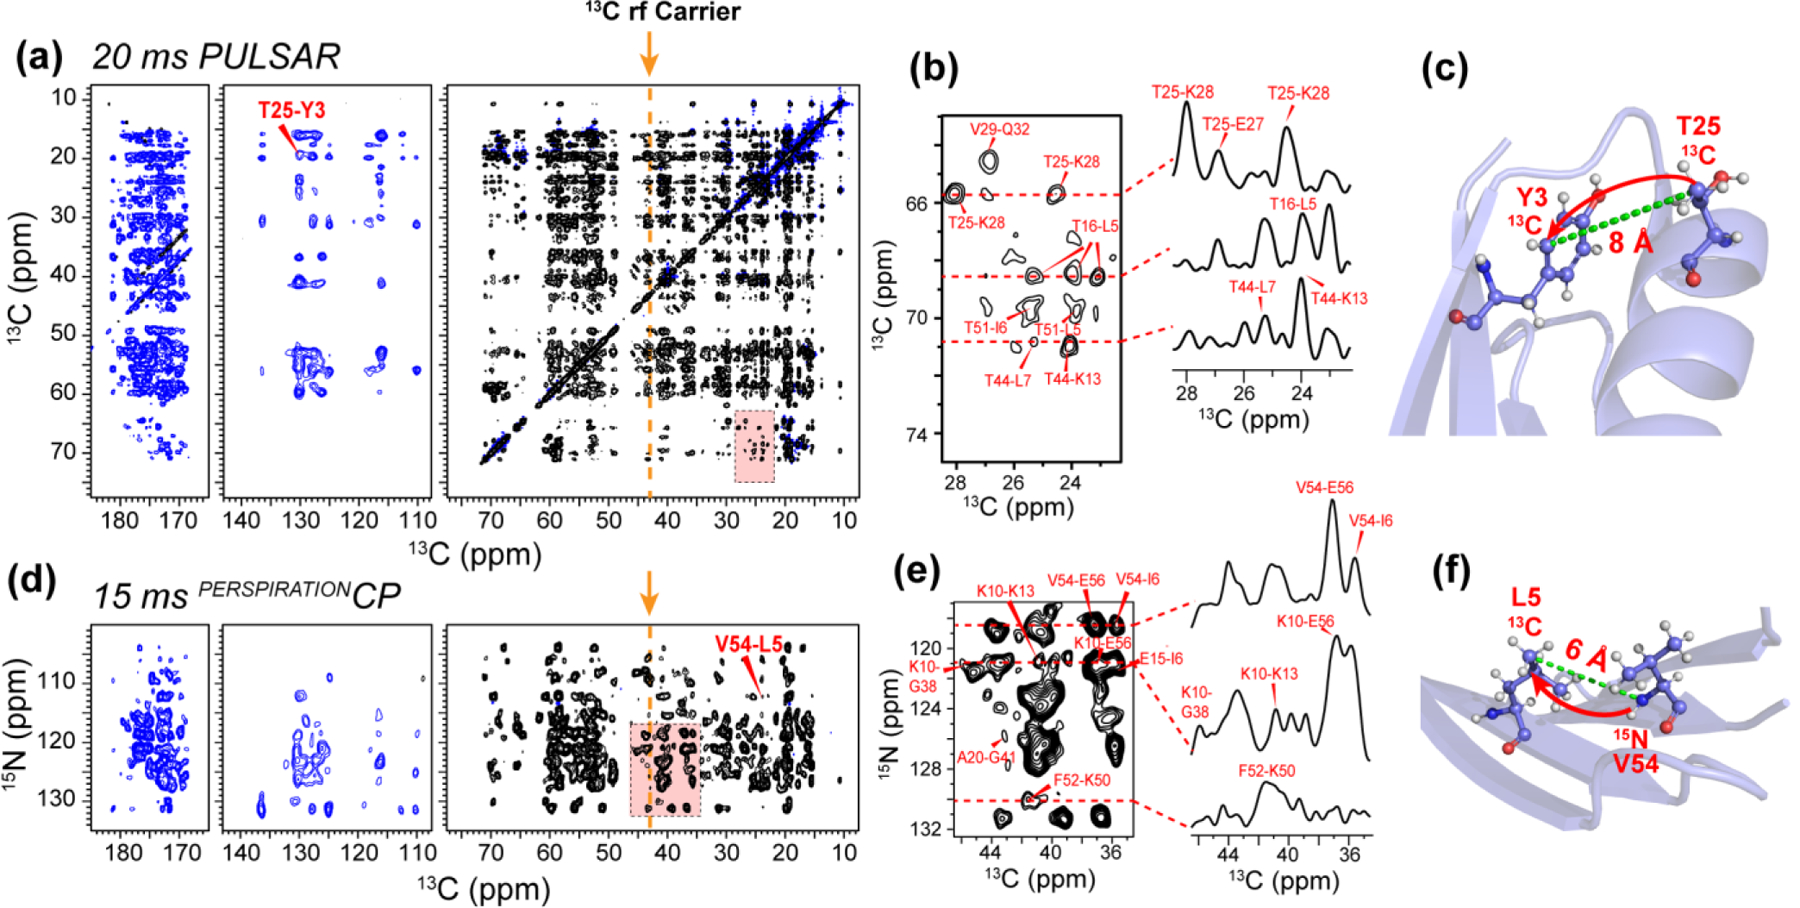
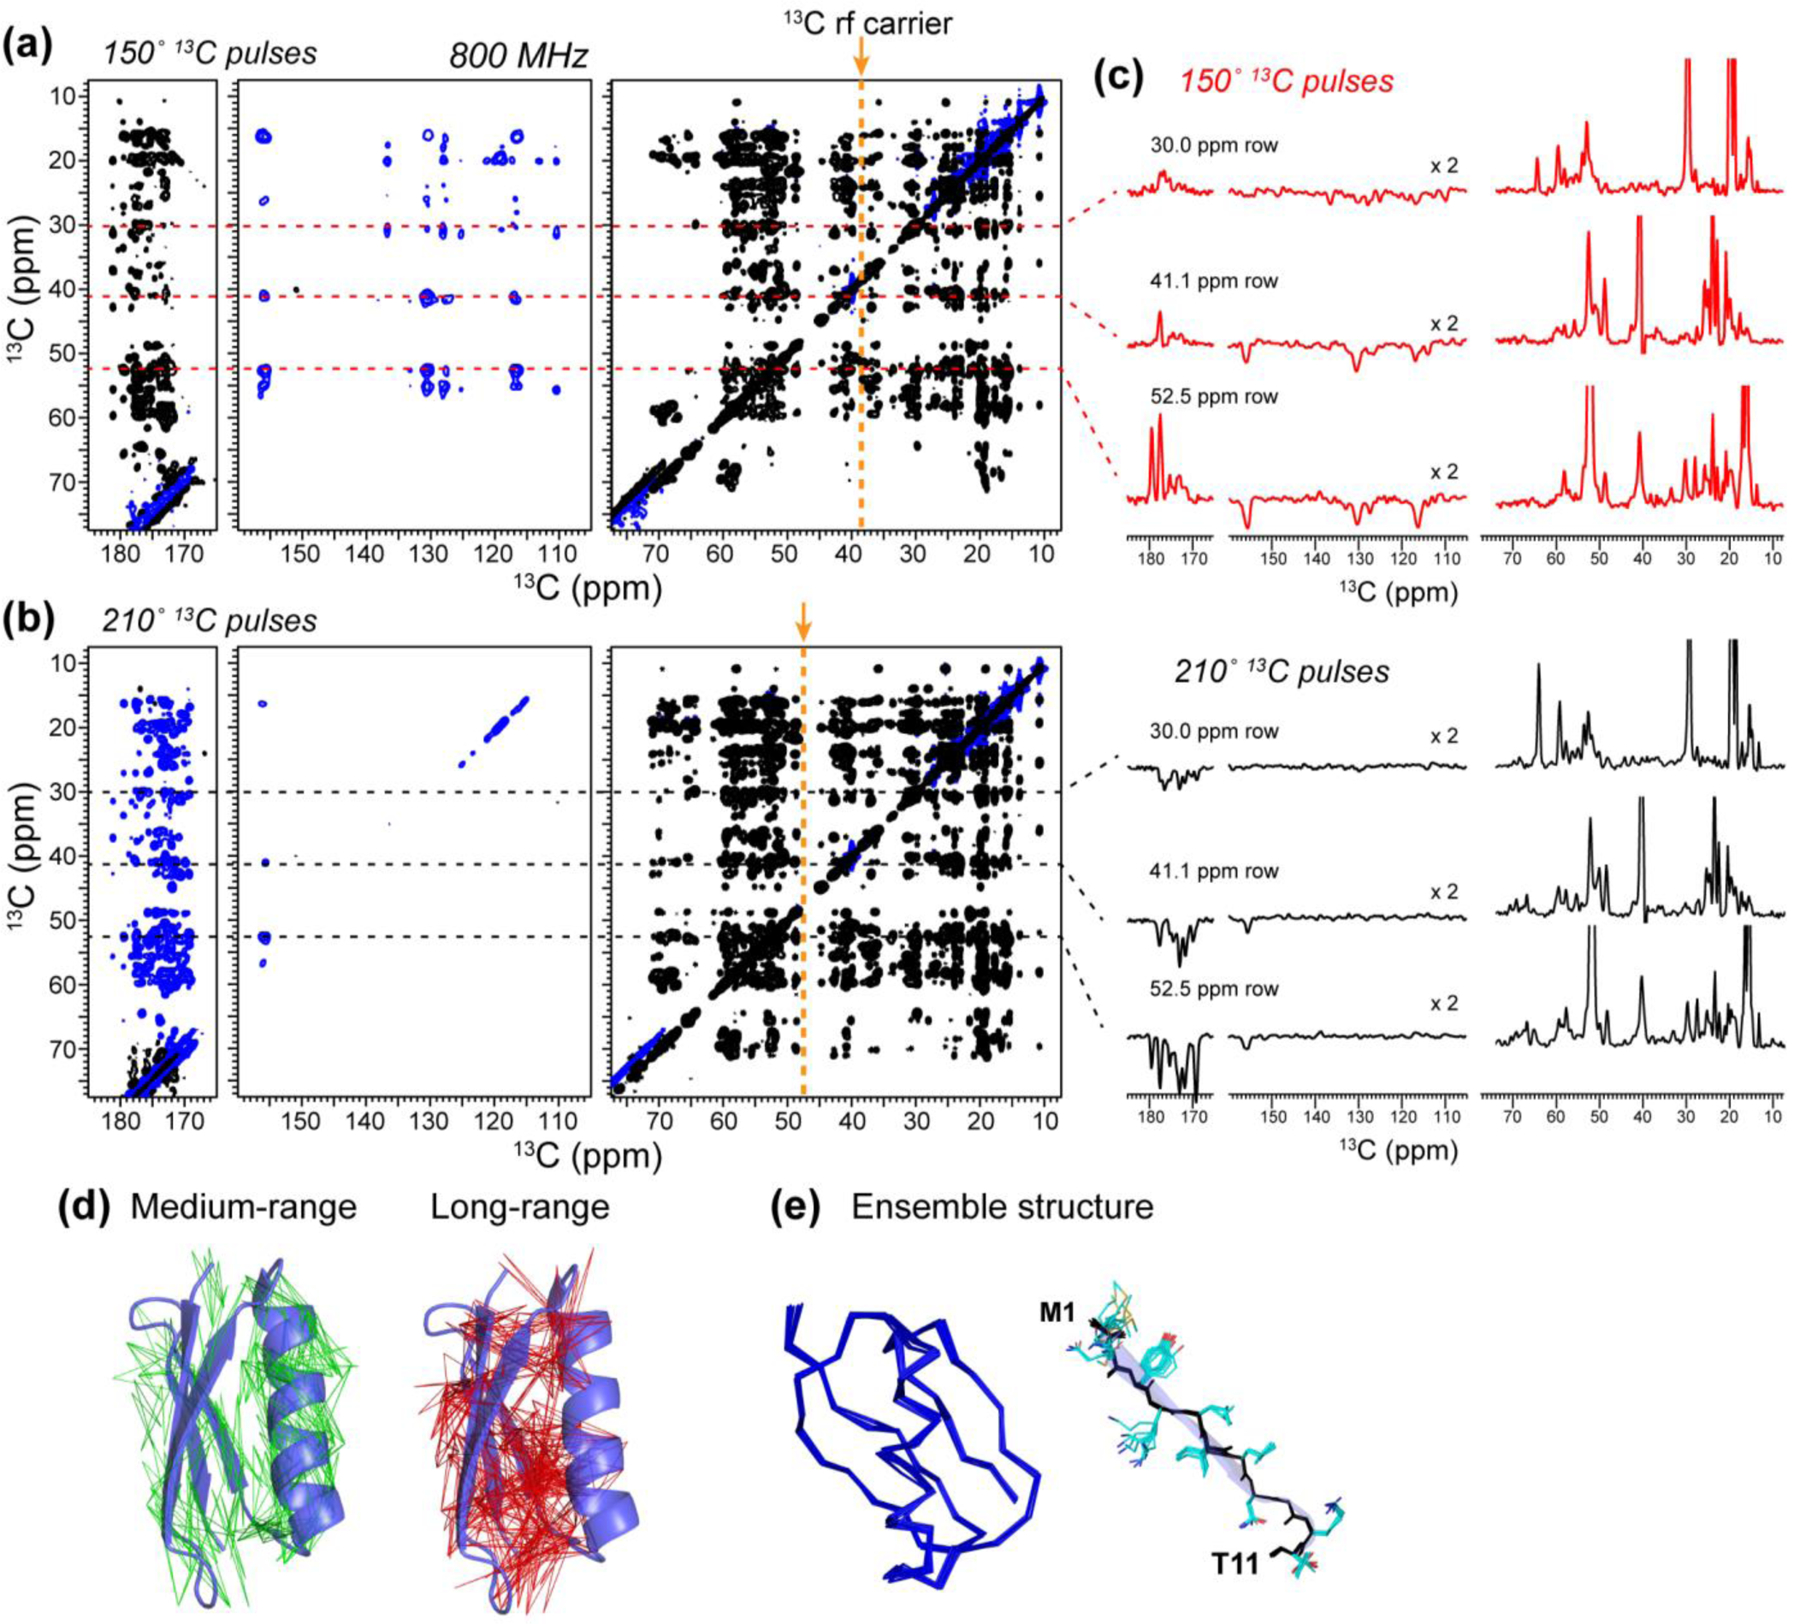
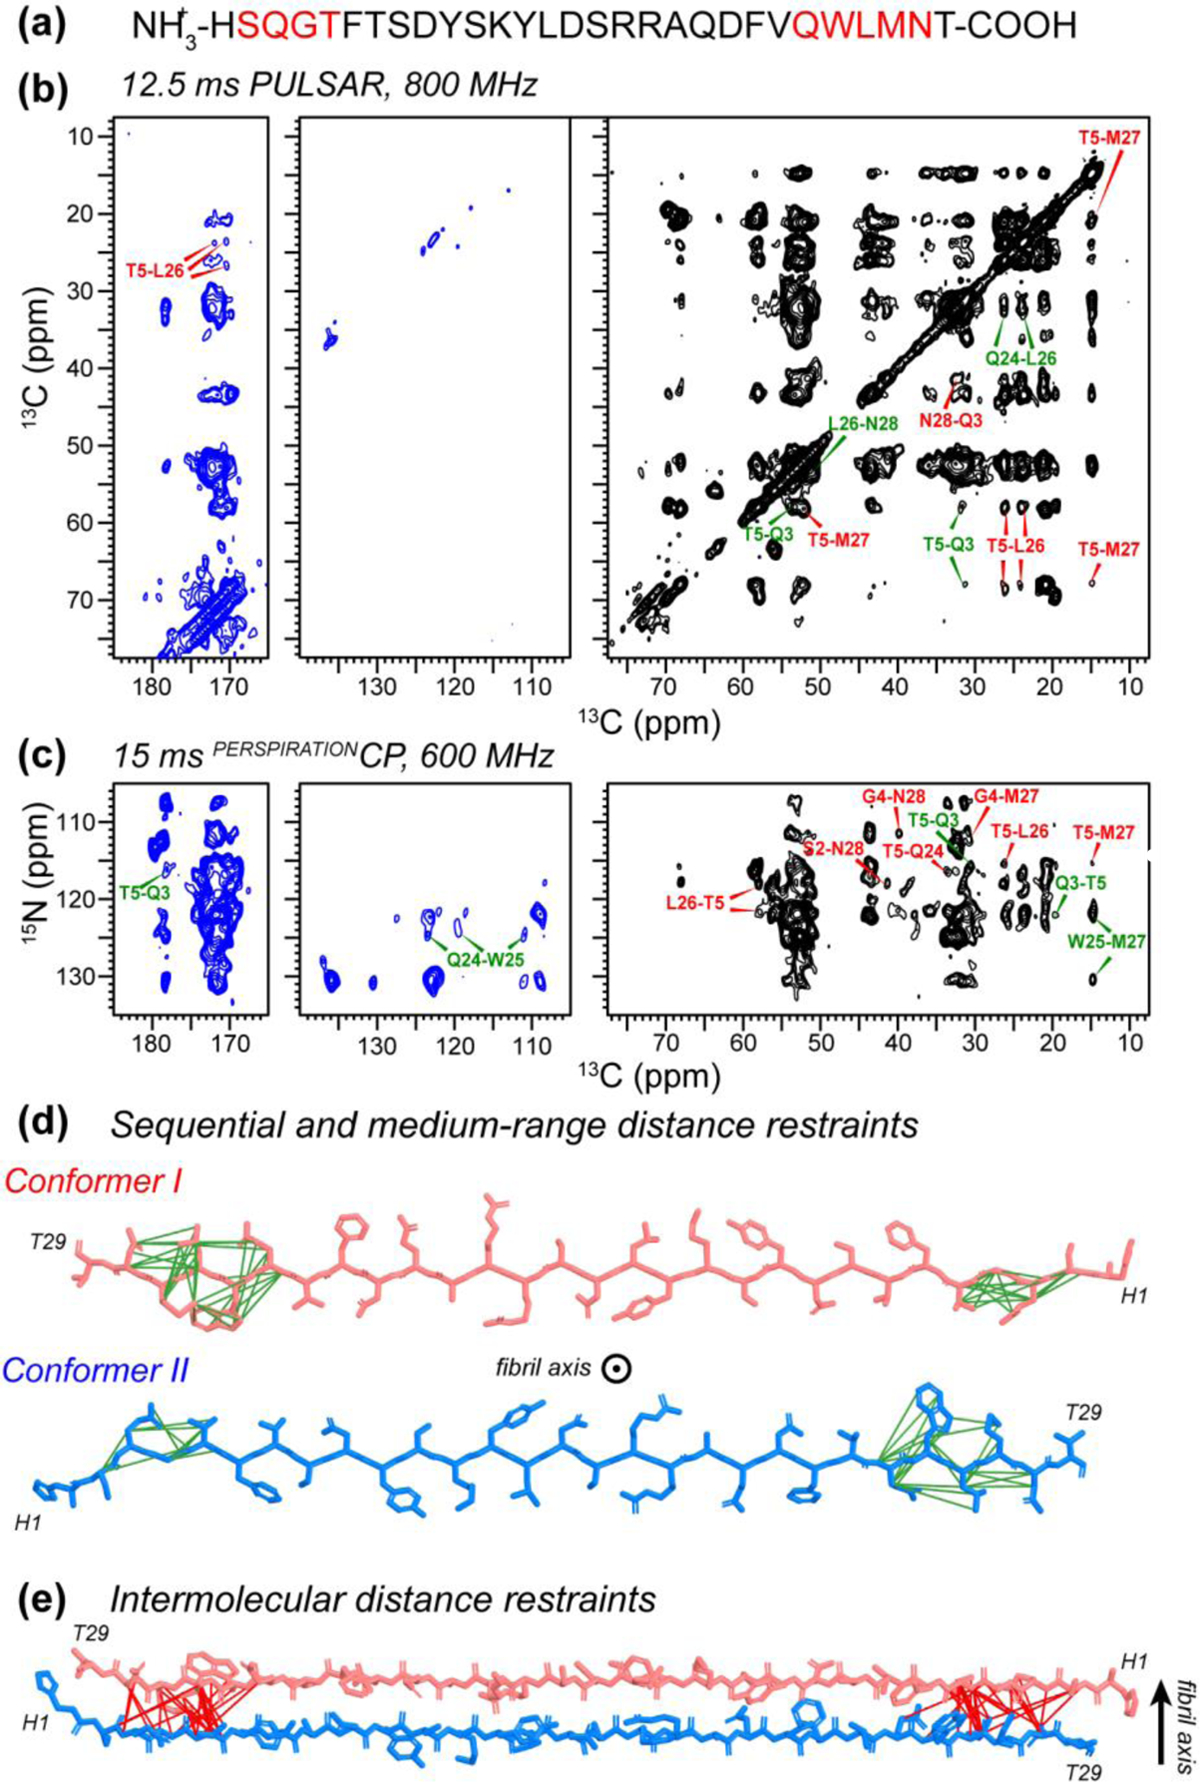
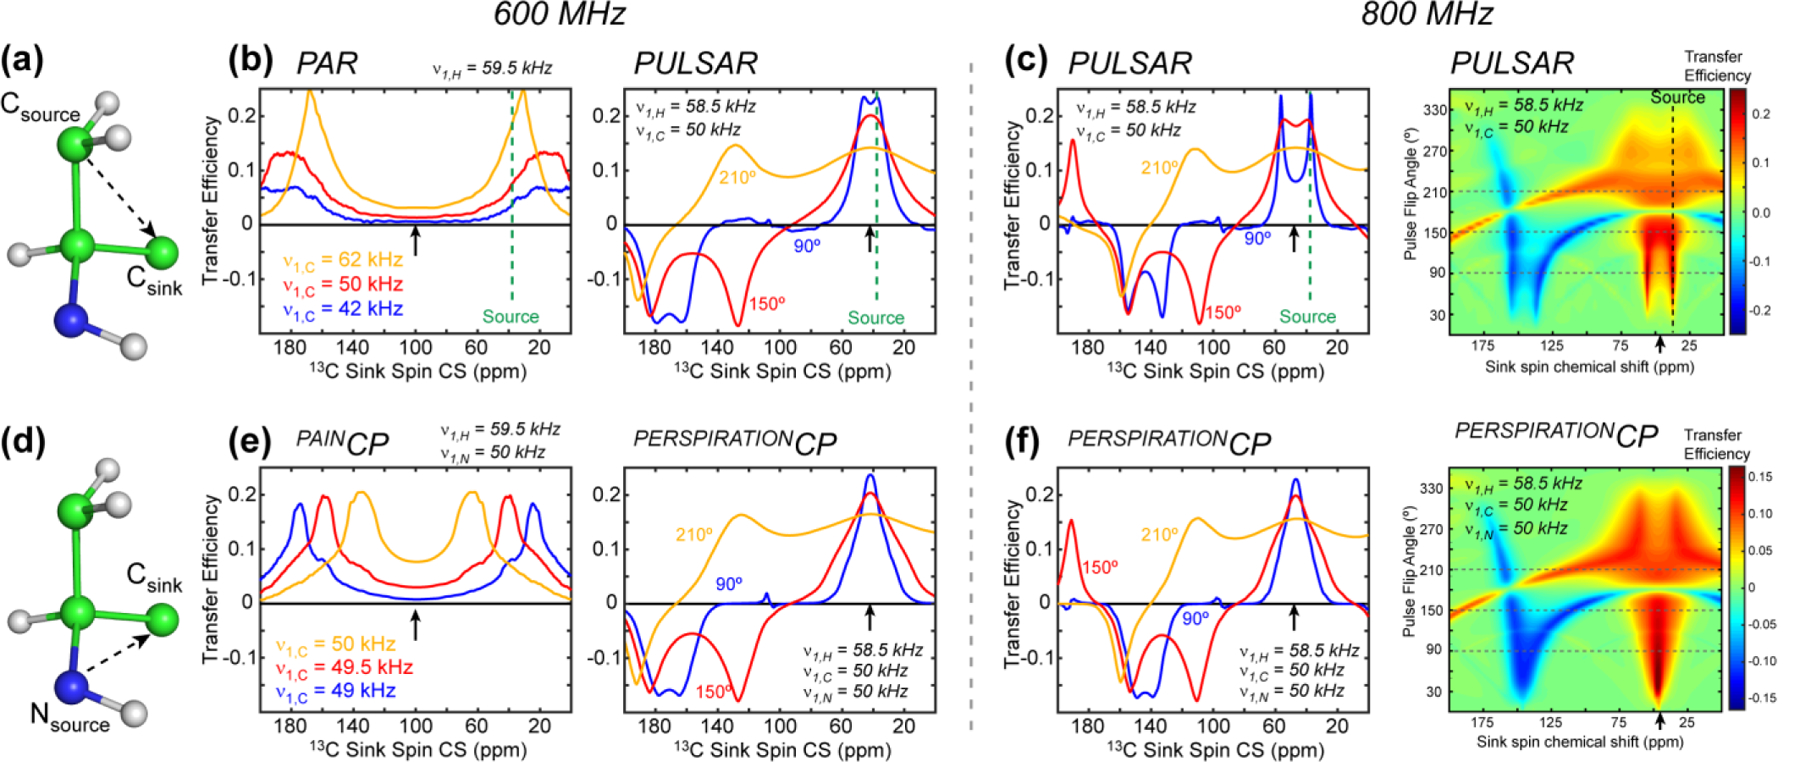
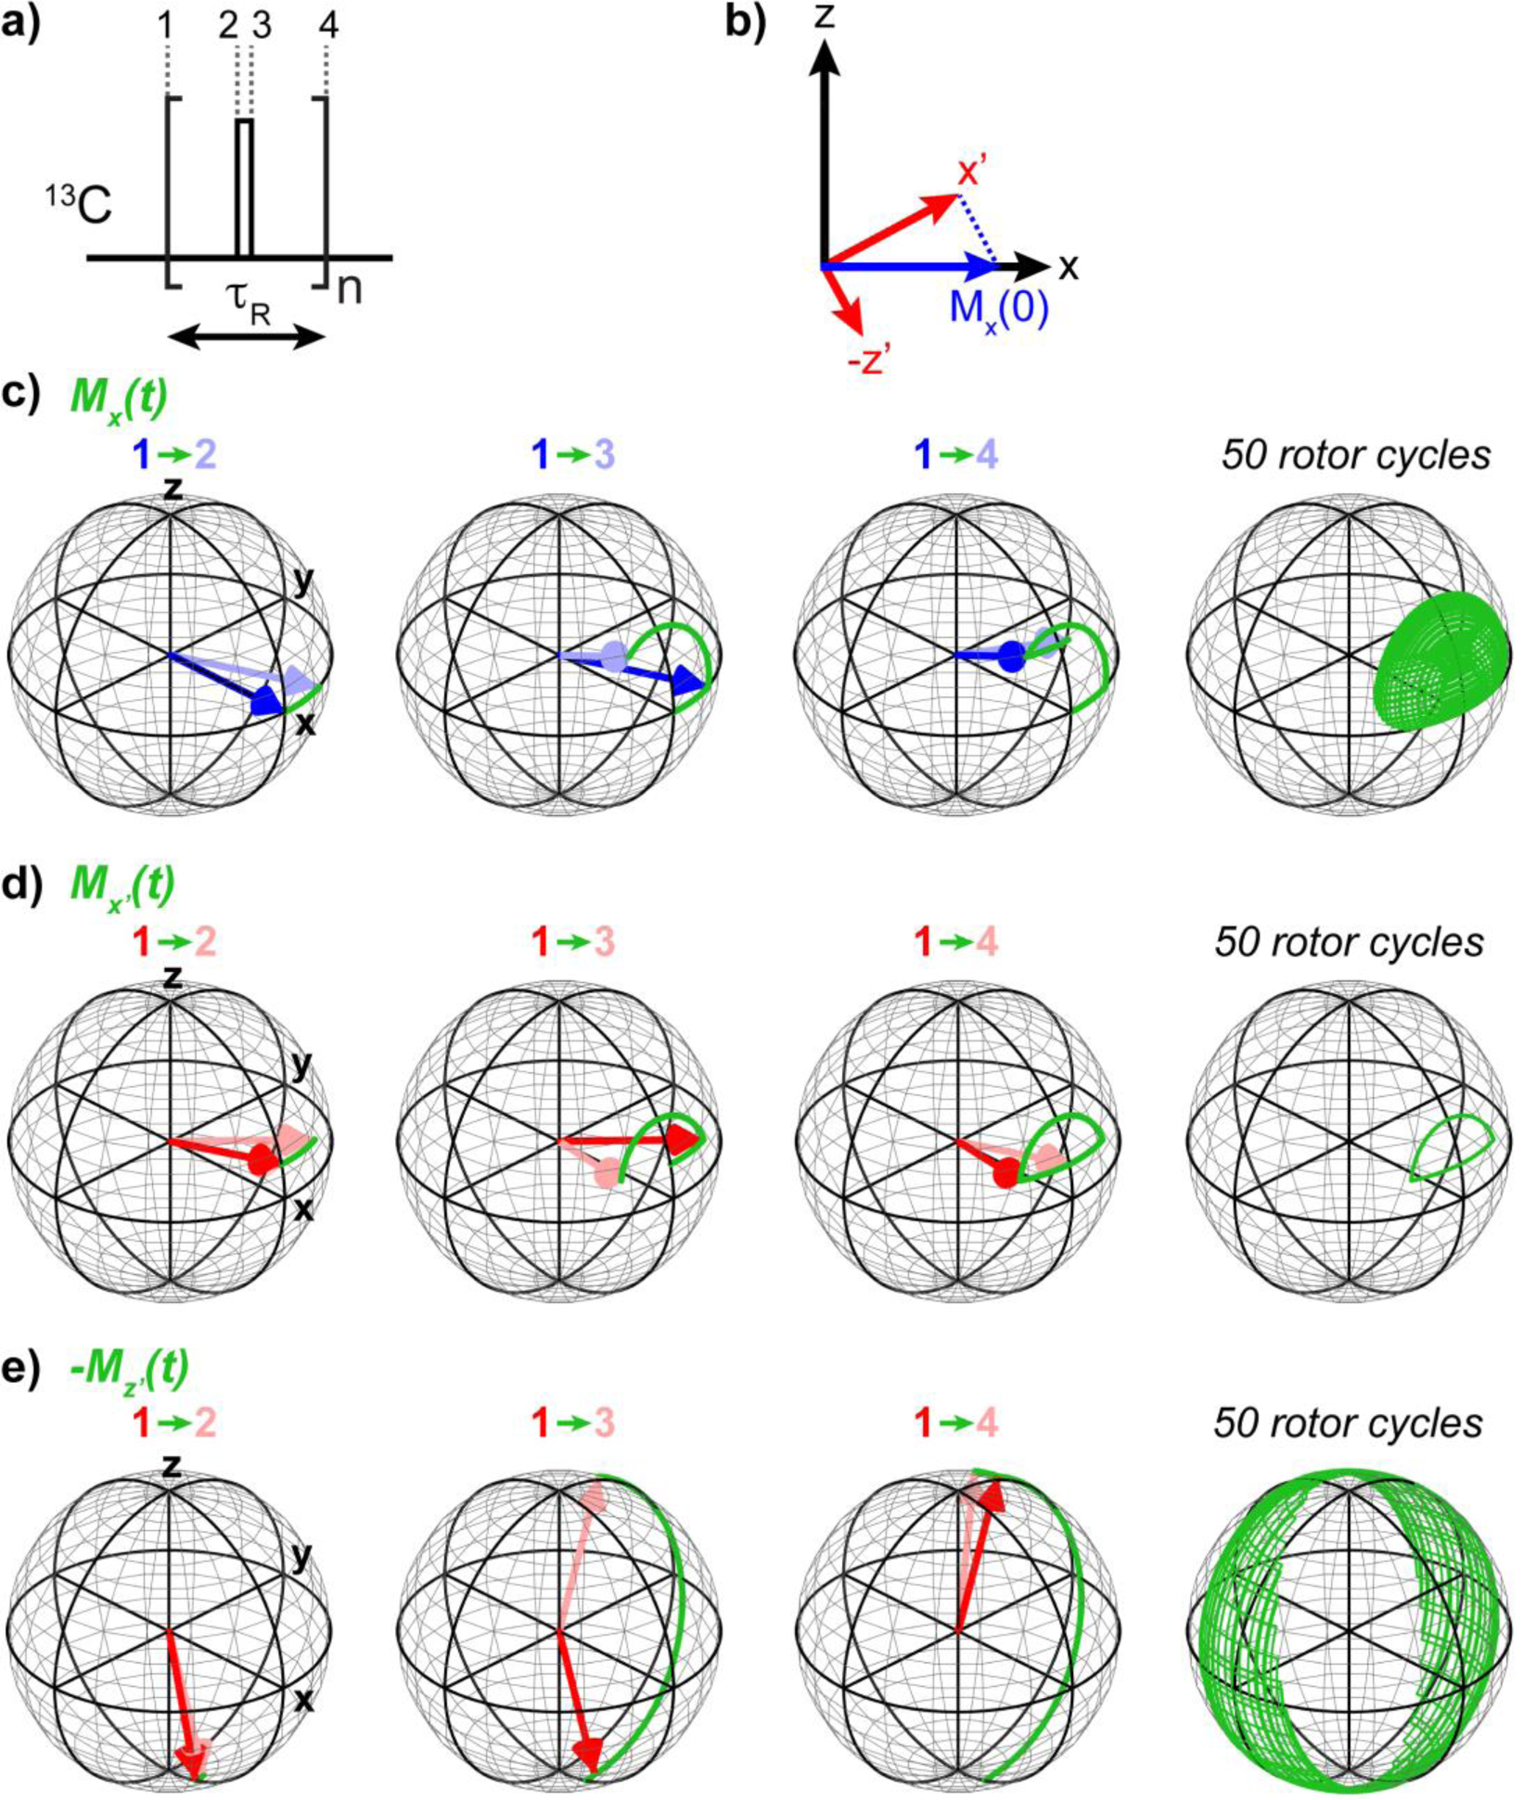
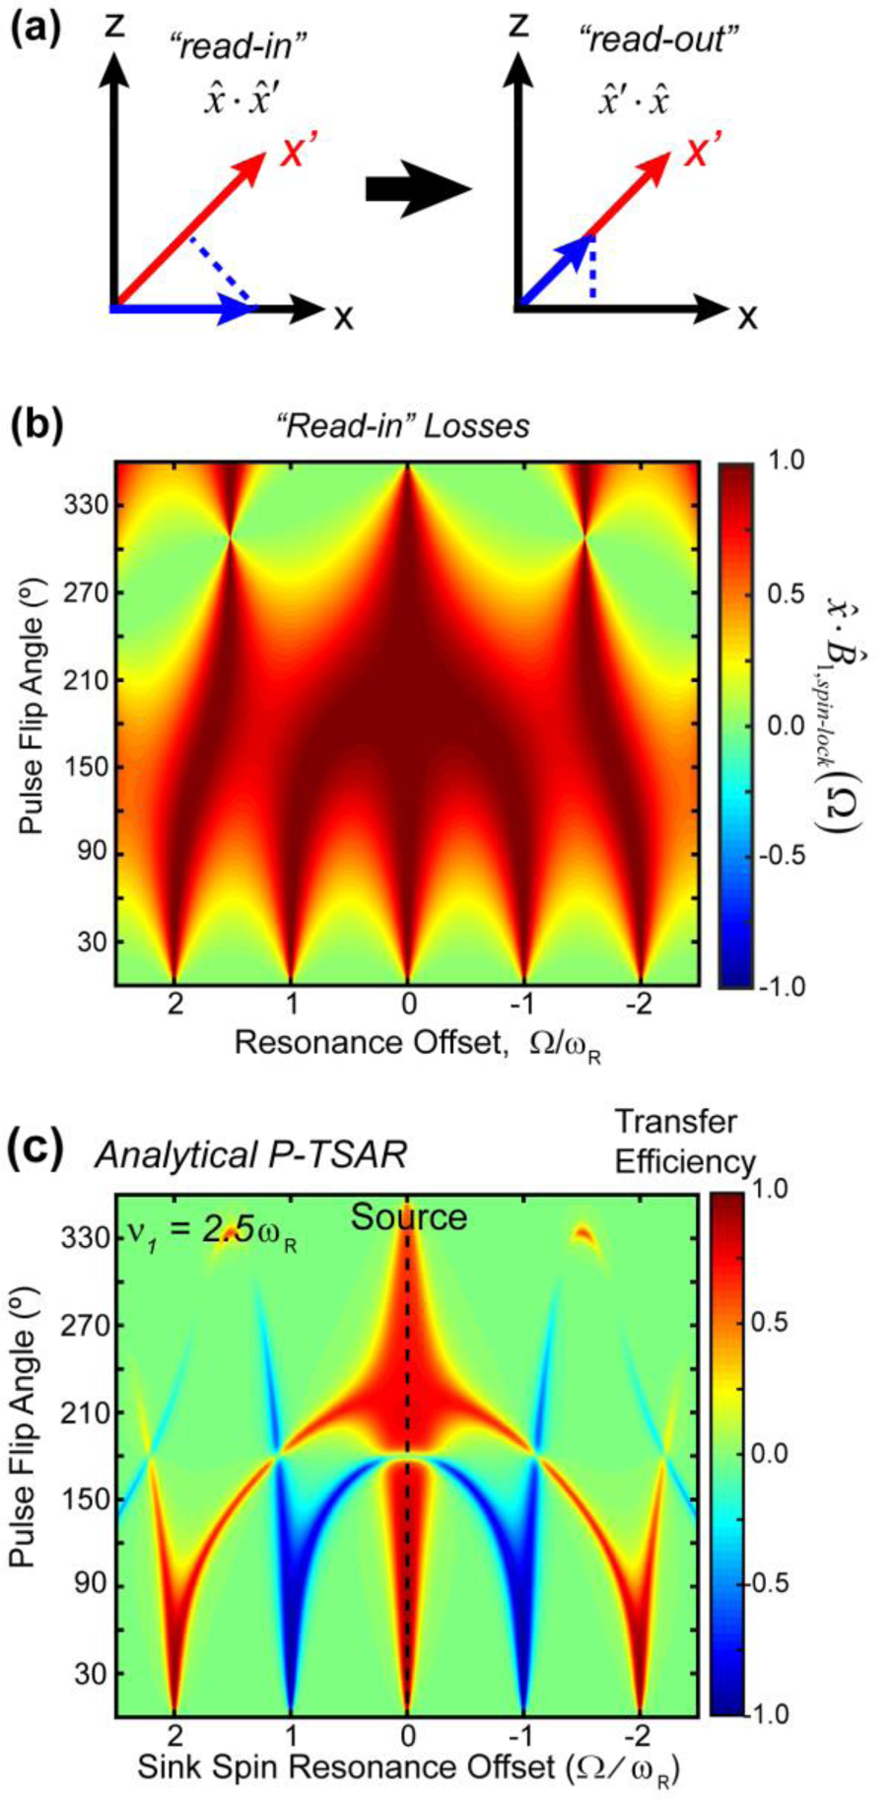
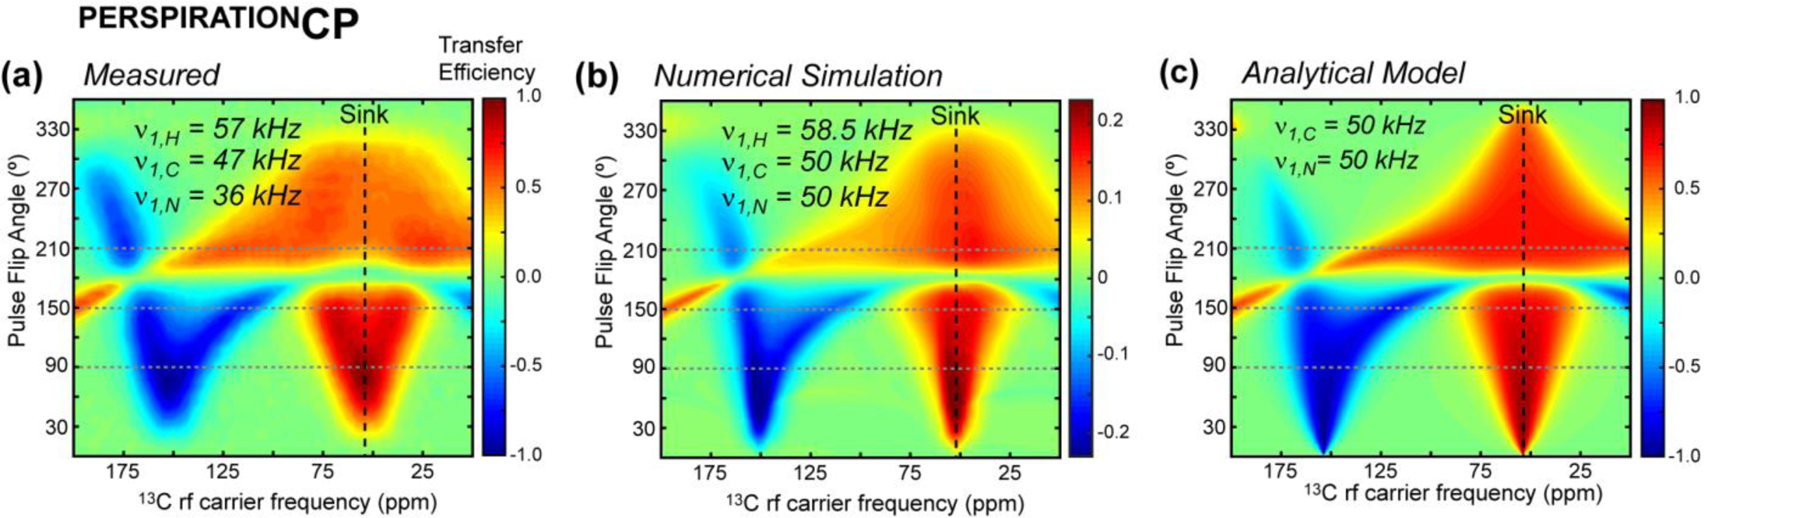
We present a class of pulsed third-spin-assisted recoupling (P-TSAR) magic-angle-spinning solid-state NMR techniques that achieve efficient polarization transfer over long distances to provide important restraints for structure determination. These experiments utilize second-order cross terms between strong 1H-13C and 1H-15N dipolar couplings to achieve 13C-13C and 15N-13C polarization transfer, similar to the principle of continuous-wave (CW) TSAR experiments. However, in contrast to the CW-TSAR experiments, these P-TSAR experiments require much less radiofrequency (rf) energy and allow a much simpler routine for optimizing the rf field strength. We call the technique PULSAR (pulsed proton-assisted recoupling) for homonuclear spin pairs. For heteronuclear spin pairs, we improve the recently introduced PERSPIRATIONCP (proton-enhanced rotor-echo short pulse irradiation cross-polarization) experiment by shifting the pulse positions and removing the z-filters, which significantly broaden the bandwidth and increase the efficiency of polarization transfer. We demonstrate the PULSAR and PERSPIRATIONCP techniques on the model protein GB1 and found cross peaks for distances as long as 10 and 8 Å for 13C-13C and 15N-13C spin pairs, respectively. We then apply these methods to the amyloid fibrils formed by the peptide hormone glucagon and show that long-range correlation peaks are readily observed to constrain intermolecular packing in this cross-β fibril. We provide an analytical model for the PULSAR and PERSPIRATIONCP experiments to explain the measured and simulated chemical shift dependence and pulse flip angle dependence of polarization transfer. These two techniques are useful for measuring long-range distance restraints to determine the three-dimensional structures of proteins and other biological macromolecules.


Figures

Figure 1.
Figure 1.
P-TSAR pulse sequences developed in this study (a, c), together with previously published CW-TSAR pulse sequences (b, d). (a) 2D 13C-13C PULSAR. (b) 2D 13C-13C PAR . (c) 2D 15N-13C PERSPIRATIONCP with spin-lock pulses in the center of the rotor period. (d) 2D 15N-13C PAINCP .
Figure 2.
Figure 2.
2D 13C-13C PULSAR and 15N-13C PERSPIRATIONCP spectra of GB1 measured on the 600 MHz spectrometer. The 13C rf carrier frequency was set at 42 ppm (orange arrow and dashed line). Positive intensities are shown in black and negative intensities are shown in blue. (a) 2D 13C PULSAR spectrum measured with 20 ms mixing and 150º recoupling pulses. The indirect dimension evolution time was 9.9 ms, while the direct dimension acquisition time was 21.5 ms. (b) Selected zoomed-in area and 1D cross sections of the PULSAR spectrum, showing some of the medium-range, long-range, and intermolecular correlation peaks. (c) GB1 structure, indicating one of the long-range contacts, between T25 and Y3, observed in the PULSAR spectrum. (d) 2D 15N-13C PERSPIRATIONCP spectrum measured with 15 ms mixing and 150˚ recoupling pulses. The 15N maximum evolution time was 10.2 ms while the direct dimension 13C acquisition time was 11.9 ms. (e) Selected zoomed-in area and 1D cross sections of the PERSPIRATIONCP spectrum, showing some of the medium-range, long-range, and intermolecular correlation peaks. (f) GB1 structure, indicating one of the long-range contacts, between V54 and L7, whose cross peak is observed in (d).
Figure 3.
Figure 3.
2D 13C-13C PULSAR spectra of GB1 measured at 800 MHz to investigate the offset dependence of the experiment. (a) 2D spectrum measured using 150º spin-lock pulses. (b) 2D spectrum measured using 210˚ spin-lock pulses. The rf fields were 50 kHz for 13C and 56 kHz for 1H and the mixing time was 20 ms. Both spectra were measured using a maximum evolution time of 7.4 ms and direct acquisition time of 15.3 ms. (c) Corresponding 1D cross sections illustrating the signal-to-noise ratios of the two spectra. The aromatic region was processed with Gaussian broadening to enhance the sensitivity, while the aliphatic and carbonyl regions were processed using a qsine window function to enhance the resolution. (d) 112 medium-range (green) and 176 long-range (red) correlations in GB1 obtained from these PULSAR and PERSPIRATIONCP spectra. (e) Lowest-energy ensemble of GB1 structures calculated based on the distance constraints obtained from the PULSAR and PERSPIRATIONCP spectra. The backbone ensemble shows that P-TSAR distance restraints combined with (ϕ, ψ) torsion angles are sufficient to determine the 3D structure of the protein. The M1-T11 β-strand is shown on the right to illustrate the sidechain conformations constrained by the long-range correlations.
Figure 4.
Figure 4.
2D PULSAR and PERSPIRATIONCP spectra of glucagon fibrils for obtaining distance restraints. (a) Amino acid sequence of glucagon. 13C, 15N-labeled residues are shown in red. (b) 12.5 ms 2D 13C PULSAR spectrum, measured on the 800 MHz spectrometer using 150º 13C recoupling pulses. The spectrum was measured with a maximum evolution time of 2.6 ms and a direct acquisition time of 12.3 ms. (c) 15 ms 2D 15N-13C PERSPIRATIONCP spectrum, measured on the 600 MHz spectrometer using 150º 13C and 15N recoupling pulses. The t1 evolution time was 6.6 ms while the direct dimension acquisition time was 11.9 ms. (d) Sequential and medium-range intramolecular correlations found in the PULSAR and PERSPIRATIONCP spectra. These correlations help to define the rotameric conformation of sidechains such as W25. (e) Intermolecular correlations define antiparallel hydrogen bonding of the β-strands along the fibril axis.
Figure 5.
Figure 5.
Numerical simulations of the chemical shift dependence of TSAR experiments. A mixing time of 20 ms was used in all simulations. (a) 7-spin system for simulating the PAR and PULSAR 13C-13C polarization transfer. The 15N spin is excluded in these simulations. (b) PAR and PULSAR efficiencies at 600 MHz as a function of the observed 13C chemical shifts. The 13C rf carrier frequency is denoted with a black arrow while the 13C source spin chemical shift is denoted with a green dashed line. (c) PULSAR transfer efficiency at 800 MHz. Right: 2D contour map of the PULSAR transfer efficiency as a function of sink spin chemical shift and pulsed spin-lock flip angle. (d) 8-spin system used for simulating PAINCP and PERSPIRATIONCP 15N-13C polarization transfer. (e) PAINCP and PERSPIRATIONCP efficiencies at 600 MHz as a function of the observed 13C chemical shifts. (f) PERSPIRATIONCP transfer efficiencies at 800 MHz. Right: 2D contour plot of the PERSPIRATIONCP transfer efficiency as a function of sink-spin chemical shift and pulse flip angle.
Figure 6.
Figure 6.
Magnetization trajectories under pulsed spin-lock. (a) Diagram of the basic pulsed spin-lock unit. The free evolution periods of 1→2 and 3→4 rotate the magnetization around the z-axis due to the isotropic chemical shift offset, while the rf pulse during 2→3 rotates the magnetization around the x-axis. (b) The pulsed spin-lock axis is tilted from the x-axis in the xz-plane. The initial x-magnetization, Mx(0), has components along the x’ and z’ axes. (c-e) Magnetization trajectories under pulsed spin-lock, calculated in MATLAB using an rf field of 50 kHz, a pulse flip angle of 90º, and a chemical shift offset of 17.5 ppm. (c) Trajectory of x-magnetization. The initial and final locations are not at the same spot on the Bloch sphere. (d) Trajectory of Mx'. This magnetization begins and ends the rotor period at the same position on the Bloch sphere, hence it is spin-locked. (e) Trajectory of Mz'. This magnetization traces out a broad trajectory, indicating rapid decay.
Figure 7.
Figure 7.
“Read-in” and “read-out” losses associated with a pulsed spin-lock. (a) “Reading in” and “reading out” of the pulsed spin-lock causes magnetization losses due to projection of one axis onto the other. (b) Contour plot showing the “read-in” losses as a function of pulse flip angle and resonance offset. 50 kHz rf pulses were used in these calculations. (c) Calculated P-TSAR efficiencies as a function of the sink-spin offset. The source spin (C1) was placed on resonance. Positive transfer occurs at the zero-quantum condition (φC1 = φC2) while negative transfer occurs at the double-quantum condition (φC1 + φC2 = 2π).
Figure 8.
Figure 8.
Measured, simulated, and calculated PERSPIRATIONCP polarization transfer efficiencies as a function of the 13C rf carrier frequency and pulse flip angle. The experiments were conducted on an 800 MHz spectrometer under 20 kHz MAS. Calculations were conducted for the same conditions. (a) Measured PERSPIRATIONCP efficiencies of f-MLF as a function of 13C carrier frequency and 13C pulse flip angle. The 2D heat map is generated from 25 × 80 1D spectra measured as a function of 13C pulsed flip angles (0˚ to 360˚ in 15˚ increments) and rf carrier frequencies (0 to 200 ppm in 2.5 ppm increments.) The integrated Cα band intensities (46 ppm to 59 ppm) of the spectra are represented in the plot. The rf field strengths of the PERSPIRATIONCP block are 57 kHz, 47 kHz, and 36 kHz for 1H, 13C and 15N, respectively. (b) Numerical simulations of PERSPIRATIONCP polarization transfer from an on-resonance 15N to 13Cα. (c) PERSPIRATIONCP transfer efficiencies calculated using the analytical model.

Similar articles

Cited by

References

    1. Wang SL; Munro RA; Shi LC; Kawamura I; Okitsu T; Wada A; Kim SY; Jung KH; Brown LS; Ladizhansky V., Solid-state NMR spectroscopy structure determination of a lipid-embedded heptahelical membrane protein. Nature Methods 2013, 10, 1007–1012. - PubMed
    1. Möbius K; Kazemi S; Güntert P; Jakob A; Heckel A; Becker-Baldus J; Glaubitz C., Global response of diacylglycerol kinase towards substrate binding observed by 2D and 3D MAS NMR. Sci. Rep 2019, 9, 3995. - PMC - PubMed
    1. Jekhmane S; Medeiros-Silva J; Li J; Kümmerer F; Müller-Hermes C; Baldus M; Roux B; Weingarth M., Shifts in the selectivity filter dynamics cause modal gating in K+ channels. Nat. Commun 2019, 10, 123. - PMC - PubMed
    1. Mandala VS; Loftis AR; Shcherbakov AA; Pentelute BL; Hong M., Atomic Structures of Closed and Open Influenza B M2 Proton Channel Reveal the Conduction Mechanism. Nat. Struc. Mol. Biol 2020, 27, 160–167. - PMC - PubMed
    1. Paravastu AK; Leapman RD; Yau W-M; Tycko R., Molecular structural basis for polymorphism in Alzheimer’s β-amyloid fibrils. Proc. Natl. Acad. Sci. USA 2008, 105, 18349–18354. - PMC - PubMed

Publication types