

Association of Social Distancing, Population Density, and Temperature With the Instantaneous Reproduction Number of SARS-CoV-2 in Counties Across the United States
- PMID: 32701162
- PMCID: PMC7378754
- DOI: 10.1001/jamanetworkopen.2020.16099
Association of Social Distancing, Population Density, and Temperature With the Instantaneous Reproduction Number of SARS-CoV-2 in Counties Across the United States
Abstract
Importance: Local variation in the transmission of severe acute respiratory syndrome coronavirus 2 (SARS-CoV-2) across the United States has not been well studied.
Objective: To examine the association of county-level factors with variation in the SARS-CoV-2 reproduction number over time.
Design, setting, and participants: This cohort study included 211 counties, representing state capitals and cities with at least 100 000 residents and including 178 892 208 US residents, in 46 states and the District of Columbia between February 25, 2020, and April 23, 2020.
Exposures: Social distancing, measured by percentage change in visits to nonessential businesses; population density; and daily wet-bulb temperatures.
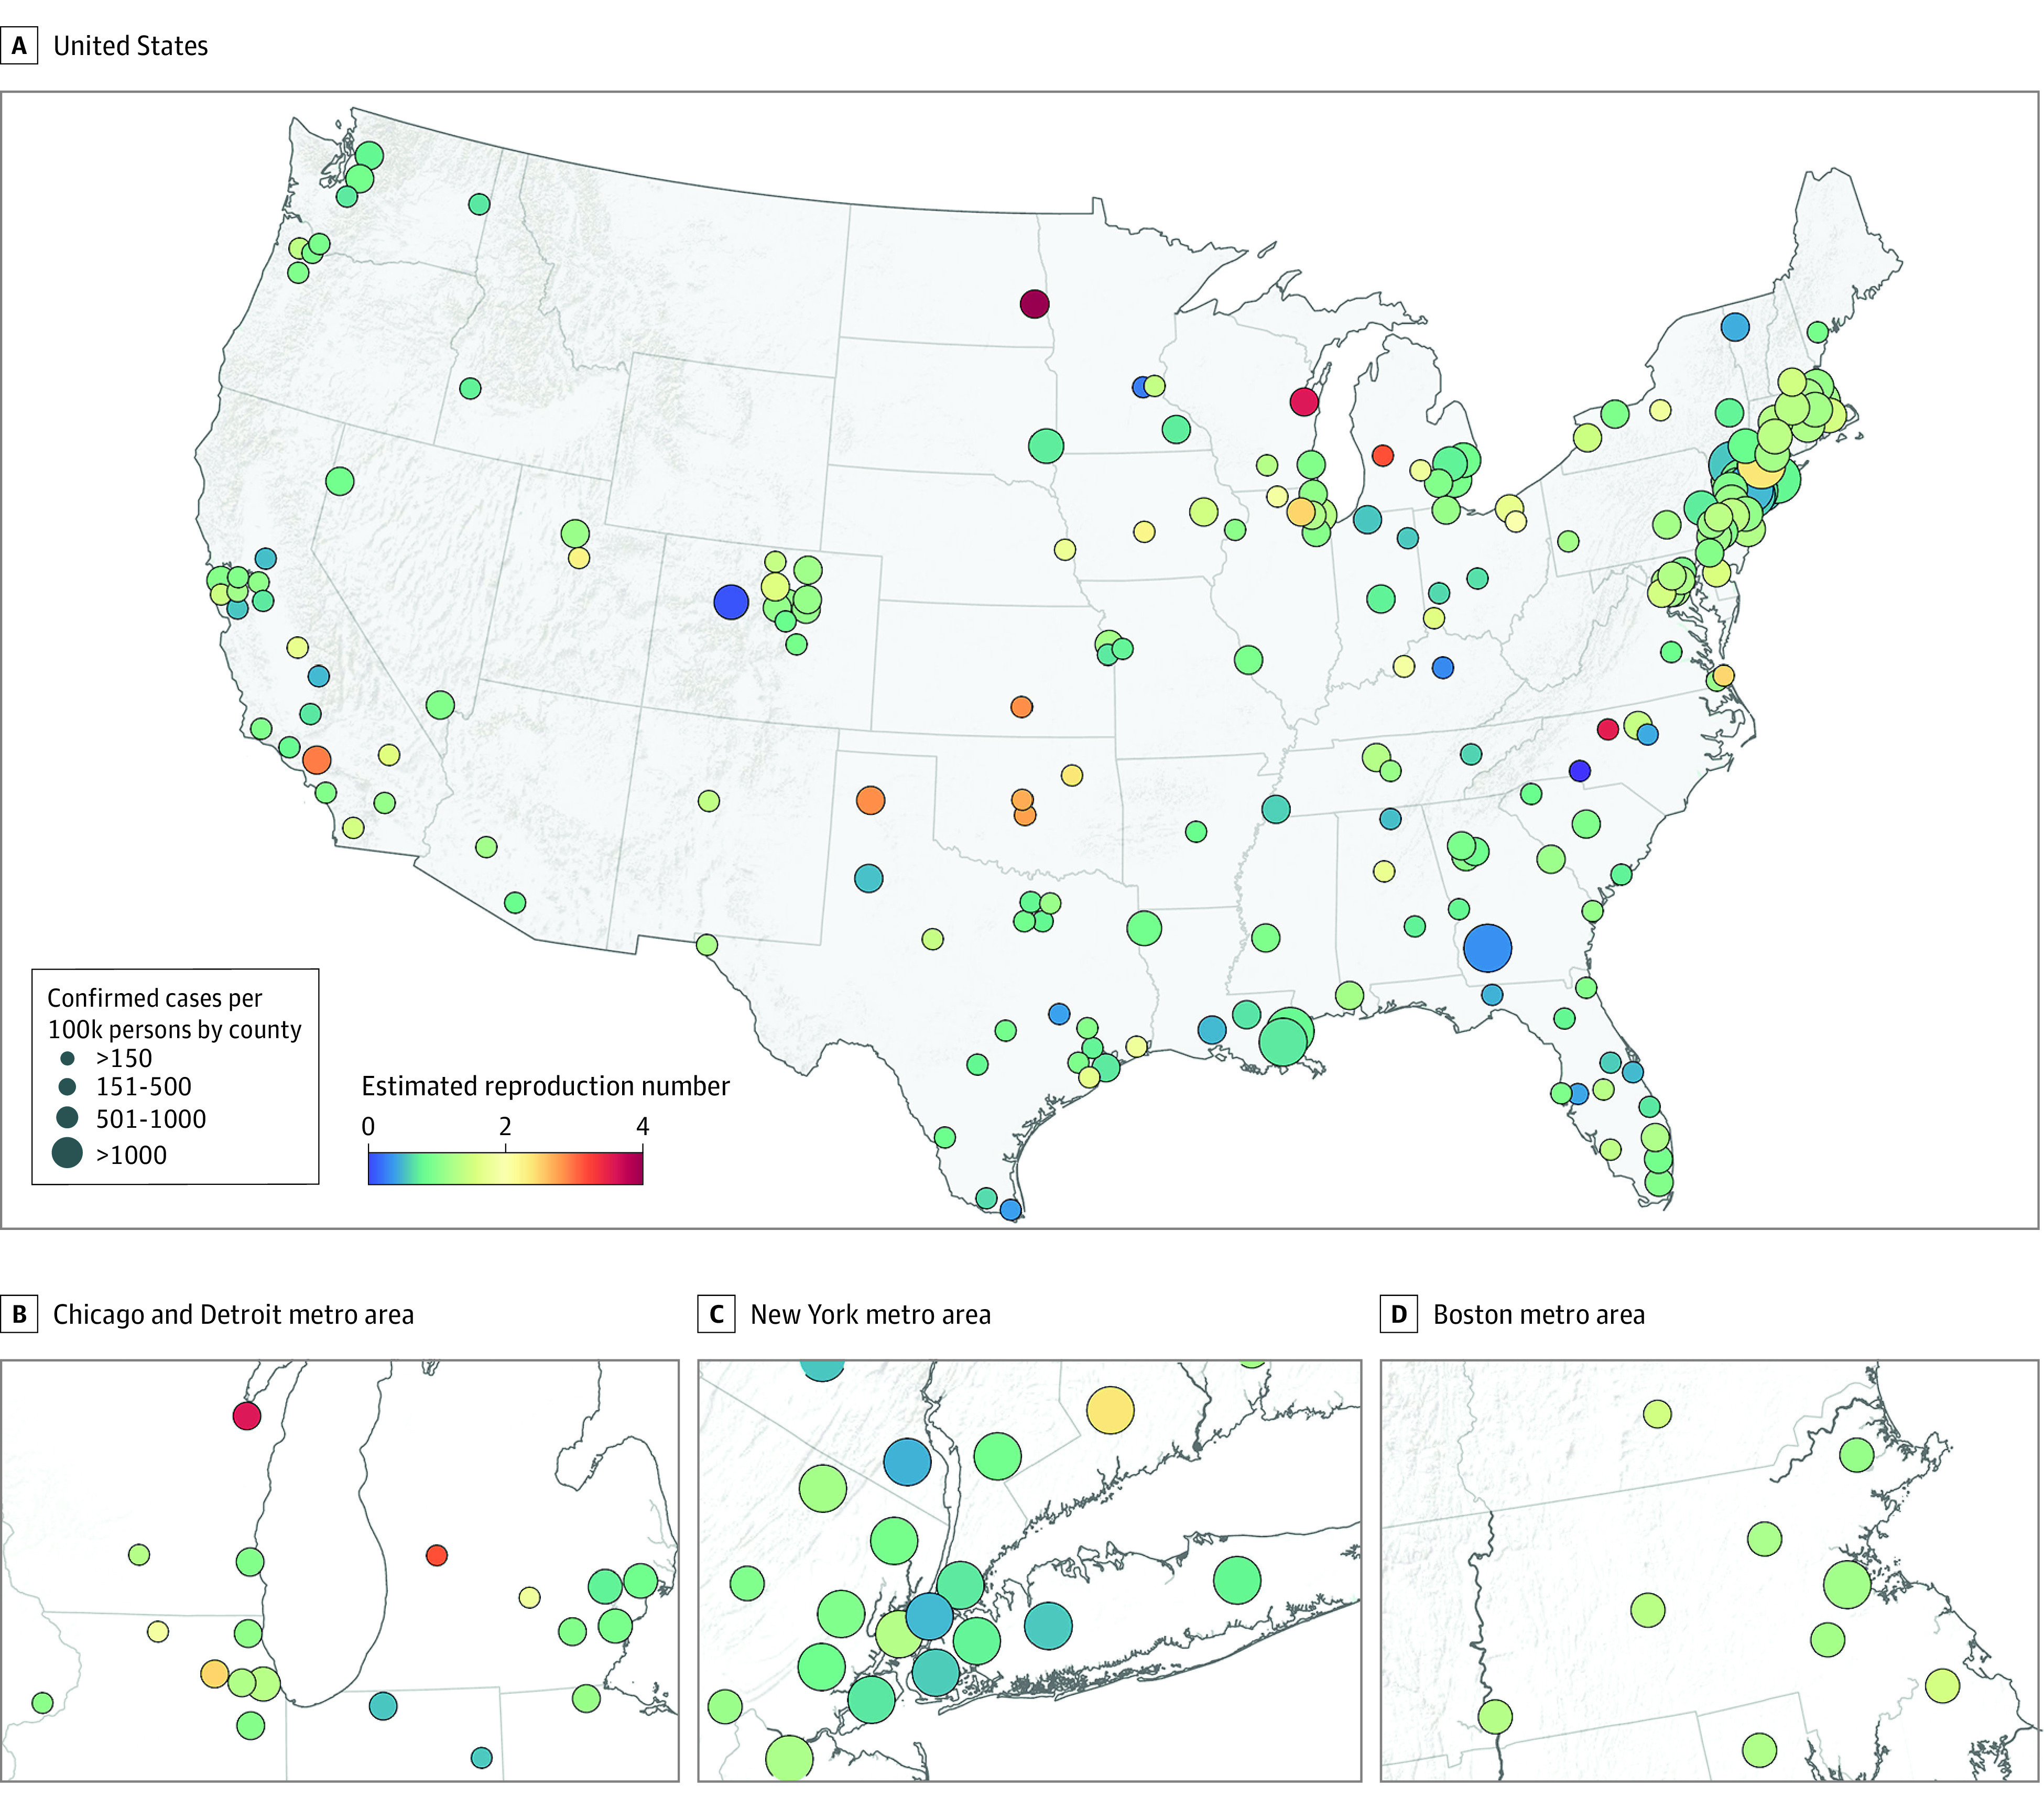
Main outcomes and measures: Instantaneous reproduction number (Rt), or cases generated by each incident case at a given time, estimated from daily case incidence data.
Results: The 211 counties contained 178 892 208 of 326 289 971 US residents (54.8%). Median (interquartile range) population density was 1022.7 (471.2-1846.0) people per square mile. The mean (SD) peak reduction in visits to nonessential business between April 6 and April 19, as the country was sheltering in place, was 68.7% (7.9%). Median (interquartile range) daily wet-bulb temperatures were 7.5 (3.8-12.8) °C. Median (interquartile range) case incidence and fatality rates per 100 000 people were approximately 10 times higher for the top decile of densely populated counties (1185.2 [313.2-1891.2] cases; 43.7 [10.4-106.7] deaths) than for counties in the lowest density quartile (121.4 [87.8-175.4] cases; 4.2 [1.9-8.0] deaths). Mean (SD) Rt in the first 2 weeks was 5.7 (2.5) in the top decile compared with 3.1 (1.2) in the lowest quartile. In multivariable analysis, a 50% decrease in visits to nonessential businesses was associated with a 45% decrease in Rt (95% CI, 43%-49%). From a relative Rt at 0 °C of 2.13 (95% CI, 1.89-2.40), relative Rt decreased to a minimum as temperatures warmed to 11 °C, increased between 11 and 20 °C (1.61; 95% CI, 1.42-1.84) and then declined again at temperatures greater than 20 °C. With a 70% reduction in visits to nonessential business, 202 counties (95.7%) were estimated to fall below a threshold Rt of 1.0, including 17 of 21 counties (81.0%) in the top density decile and 52 of 53 counties (98.1%) in the lowest density quartile.2.
Conclusions and relevance: In this cohort study, social distancing, lower population density, and temperate weather were associated with a decreased Rt for SARS-CoV-2 in counties across the United States. These associations could inform selective public policy planning in communities during the coronavirus disease 2019 pandemic.
Conflict of interest statement
Figures


References
-
- Children’s Hospital of Philadelphia Exempt research. Accessed May 25, 2020. https://irb.research.chop.edu/exempt-research
-
- von Elm E, Altman DG, Egger M, Pocock SJ, Gøtzsche PC, Vandenbroucke JP; STROBE Initiative . The Strengthening the Reporting of Observational Studies in Epidemiology (STROBE) statement: guidelines for reporting observational studies. J Clin Epidemiol. 2008;61(4):344-349. doi: 10.1016/j.jclinepi.2007.11.008 - DOI - PubMed
MeSH terms
Grants and funding
LinkOut - more resources
Full Text Sources
Medical
Miscellaneous
