. 2020 Aug 20;124(33):7229-7238.
doi: 10.1021/acs.jpcb.0c04714. Epub 2020 Aug 6.

Composition-Dependent Hydrogen-Bonding Motifs and Dynamics in Brønsted Acid-Base Mixtures

Affiliations

Composition-Dependent Hydrogen-Bonding Motifs and Dynamics in Brønsted Acid-Base Mixtures

Christian Malm et al. J Phys Chem B. .

Abstract

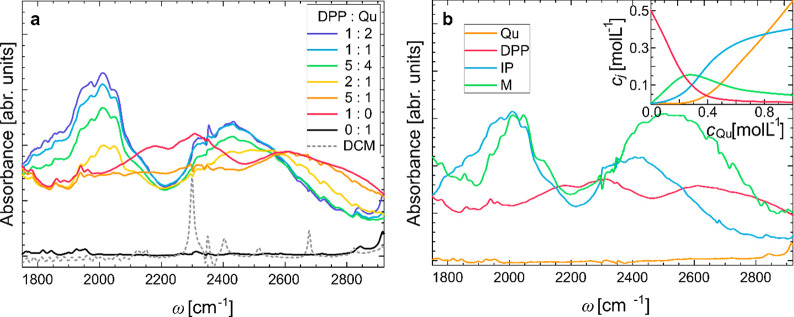
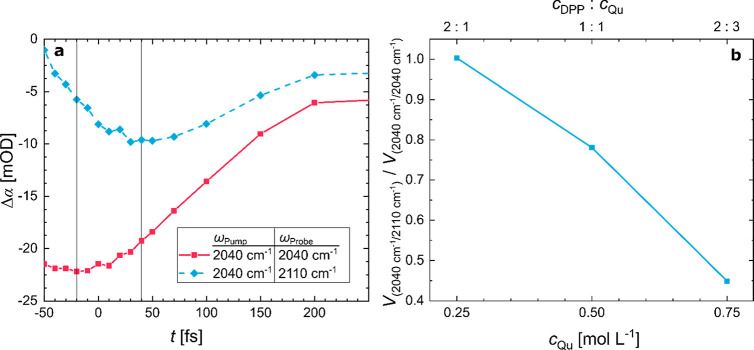
In recent years the interaction of organophosphates and imines, which is at the core of Brønsted acid organocatalysis, has been established to be based on strong ionic hydrogen bonds. Yet, besides the formation of homodimers consisting of two acid molecules and heterodimers consisting of one acid and one base, also multimeric molecular aggregates are formed in solution. These multimeric aggregates consist of one base and several acid molecules. The details of the intermolecular bonding in such aggregates, however, have remained elusive. To characterize composition-dependent bonding and bonding dynamics in these aggregates, we use linear and nonlinear infrared (IR) spectroscopy at varying molar ratios of diphenyl phosphoric acid and quinaldine. We identify the individual aggregate species, giving rise to the structured, strong, and very broad infrared absorptions, which span more than 1000 cm-1. Linear infrared spectra and density functional theory calculations of the proton transfer potential show that doubly ionic intermolecular hydrogen bonds between the acid and the base lead to absorptions which peak at ∼2040 cm-1. The contribution of singly ionic hydrogen bonds between an acid anion and an acid molecule is observed at higher frequencies. As common to such strong hydrogen bonds, ultrafast IR spectroscopy reveals rapid, ∼ 100 fs, dissipation of energy from the proton transfer coordinate. Yet, the full dissipation of the excess energy occurs on a ∼0.8-1.1 ps time scale, which becomes longer when multimers dominate. Our results thus demonstrate the coupling and collectivity of the hydrogen bonds within these complexes, which enable efficient energy transfer.


Conflict of interest statement

The authors declare no competing financial interest.

Figures

Figure 1
Figure 1
(a) Structure of an ion-pair consisting of one Qu and one DPP molecule. (b) For the simplest multimeric structure, i.e., a trimer, an additional DPP molecule donates a hydrogen bond to the acid anion. In panel (c) a DPP homodimer is schematically shown.
Figure 2
Figure 2
(a) FTIR spectra for mixtures of DPP (0.5 mol L–1) with varying concentrations of Qu in DCM. The spectrum of Qu in DCM (solid black line) shows essentially no spectral features in this frequency region. A solution of DPP in DCM (red solid line) exhibits a very broad band spanning more than 1000 cm–1 due to DPP–DPP homodimers. In mixtures of DPP and Qu two structured spectral features at ∼2040 and ∼2500 cm–1 are present. Contributions of the solvent (dotted gray line) have been subtracted from the mixture spectra. (b) Component spectra of Qu, DPP homodimers (DPP), ion-pairs (IP), and multimers (M). The decomposition is based on the variation of the different species concentrations based on the equilibria reported in ref (30) (inset).
Figure 3
Figure 3
Potential energy profile along the proton transfer coordinate for hydrogen bonds between (a) Qu and DPP, (b) between two DPP molecules within a homodimer, and (c) between DPP and a DPP anion with lithium as counterion. The potentials and estimated transition energies are sensitive to the O–O or O–N distance (molecular separation).,, Yet, calculations with fixed intermolecular distance allow for assessing the effect of variation of the hydrogen-bond acceptor. Schematic molecular structures together with the proton transfer coordinate (shaded red lines) are shown on the top of each panel. Symbols correspond to relative energies as obtained from a nonrelaxed energy scan for the hydrogen-bonding proton displaced along the N–O (or O–O coordinate). Black solid lines show quartic fits to the potential (see text and the Supporting Information for details). For better comparison, the potential shown in (a) is shown as dotted line in panels (b) and (c). Energy levels of the three lowest eigenstates |0>, |1>, and |2> obtained by numerically solving the one-dimensional Schrödinger equation are shown as dashed lines. The associated wave functions are depicted as solid lines and were vertically offset by the corresponding energies for clarity. Transition frequencies are highlighted with double-headed arrows.
Figure 4
Figure 4
2D-IR spectra at t = 50 fs for solutions of 0.5 mol L1 DPP and (a) 0.75, (b) 0.5, and (c) 0.25 mol L1 Qu in DCM. All spectra show a bleach at 2040 cm1/2040 cm1, which is related to ionic hydrogen bonds. With increasing DPP concentration an off-diagonal bleaching signal at 2040 cm1/2100 cm1 appears.
Figure 5
Figure 5
(a) Time traces of selected 2D-IR peaks (2040 cm1/2040 cm1) and (2040 cm1/2110 cm1) for an equimolar mixture of DPP and Qu in DCM. A ∼60 fs delayed appearance of the maximum bleach for the 2040 cm1/2110 cm1 trace, relative to the 2040 cm1/2040 cm1 trace, can be observed. The two vertical solid gray lines mark the maximum bleaching of both signals. (b) Ratio of the volume integrals of the off-diagonal peak to the on-diagonal peak vs concentration of Qu at t = 50 fs. The integrals taken at pump frequencies from 1980 to 2083 cm1 and probe frequencies 1980–2083 cm1 or 2083–2230 cm1 evidence the increase of the 2040 cm1/2100 cm1 peak with increasing DPP to Qu ratio. Lines connecting the symbols are to a guide the eye.
Figure 6
Figure 6
(a) Transient infrared spectra of an equimolar mixture of Qu and DPP showing a structured peak at ∼2040 cm1 and a shoulder at ∼2100 cm1, which appears ∼100 fs delayed. (b) Delay traces at selected probing frequencies for an equimolar mixture of DPP and Qu in DCM. Symbols in panels (a) and (b) show experimental data, and solid lines show the fits with the three-state kinetic model (see also the Supporting Information). The dashed red line in panel (b) shows the fit with a two-state model at ωProbe = 2040 cm1. (c) Relaxation times as a function of concentration of Qu, as extracted from fitting the kinetic model (see the inset of panel c) to the transient data.

References

    1. Gilli P.; Pretto L.; Bertolasi V.; Gilli G. Predicting Hydrogen-Bond Strengths from Acid-Base Molecular Properties. The pKa Slide Rule: Toward the Solution of a Long-Lasting Problem. Acc. Chem. Res. 2009, 42, 33–44. 10.1021/ar800001k. - DOI - PubMed
    1. Petersen P. B.; Roberts S. T.; Ramasesha K.; Nocera D. G.; Tokmakoff A. Ultrafast N-H Vibrational Dynamics of Cyclic Doubly Hydrogen-Bonded Homo- and Heterodimers. J. Phys. Chem. B 2008, 112, 13167–13171. 10.1021/jp805338h. - DOI - PMC - PubMed
    1. Carra C.; Iordanova N.; Hammes-Schiffer S. Proton-Coupled Electron Transfer in a Model for Tyrosine Oxidation in Photosystem II. J. Am. Chem. Soc. 2003, 125, 10429–10436. 10.1021/ja035588z. - DOI - PubMed
    1. Perrin C. L.; Nielson J. B. Strong” Hydrogen Bonds in Chemistry and Biology. Annu. Rev. Phys. Chem. 1997, 48, 511–544. 10.1146/annurev.physchem.48.1.511. - DOI - PubMed
    1. Parmar D.; Sugiono E.; Raja S.; Rueping M. Complete Field Guide to Asymmetric BINOL-Phosphate Derived Brønsted Acid and Metal Catalysis: History and Classification by Mode of Activation; Brønsted Acidity, Hydrogen Bonding, Ion Pairing, and Metal Phosphates. Chem. Rev. 2014, 114, 9047–9153. 10.1021/cr5001496. - DOI - PubMed

Publication types