. 2020 Aug;161(8):1906-1924.
doi: 10.1097/j.pain.0000000000001884.

Postnatal maturation of spinal dynorphin circuits and their role in somatosensation

Affiliations

Postnatal maturation of spinal dynorphin circuits and their role in somatosensation

Chelsie L Brewer et al. Pain. 2020 Aug.

Abstract

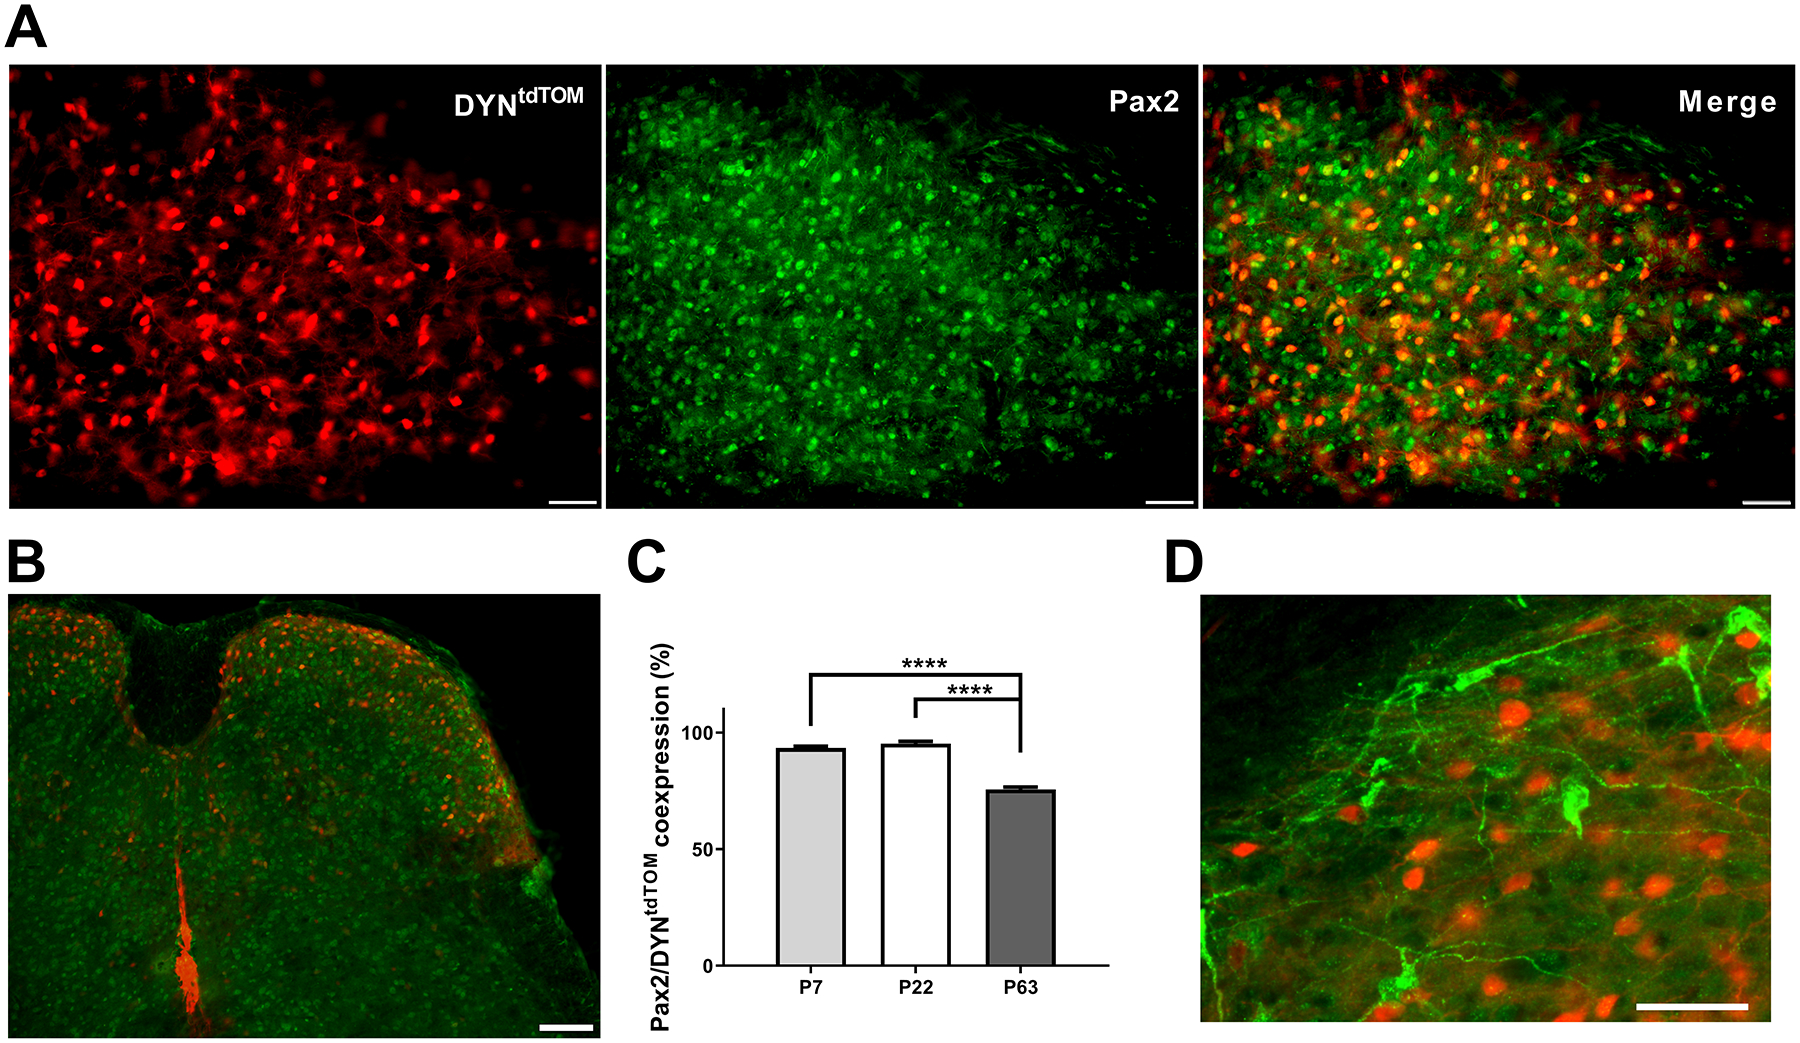
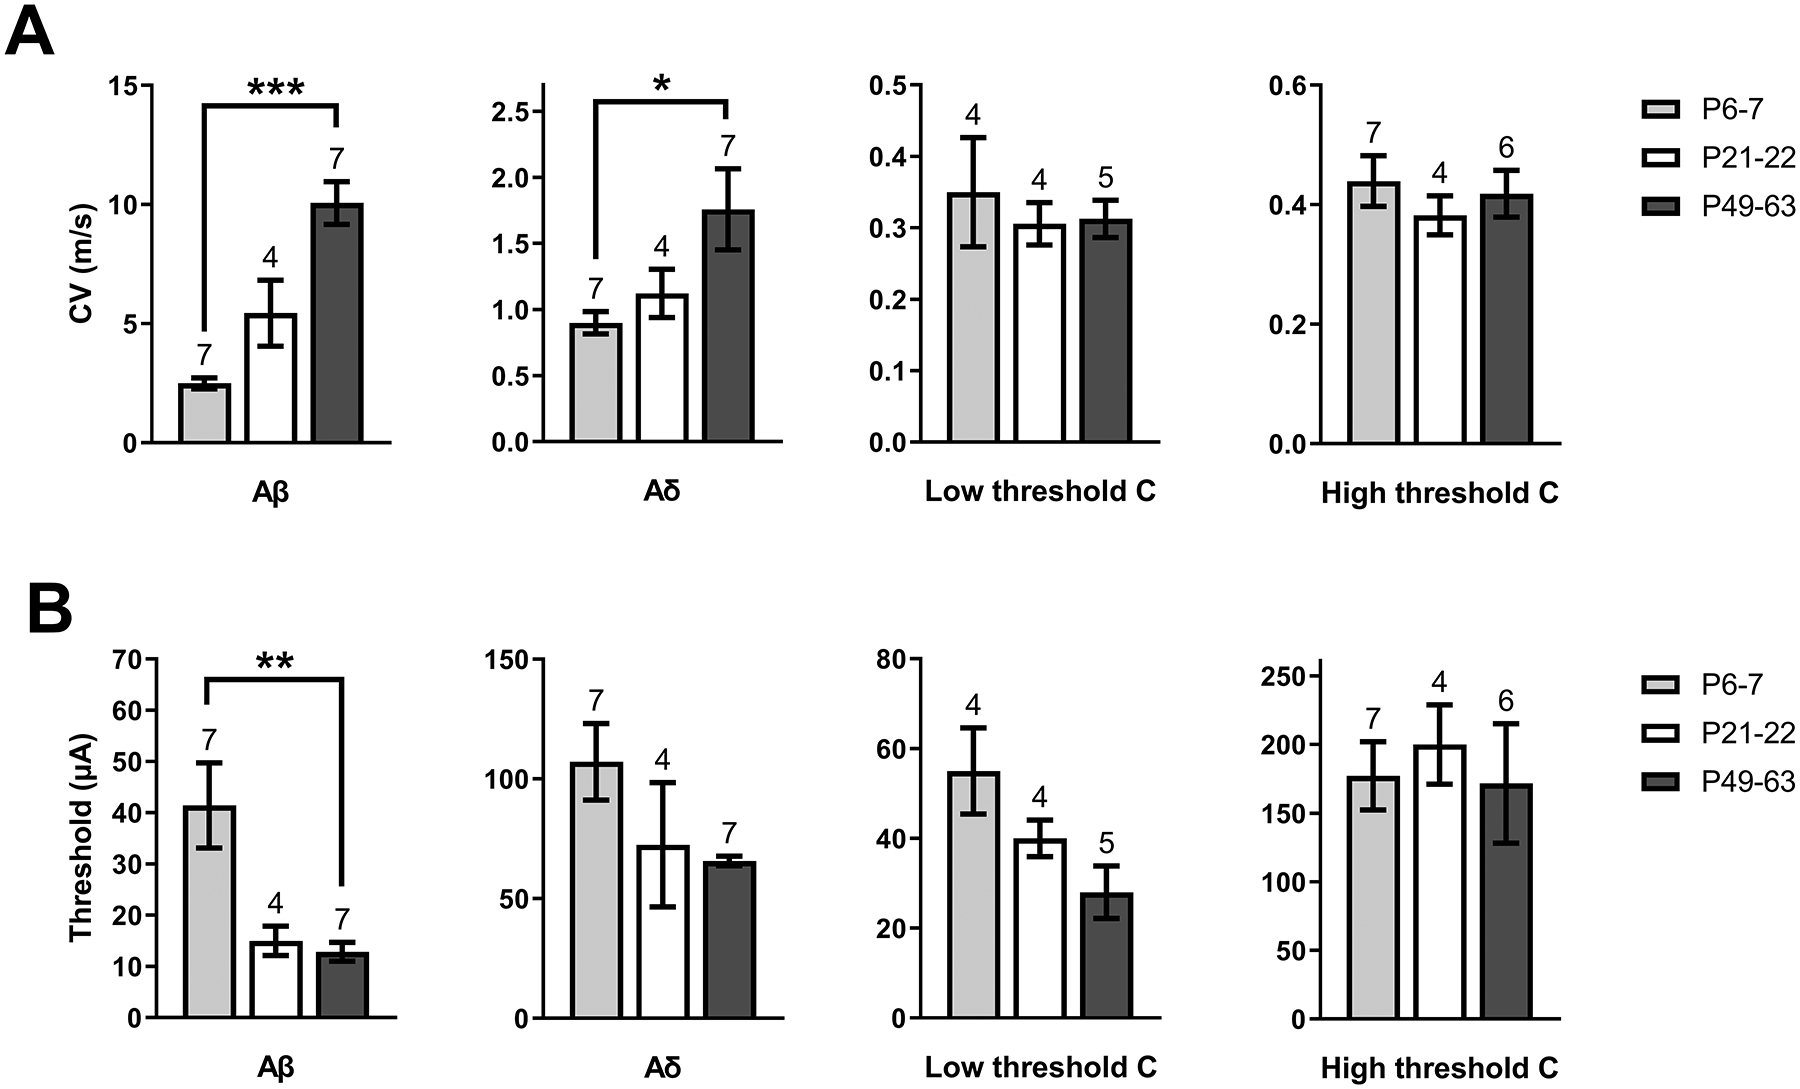
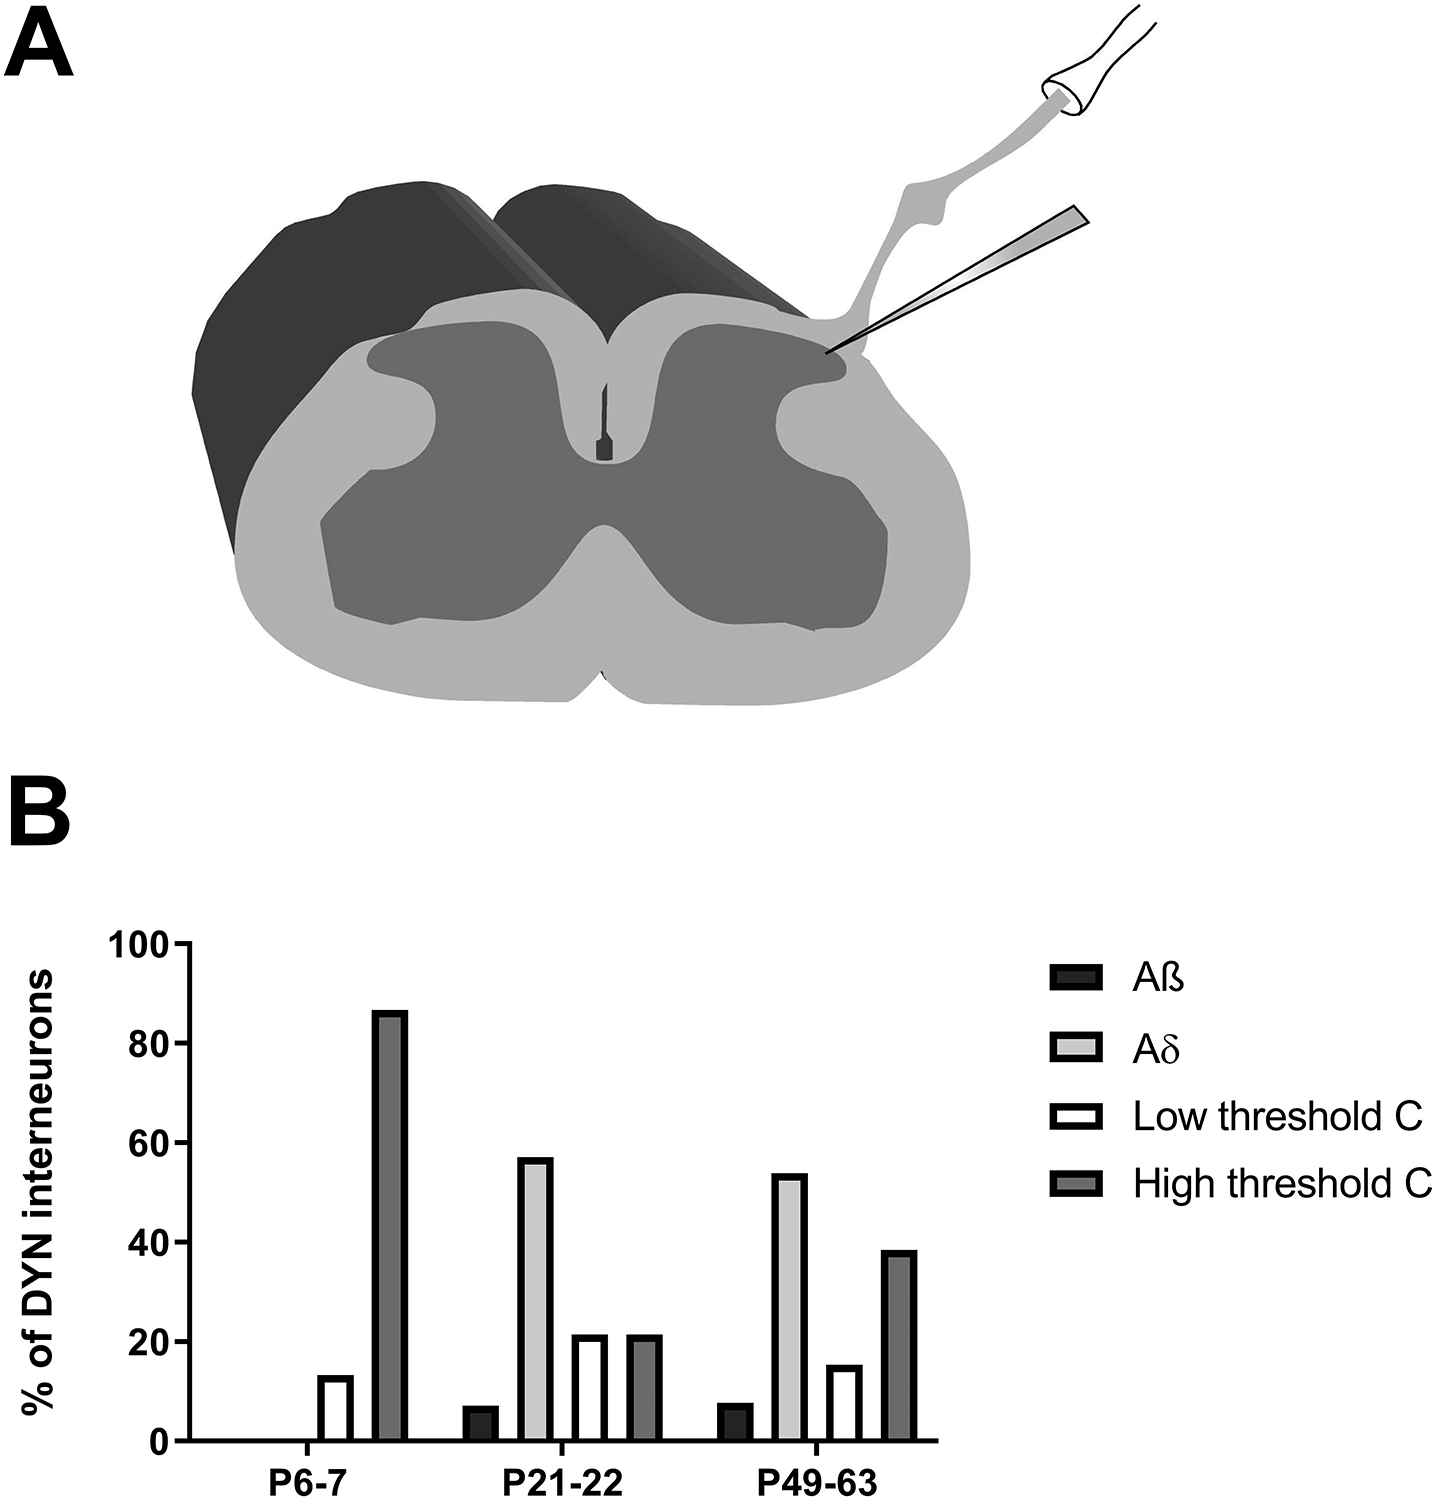
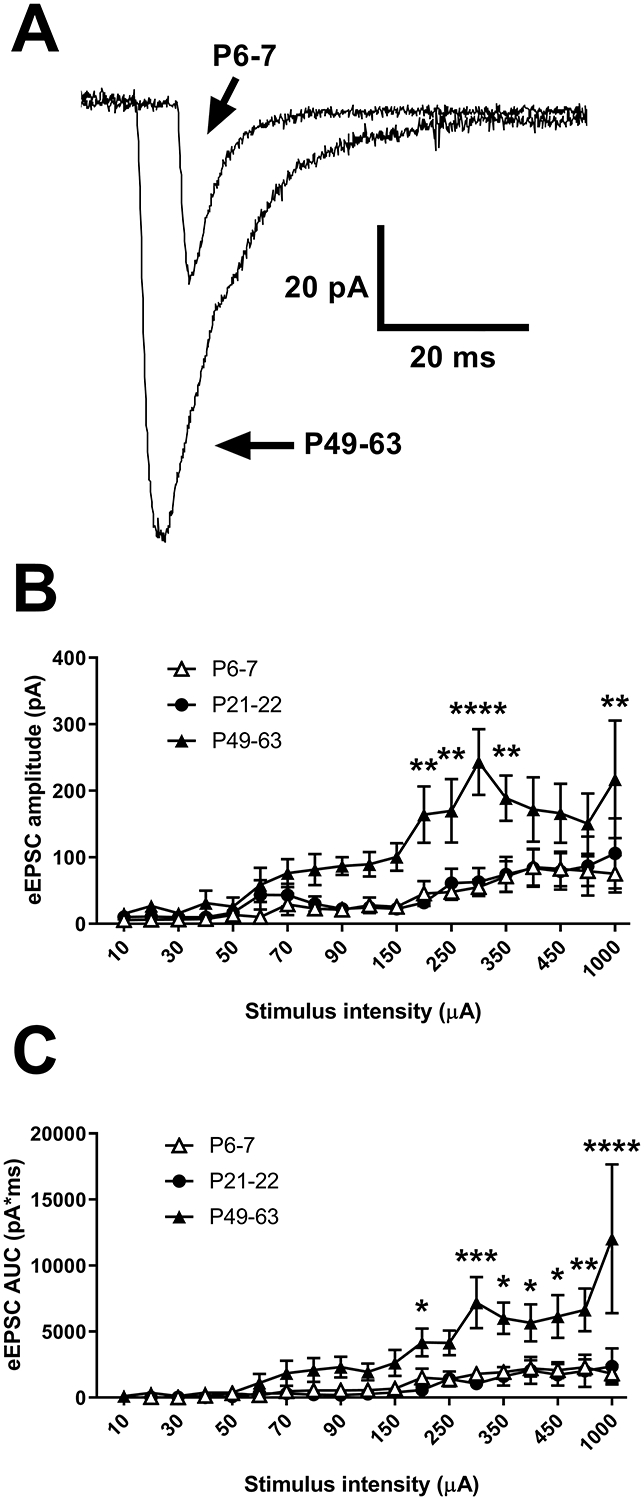
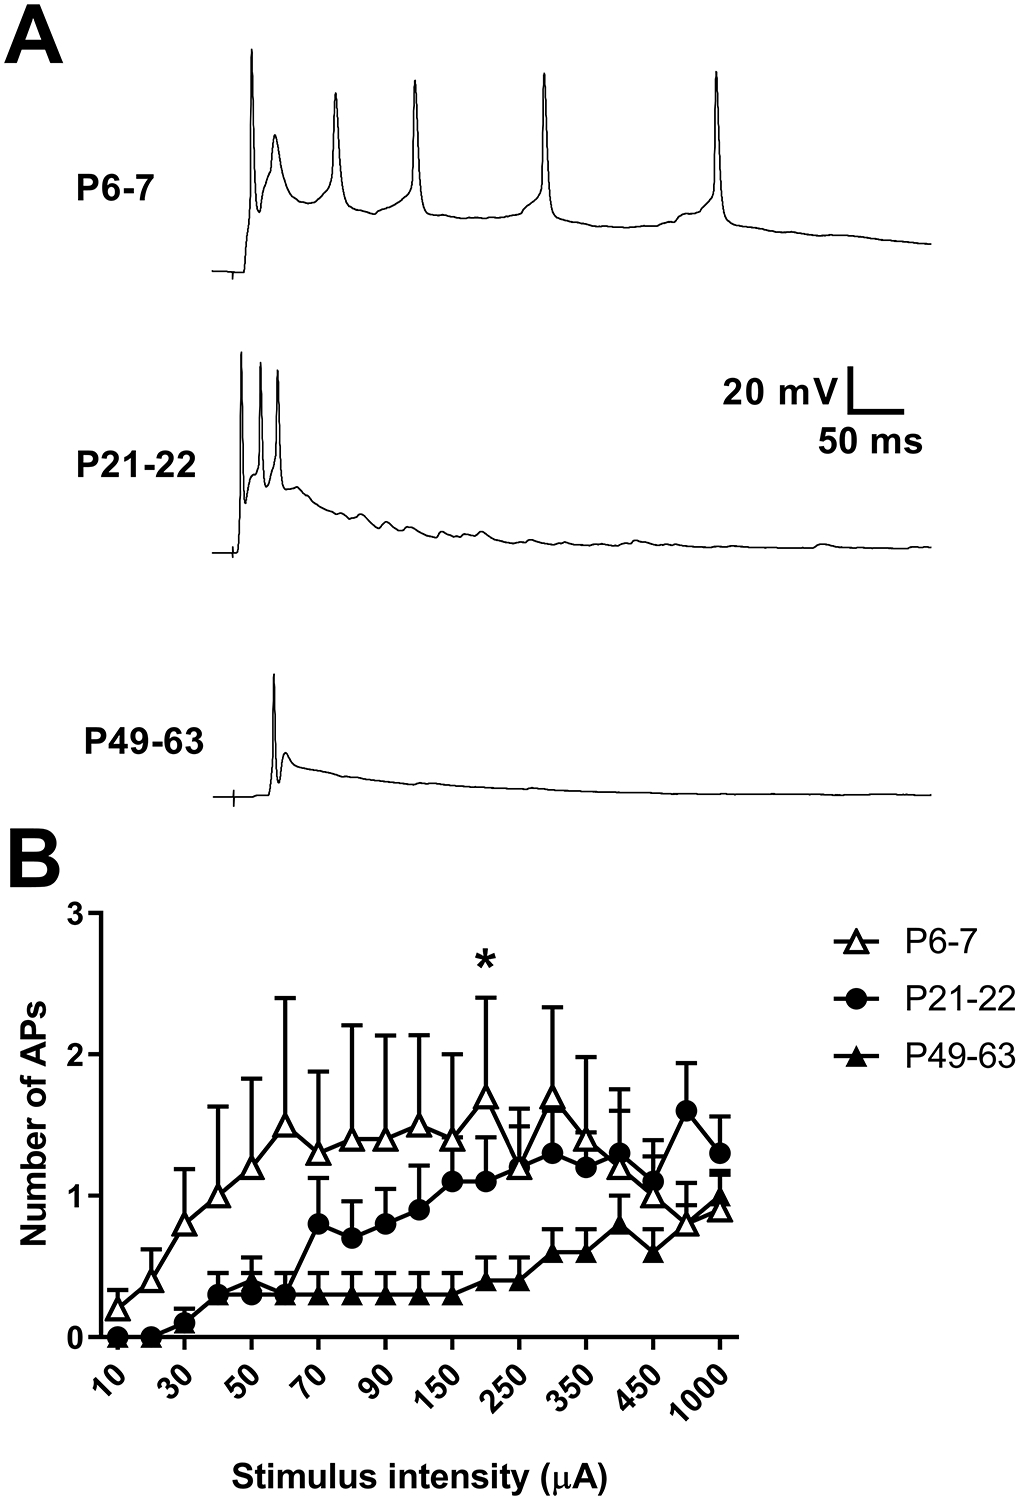
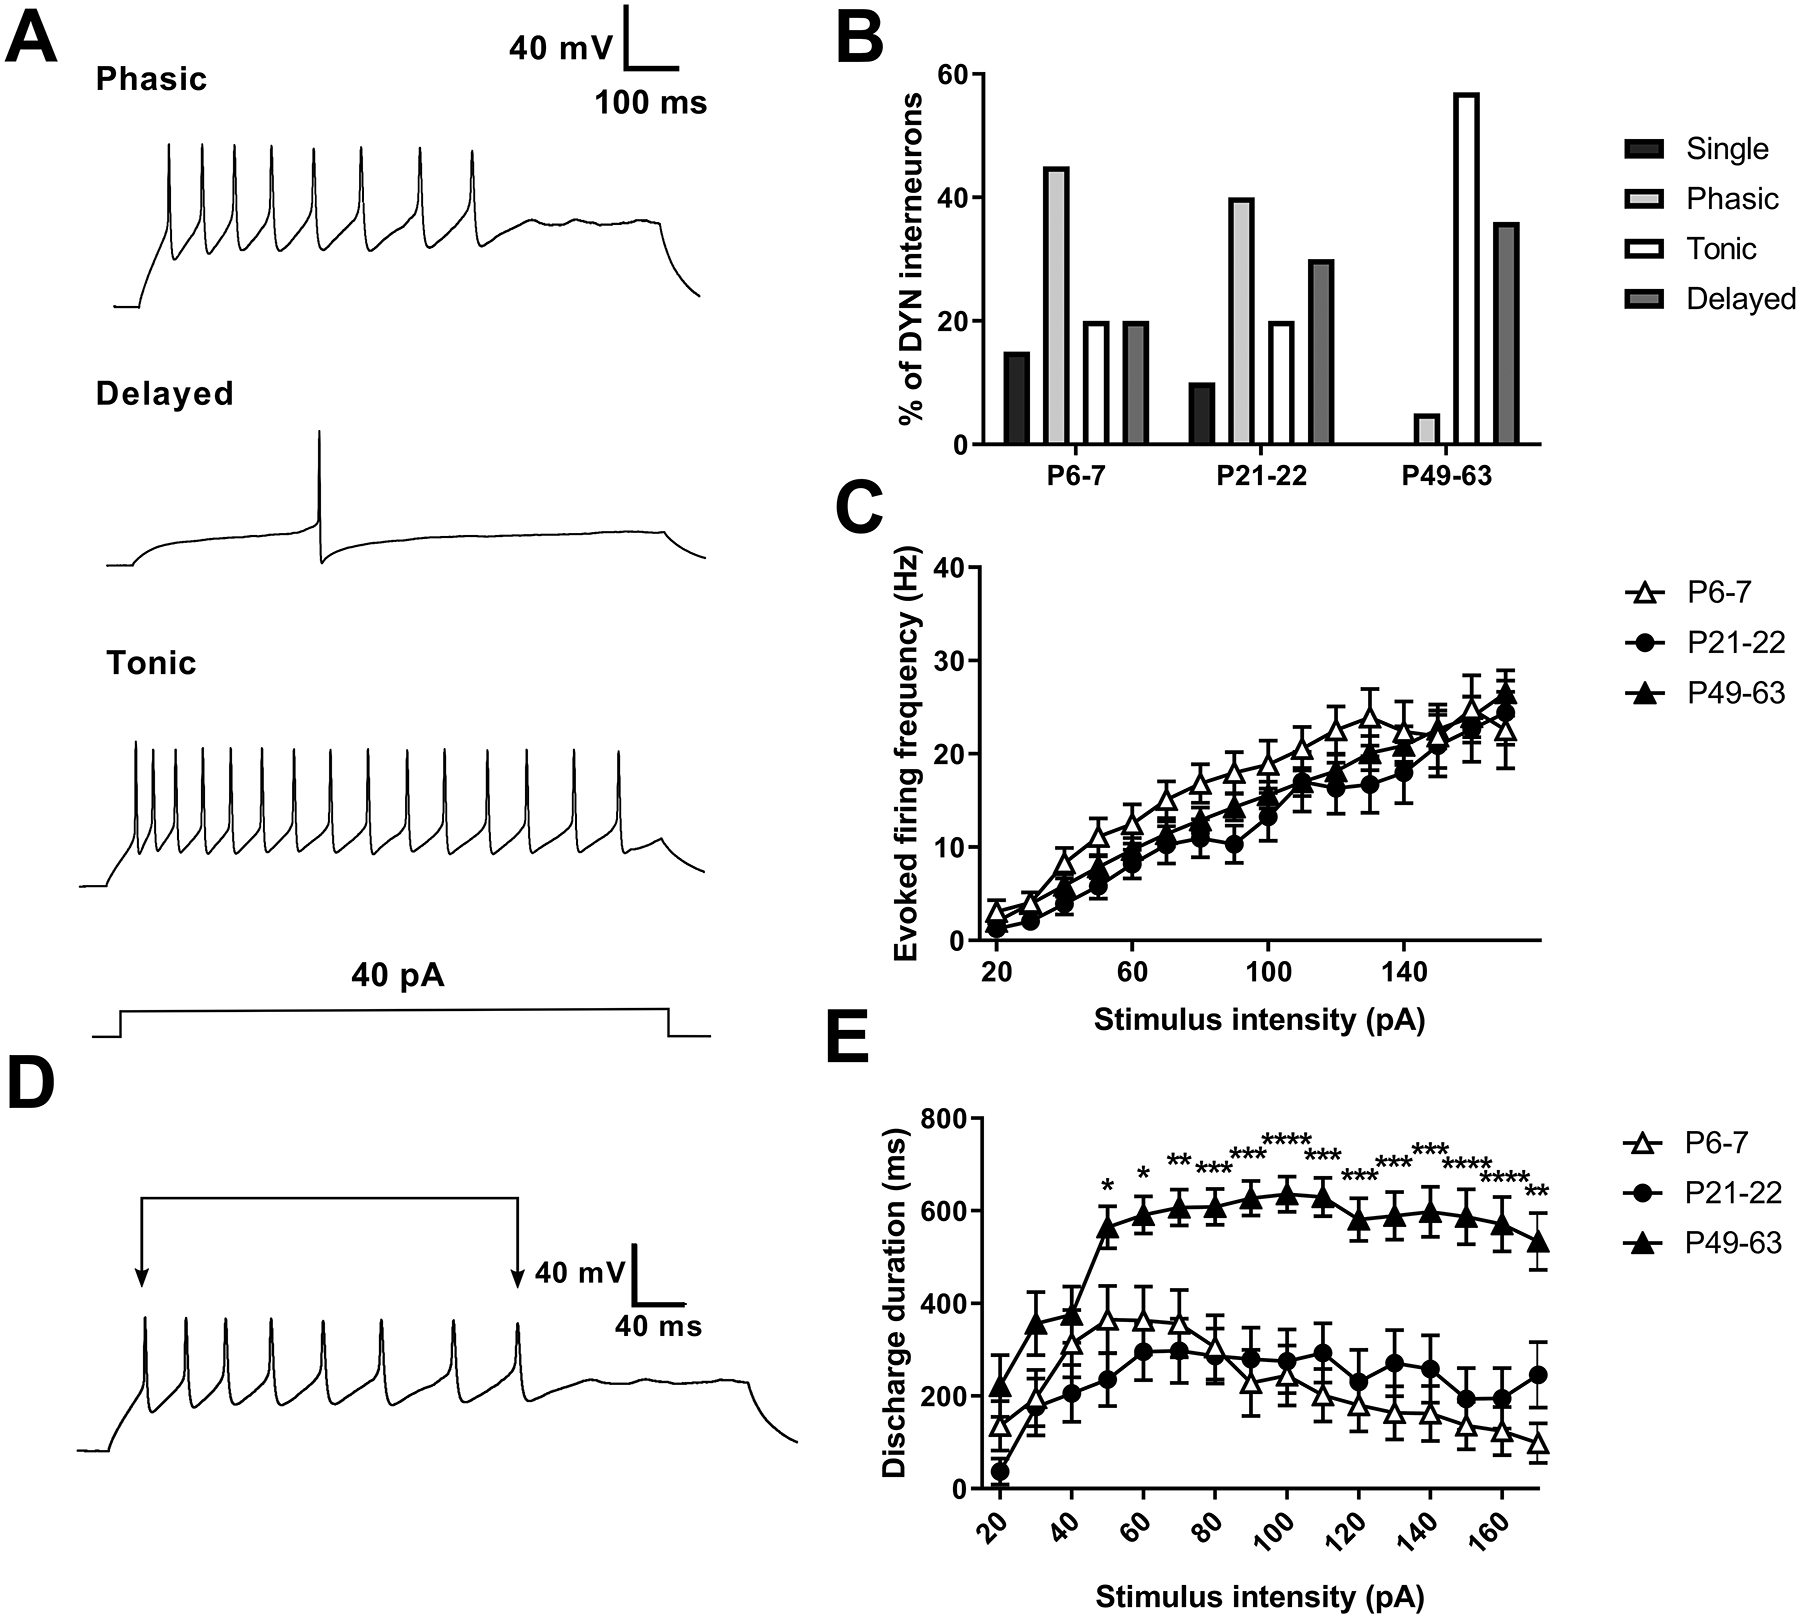
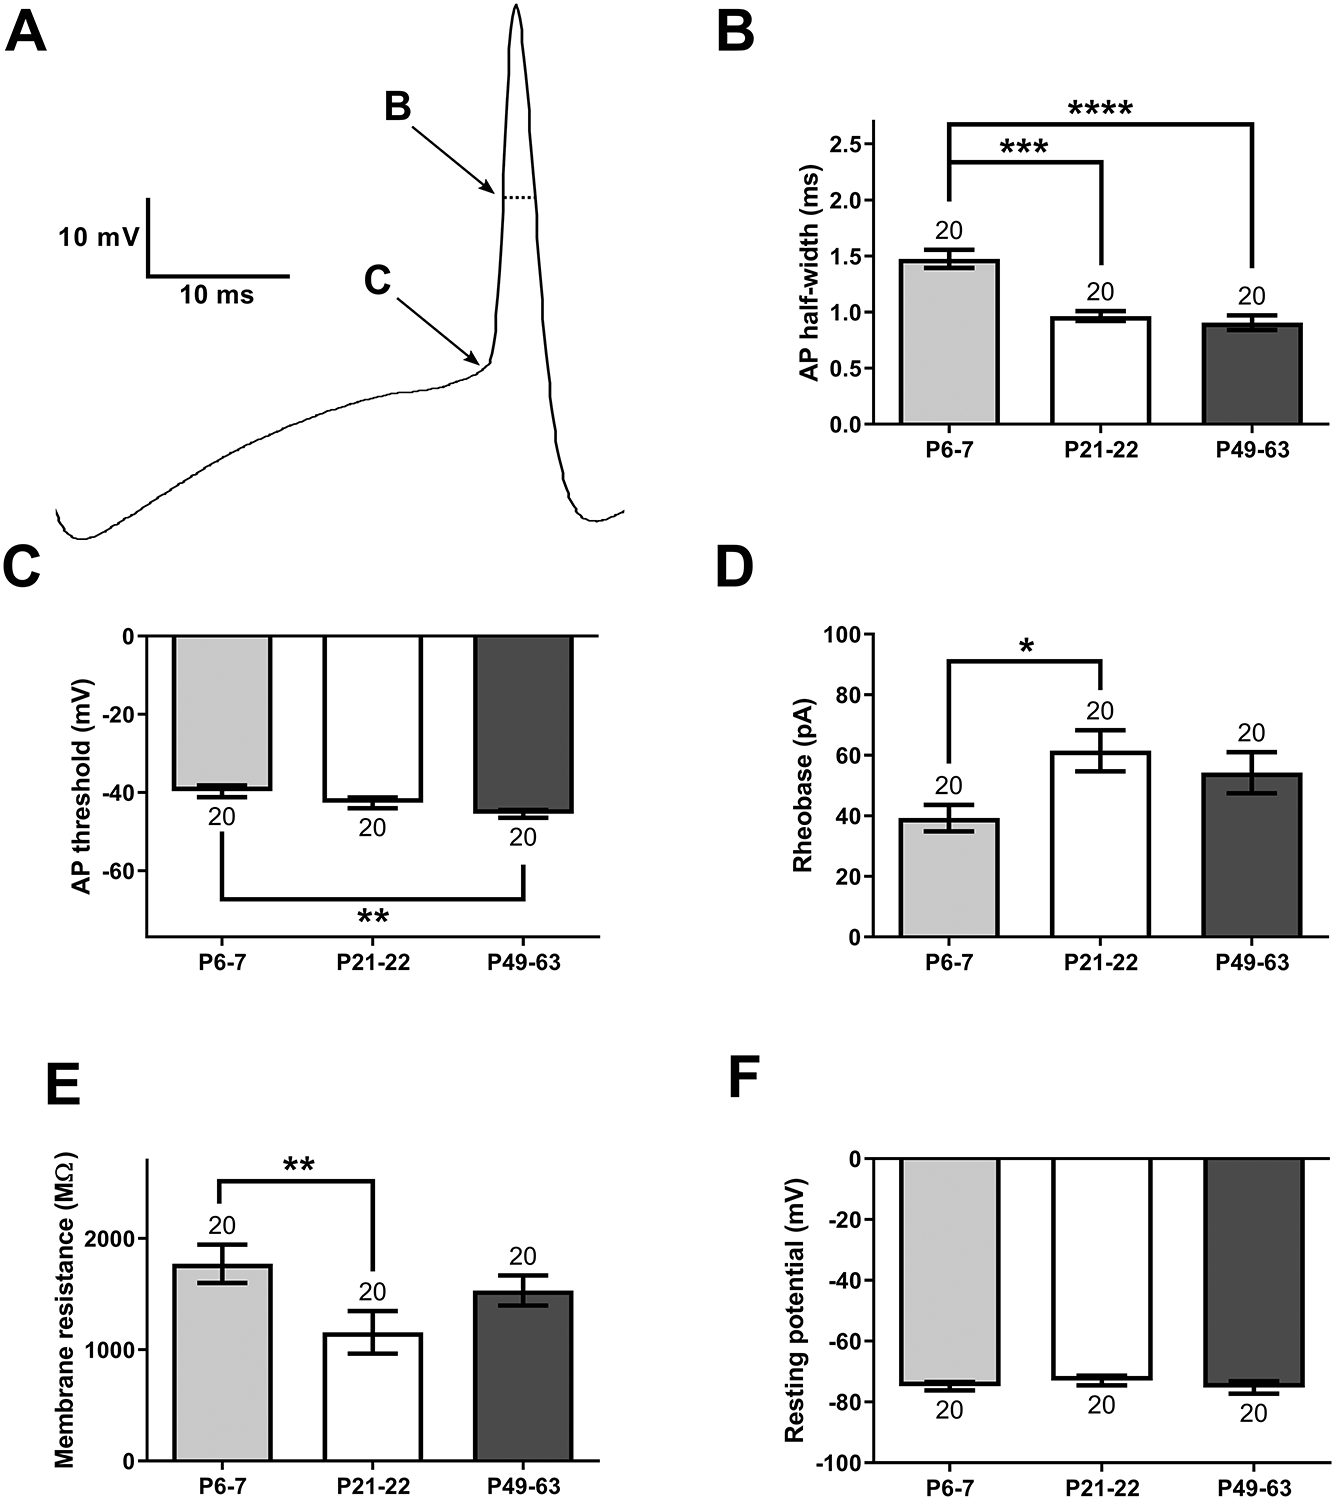
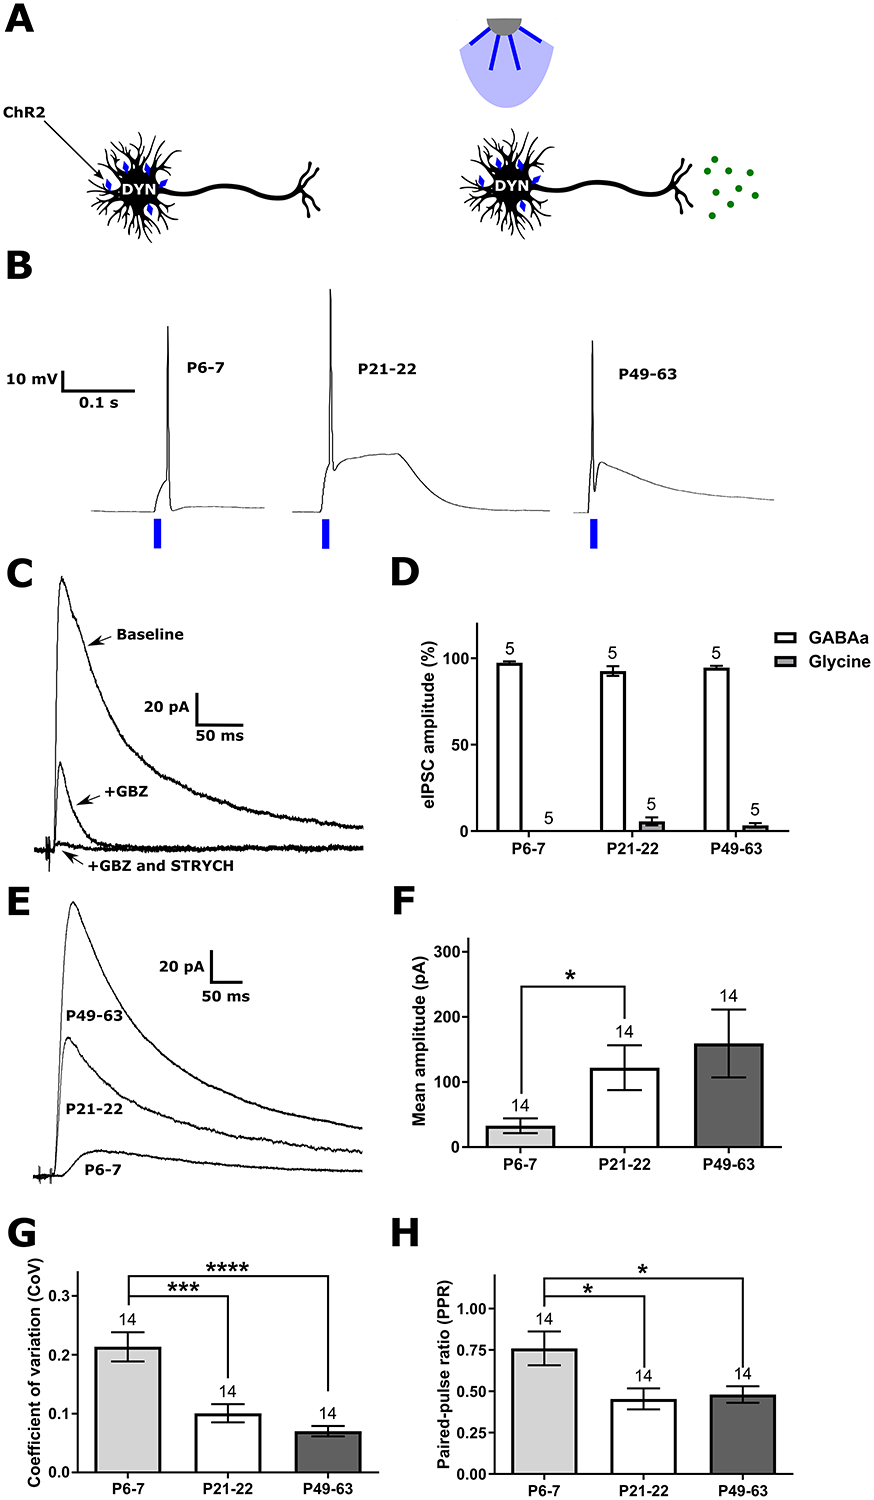
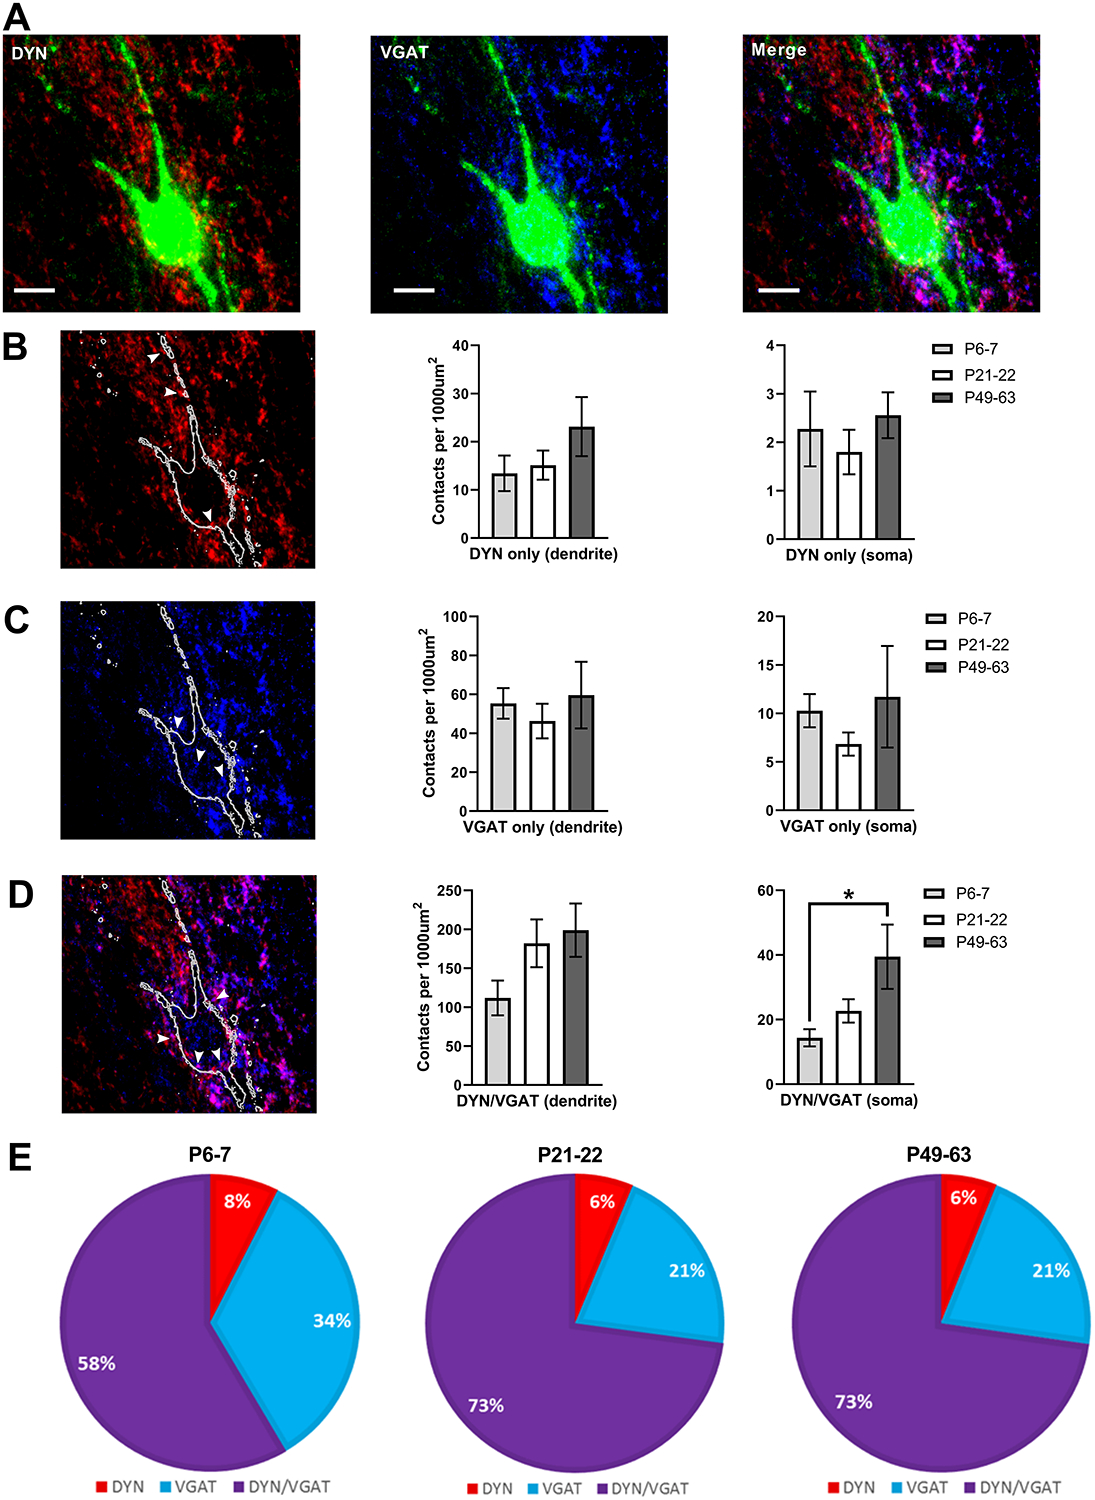
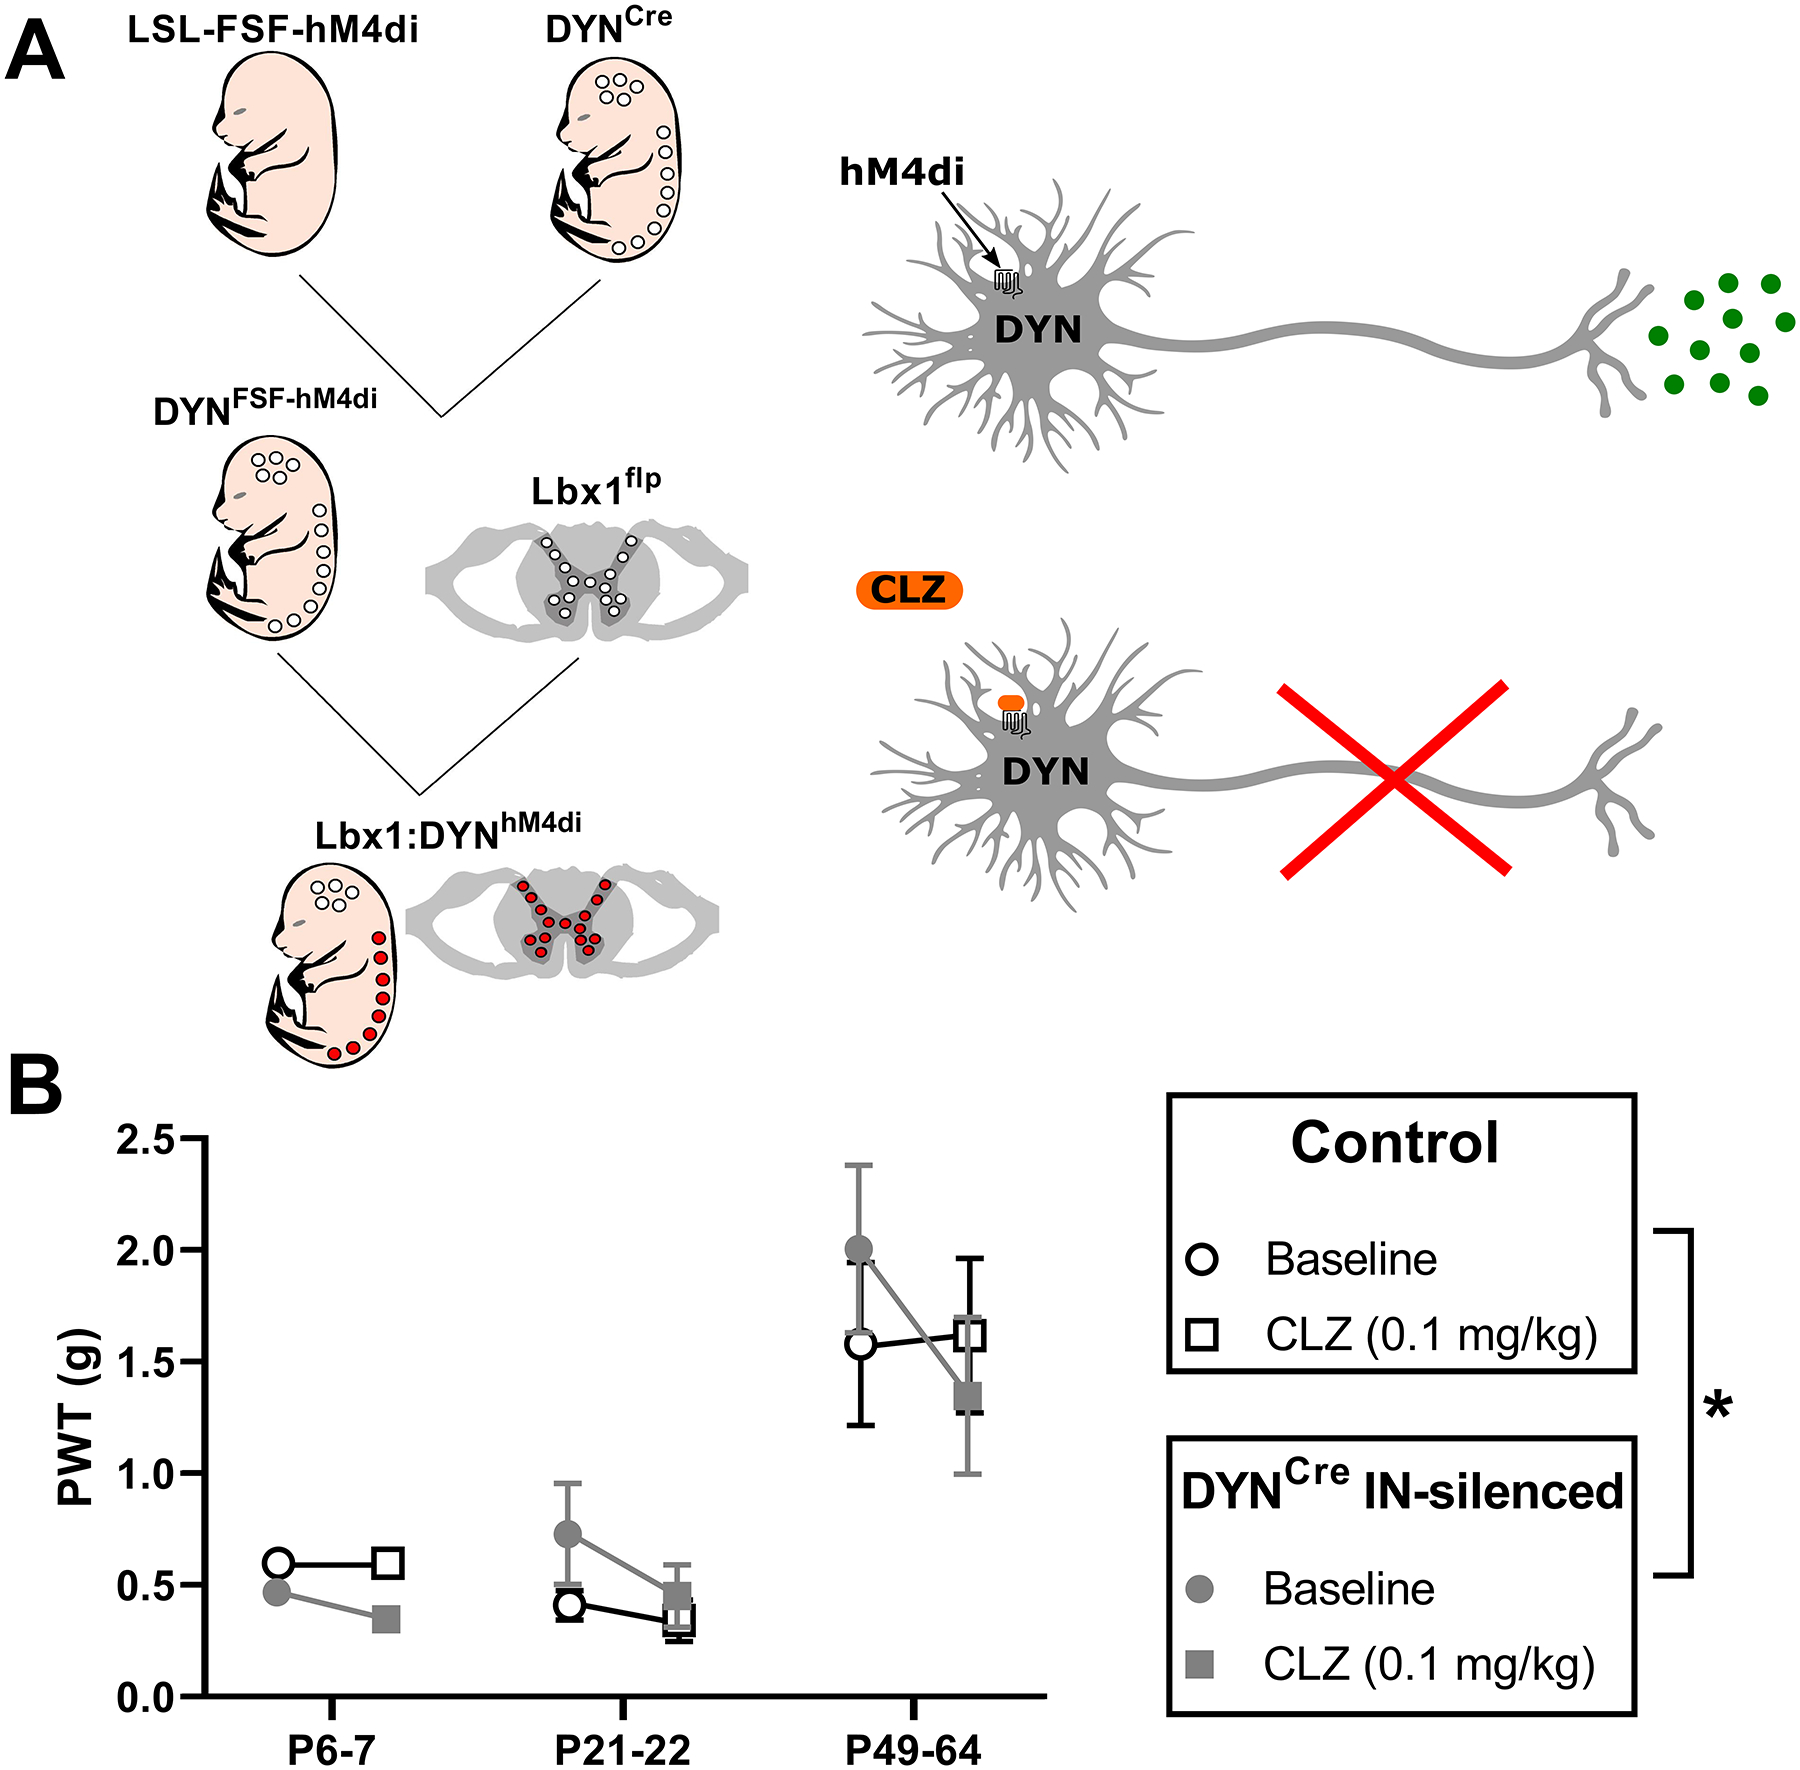
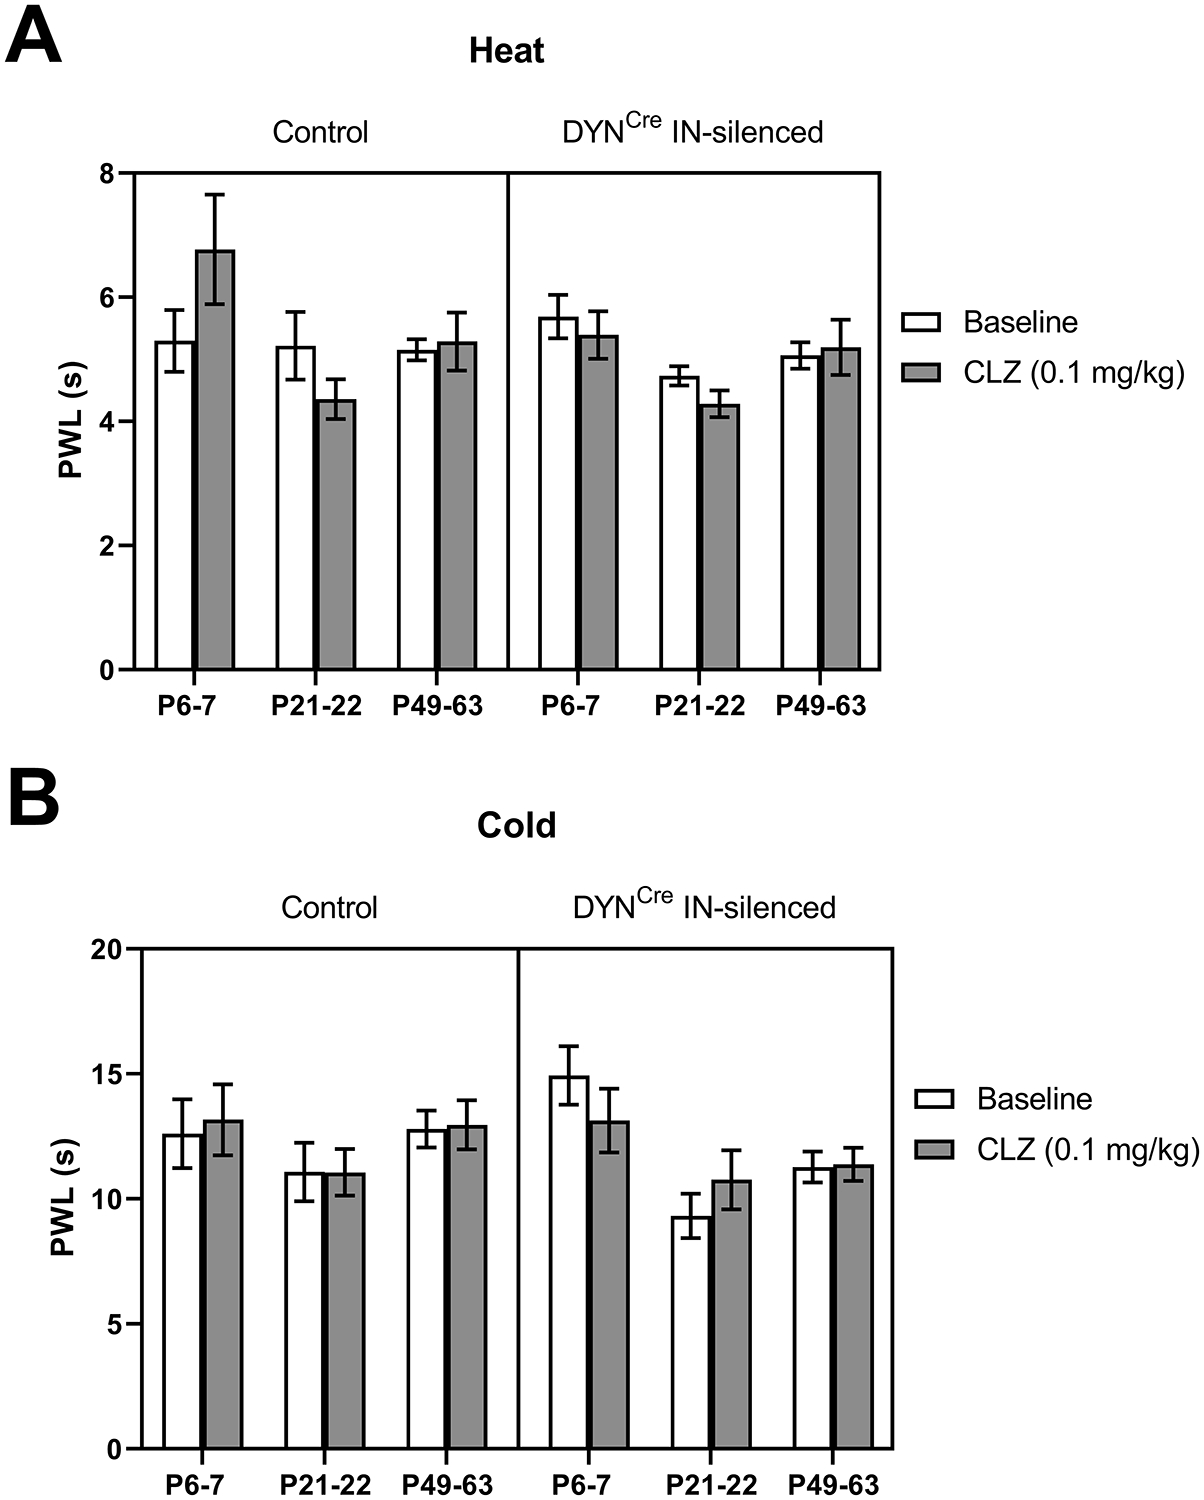
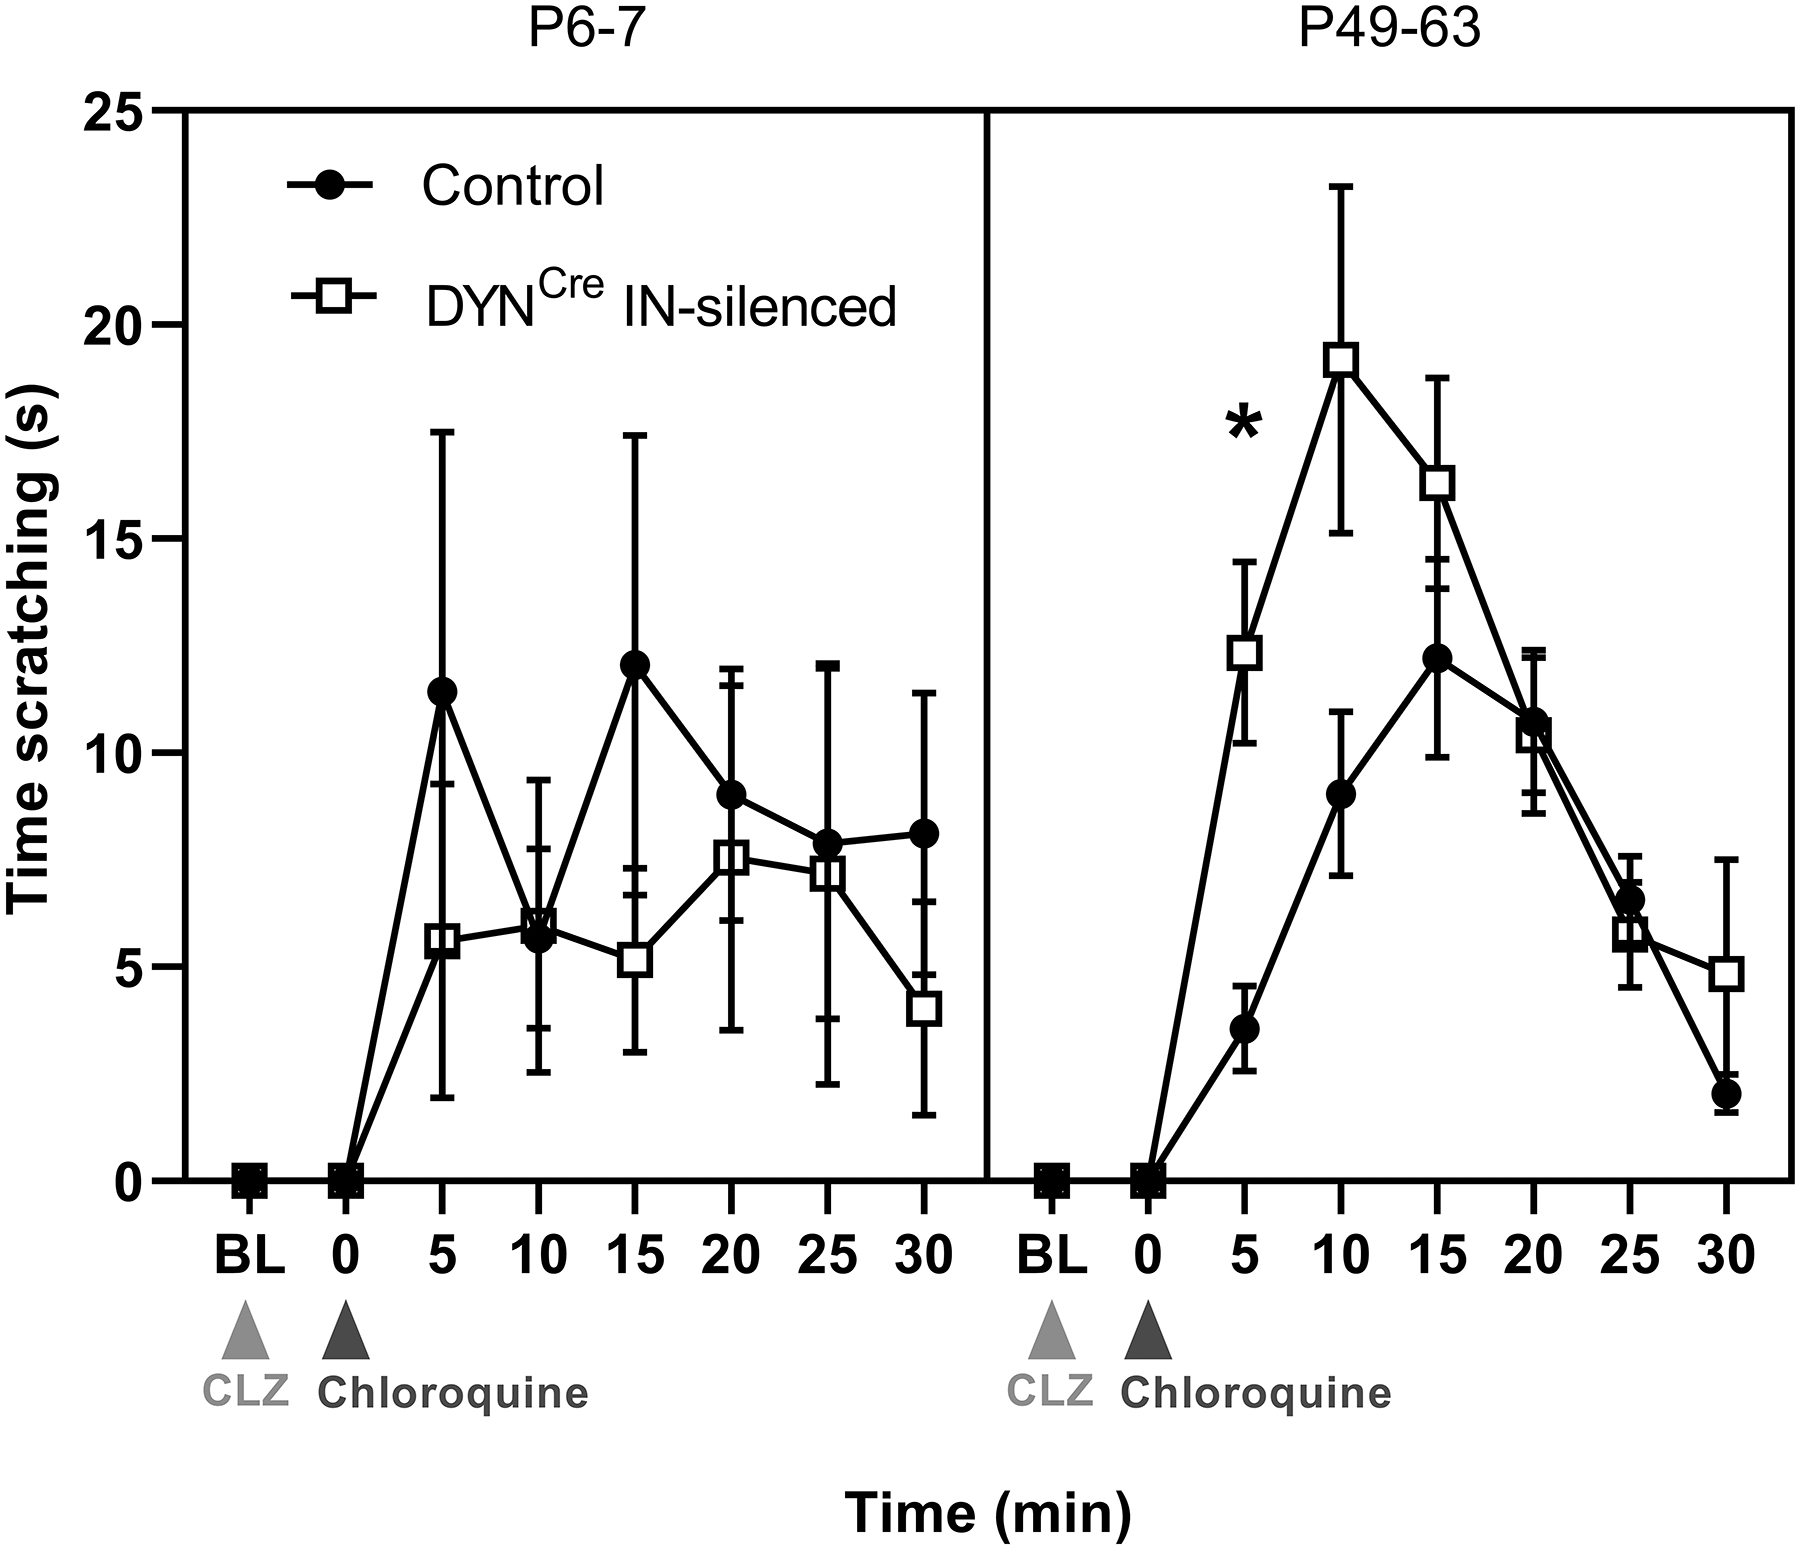
Inhibitory interneurons in the adult spinal dorsal horn (DH) can be neurochemically classified into subpopulations that regulate distinct somatosensory modalities. Although inhibitory networks in the rodent DH undergo dramatic remodeling over the first weeks of life, little is known about the maturation of identified classes of GABAergic interneurons, or whether their role in somatosensation shifts during development. We investigated age-dependent changes in the connectivity and function of prodynorphin (DYN)-lineage neurons in the mouse DH that suppress mechanosensation and itch during adulthood. In vitro patch clamp recordings revealed a developmental increase in primary afferent drive to DYN interneurons and a transition from exclusive C-fiber monosynaptic input to mixed A-fiber and C-fiber innervation. Although most adult DYN interneurons exhibited tonic firing as expected from their inhibitory phenotype, neonatal and adolescent DYN cells were predominantly classified as phasic or single-spiking. Importantly, we also found that most of the inhibitory presynaptic terminals contacting lamina I spinoparabrachial projection neurons (PNs) originate from DYN neurons. Furthermore, inhibitory synaptic input from DYN interneurons onto PNs was weaker during the neonatal period, likely reflecting a lower number of GABAergic terminals and a reduced probability of GABA release compared to adults. Finally, spinal DYN interneurons attenuated mechanical sensitivity throughout development, but this population dampened acute nonhistaminergic itch only during adulthood. Collectively, these findings suggest that the spinal "gates" controlling sensory transmission to the brain may emerge in a modality-selective manner during early life due to the postnatal tuning of inhibitory synaptic circuits within the DH.


Figures

Figure 1:
Figure 1:. DYN-lineage interneurons in the spinal dorsal horn (DH) are primarily inhibitory throughout development.
A) Images depicting tdTomato-labeled neurons in DYNtdTOM mice (left), immunostaining for the transcription factor Pax2 as a marker of inhibitory interneurons (middle), and the merged image used for quantification (right; scale bars = 50 μm). B) Image depicting DYN-tdTomato neurons and Pax2-immunoreactive neurons distributed throughout the DH (scale bar = 100 μm). C) Quantification of inhibitory DYN interneurons throughout development reveals a decline in Pax2-expressing DYN interneurons in adulthood (F(2, 50) = 142.5, p < 0.0001, one-way ANOVA; p < 0.0001; Sidak’s multiple comparisons test), although the majority of DYN interneurons are inhibitory regardless of age. D) Image demonstrating the lack of overlap between DYN-tdTomato neurons (red) and PNs retrogradely labeled from the parabrachial nucleus (green), as ~98.5% of adult PNs had never expressed DYN (scale bar = 50 μm).
Figure 2:
Figure 2:. Developmental changes in A-fiber conduction within the mouse sciatic nerve
A) Mean conduction velocity (CV) of primary afferent types at each age sampled, showing a significantly lower CV in Aβ (H = 13, p < 0.0001; Kruskal-Wallis test) and Aδ fibers (H = 6.15, p = 0.039; Kruskal-Wallis test) during early life compared with adulthood (*p < 0.05, ***p < 0.001; Dunn’s multiple comparisons test; n indicated above bars = number of nerves for all panels). B) Plot of mean stimulus intensity required to elicit a CAP from each fiber type throughout development. The stimulus thresholds of Aβ fibers at P6–7 were higher than in P49–63 mice (H = 10.98, p = 0.0009, Kruskal-Wallis test; **p < 0.01; Dunn’s multiple comparisons test), suggesting lower Aβ fiber excitability in early life.
Figure 3:
Figure 3:. A-fiber input to DYN interneurons increases throughout postnatal development.
A) Schematic illustrating the use of patch clamp recordings in the intact spinal cord preparation while stimulating the sciatic nerve with attached dorsal roots (L3 and L4). B) Plot of the distribution of monosynaptic primary afferent input to lamina I DYN interneurons throughout development. Data are presented as the percentage of sampled DYN neurons at a given age that received each type of monosynaptic input (note that some neurons received more than one type of direct input). At P6–7, cells receive low- or high-threshold C fiber input, while direct A fiber input was only recorded in cells from P21–22 and P49–63 mice (n = 13–15 neurons per age group).
Figure 4:
Figure 4:. Age-dependent strengthening of primary afferent-evoked glutamatergic drive to spinal DYN interneurons.
A) Representative recordings of EPSCs evoked via sciatic nerve stimulation in DYN interneurons showing a greater amplitude of EPSCs in adults compared to P6–7. B) There was a significant interaction between age and stimulus intensity (F(36, 378) = 1.68, p = 0.01; RM two-way ANOVA) when measuring the amplitude of afferent-evoked EPSCs (eEPSCs) in DYN interneurons (n = 8 neurons at each age; **p < 0.01, ****p < 0.0001 compared to P6–7 and P21–22; Sidak’s multiple comparisons test). C) There was also a significant interaction between age and stimulus intensity (F(36, 378) = 2.46, p < 0.0001; RM two-way ANOVA) in the area under the curve (AUC) of eEPSCs in DYN interneurons (n = 8 neurons in each group; *p < 0.05, **p < 0.01, ***p < 0.001, ****p < 0.0001 compared to P6–7 and P21–22; Sidak’s multiple comparisons test).
Figure 5:
Figure 5:. Immature DYN interneurons exhibit persistent afterdischarge in response to sensory input.
A) Examples of current clamp traces from cells at each indicated age range illustrating a progressive decrease in AP firing evoked by dorsal root stimulation throughout development. B) There was a significant interaction between age and stimulus intensity (F(36,486) = 1.81, p = 0.0032; RM two-way ANOVA) in the number of spikes evoked by primary afferent stimulation (n = 10 in each group; *p = 0.038 compared to P49–63; Sidak’s multiple comparisons test).
Figure 6:
Figure 6:. Intrinsic repetitive firing increases in spinal DYN interneurons after adolescence.
A) Representative firing patterns seen in DYN interneurons, which were classified as phasic (top), delayed (middle), tonic (bottom), and single-spiking (not pictured). B) Plot illustrating the overall distribution of firing patterns as a function of age. The single-spike and phasic firing patterns appear to decrease with age, while tonic and delayed firing patterns increase. C) Analysis of instantaneous firing frequency in developing DYN interneurons revealed a significant effect of stimulus intensity (n = 17–20 per group; F(15, 810) = 89.09, p < 0.0001; RM two-way ANOVA) but no significant effect of age (F(2, 54) = 1.13, p = 0.33) or an interaction between these two factors (F(30, 810) = 1.2, p = 0.21). D) The duration of AP discharge was measured as the time elapsed between the first and last AP during the intracellular current injection. E) Discharge duration was greater at P49–63 compared to younger ages (n = 17–20; F(30,801) = 3.08; p < 0.0001 for interaction between age and stimulus intensity; RM two-way ANOVA; *p < 0.05, **p < 0.01, ***p < 0.001, ****p < 0.0001 compared to P6–7 or P21–22; Sidak’s posthoc test).
Figure 7:
Figure 7:. Developmental changes in the intrinsic membrane properties of DYN interneurons within the DH.
A) Schematic illustrating the measurement of AP half-width (B) and spike threshold (C). B) AP half-width was significantly greater at P6–7 compared with P21–22 (H = 26.62, p < 0.0001; Kruskal-Wallis test; ***p < 0.001; Dunn’s multiple comparisons test) or P49–63 (****p < 0.0001; n indicated above bars = number of neurons for all panels). C) AP threshold in DYN neurons from P6–7 mice was significantly more depolarized compared with adults (F(2, 57) = 4.8, p = 0.012; one-way ANOVA; **p < 0.01; Sidak’s multiple comparisons test). D) DYN interneurons displayed a lower rheobase at P6–7 than at P21–22 (F(2, 57) = 3.46, p = 0.038; one-way ANOVA; *p < 0.05; Sidak’s multiple comparisons test). E) DYN interneurons in early life have a higher membrane resistance than during adolescence (H = 10.28, p = 0.0058; Kruskal-Wallis test; **p < 0.01; Dunn’s multiple comparisons test). F) We found no significant differences in resting membrane potential across the ages tested (F(2, 57) = 0.52, p = 0.6; one-way ANOVA).
Figure 8:
Figure 8:. DYN inhibitory synapses onto lamina I spinoparabrachial neurons strengthen with age.
A) Schematic illustrating channelrhodopsin-2 (ChR2) expression in DYN neurons and the activation of this population by blue light. B) Representative traces demonstrating that the chosen light pulse duration (10 ms) elicits a single AP from DYN interneurons at all ages tested. C) Example of monosynaptic IPSCs evoked in a lamina I projection neuron (PN) following optogenetic stimulation of DYN neurons, before and after the sequential bath application of the GABAA receptor antagonist gabazine (GBZ) and the glycine receptor antagonist strychnine (STRYCH). D) Graph of the relative contribution of GABAA and glycine receptors to DYN-evoked inhibition of PNs, showing that virtually all of the input is GABAergic throughout development although a small glycinergic component emerged in adolescence (n indicated above bars = number of neurons in all panels). E) Representative IPSCs illustrating the developmental increase in the amplitude of the DYN-evoked current in PNs. F) The mean peak amplitude of DYN-evoked IPSCs in PNs is lower at P6–7 compared with P21–22 animals (H = 7.99, p = 0.018; Kruskal-Wallis test; *p < 0.05; Dunn’s multiple comparisons test). G) The coefficient of variation (CoV) significantly decreases after the first postnatal week (H = 21.94, p < 0.0001; Kruskal-Wallis test; ***p < 0.001, ****p < 0.0001; Dunn’s multiple comparisons test), indicating a progressive increase in either the probability of GABA release or the number of release sites at inhibitory DYN synapses onto PNs throughout development. H) The paired-pulse ratio (PPR; eIPSC2/eIPSC1) also decreases significantly after P6–7 (F(2, 39) = 5.08, p = 0.012; one-way ANOVA; *p < 0.05; Sidak’s multiple comparisons test), suggesting a reduced probability of GABA release at DYN synapses onto PNs during early life.
Figure 9:
Figure 9:. Developmental increase in the innervation of lamina I projection neurons (PNs) by inhibitory DYN neurons.
A) Images showing PNs labeled with antibody-based staining for the retrograde tracer CTB (green, all panels), DYN presynaptic terminals genetically labeled via synaptophysin-tdTOM (red, left and right panels), and inhibitory boutons labeled via antibody staining for VGAT (blue, middle and right panels; z-stack projection; scale bar = 10 μm). B) Left: z-stack projection image of presumed excitatory DYN terminals (white arrows) with synaptophysin-tdTOM expression but no VGAT immunoreactivity. Middle and right panels: Plot of the density of boutons in apposition to the dendrites and soma of PNs as a function of age, demonstrating that the density of excitatory DYN terminals onto PNs does not change throughout development (n = 8 neurons in each group). C) Left: Examples of inhibitory (i.e. VGAT+) boutons that do not originate from DYN-lineage neurons (i.e. are tdTOM-negative, white arrows). Middle and right panels: Quantification of DYN-negative inhibitory contacts onto PNs reveals no effect of age (n = 8). D) Left: Representative z-stack projection image of terminals expressing both VGAT and synaptophysin-tdTOM (white arrows), which represent inhibitory presynaptic terminals originating from DYN interneurons. While there was no statistically significant influence of age on the density of DYN/VGAT terminals apposed to PN dendrites (middle panel), there was a developmental increase in the density of inhibitory DYN contacts onto the somata of PNs (right panel; n = 8, H = 7.07, p = 0.03; Kruskal-Wallis test; *p < 0.05; Dunn’s multiple comparisons test). Please note the change in y-axis scale from panels B to D. E) The majority of inhibitory presynaptic terminals contacting PNs originate from DYN-expressing interneurons at all ages tested.
Figure 10:
Figure 10:. Spinal DYN interneurons gate mechanical sensation throughout life.
A) Left: Illustration of intersectional genetic strategy to obtain DREADD receptor expression predominantly within inhibitory DYN interneurons in the spinal cord. The inhibitory DREADD (hM4Di) allele is preceded by lox-stop-lox and frt-stop-frt sites, preventing its expression in the absence of both Cre and flp recombinases. Cre expression is restricted to neurons derived from the DYN lineage, while flp is expressed in neurons of the spinal cord and hindbrain via the Lbx1 promoter. Notably, excitatory DYN neurons in the spinal cord are reportedly excluded by this genetic strategy [28]. Right: Neuronal expression of the inhibitory DREADD receptor (hM4Di) allows for controlled silencing via exposure to low doses of clozapine (CLZ). B) Plot of mechanical withdrawal thresholds measured in the hindpaw (PWT) before (circle) and 20–25 min after CLZ administration (square) in flp-negative control (white) and hM4Di-expressing (gray) mice. We found a significant interaction between genotype × drug (F(1, 40) = 5.57, p = 0.023; RM three-way ANOVA), with CLZ administration lowering PWTs in adult DREADD-expressing animals (p = 0.001; FDR), but no statistically significant interaction between age × genotype × drug (F(2, 40) = 1.54, p = 0.23; RM three-way ANOVA).
Figure 11:
Figure 11:. Developing DYN interneurons do not modulate thermal sensitivity.
A) Plot of paw withdrawal latencies (PWL) in response to noxious heat before and 20–25 min after CLZ administration. There was no significant interaction between genotype and drug (F(1, 57) = 1.48, p = 0.22; RM three-way ANOVA), suggesting that spinal DYN interneurons do not influence heat sensation. B) Similarly, measurements of the withdrawal thresholds in response to noxious cold revealed no significant interaction between genotype and drug (F(1,61) = 0.21, p = 0.65; RM three-way ANOVA), thereby arguing against a role of inhibitory DYN interneurons in regulating cold sensitivity.
Figure 12:
Figure 12:. Silencing DYN interneurons in the DH increases acute non-histaminergic itch in adults but not neonates.
Graph depicting time spent scratching the nape of the neck with the hindpaw after CLZ injection (light gray arrow), both before (Baseline; BL) and after intradermal chloroquine injection (dark gray arrow). Quantification of time spent scratching after chloroquine injection into the nape revealed a significant interaction between genotype and age (F(1, 37) = 5.57, p = 0.035; RM three-way ANOVA, transformed data not shown), suggesting that DYN interneurons reduce itch in adulthood but not during early life (*p = 0.041; FDR; n = 8–14 mice per group).

References

    1. Abraira VE, Ginty DD. The sensory neurons of touch. Neuron 2013;79(4):618–639. - PMC - PubMed
    1. Albisetti GW, Pagani M, Platonova E, Hösli L, Johannssen HC, Fritschy J-M, Wildner H, Zeilhofer HU. Dorsal horn gastrin-releasing peptide expressing neurons transmit spinal itch but not pain signals. Journal of Neuroscience 2019;39(12):2238–2250. - PMC - PubMed
    1. Andrews K, Fitzgerald M. The cutaneous withdrawal reflex in human neonates: sensitization, receptive fields, and the effects of contralateral stimulation. Pain 1994;56(1):95–101. - PubMed
    1. Andrews K, Fitzgerald M. Cutaneous flexion reflex in human neonates: a quantitative study of threshold and stimulus-response characteristics after single and repeated stimuli. Developmental medicine and child neurology 1999;41(10):696–703. - PubMed
    1. Baccei ML, Bardoni R, Fitzgerald M. Development of nociceptive synaptic inputs to the neonatal rat dorsal horn: glutamate release by capsaicin and menthol. The Journal of physiology 2003;549(1):231–242. - PMC - PubMed

Publication types