

Identification of Biomarkers for Sarcoidosis and Tuberculosis of the Lung Using Systematic and Integrated Analysis
- PMID: 32701935
- PMCID: PMC7397754
- DOI: 10.12659/MSM.925438
Identification of Biomarkers for Sarcoidosis and Tuberculosis of the Lung Using Systematic and Integrated Analysis
Abstract
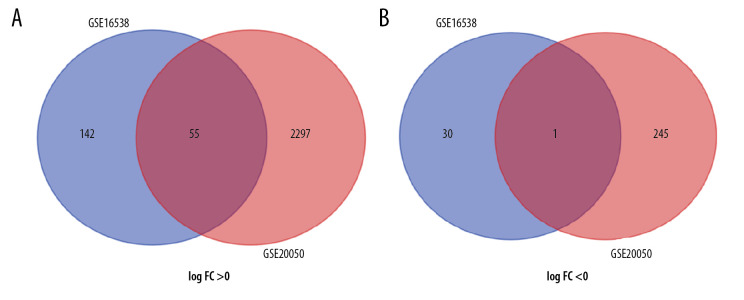
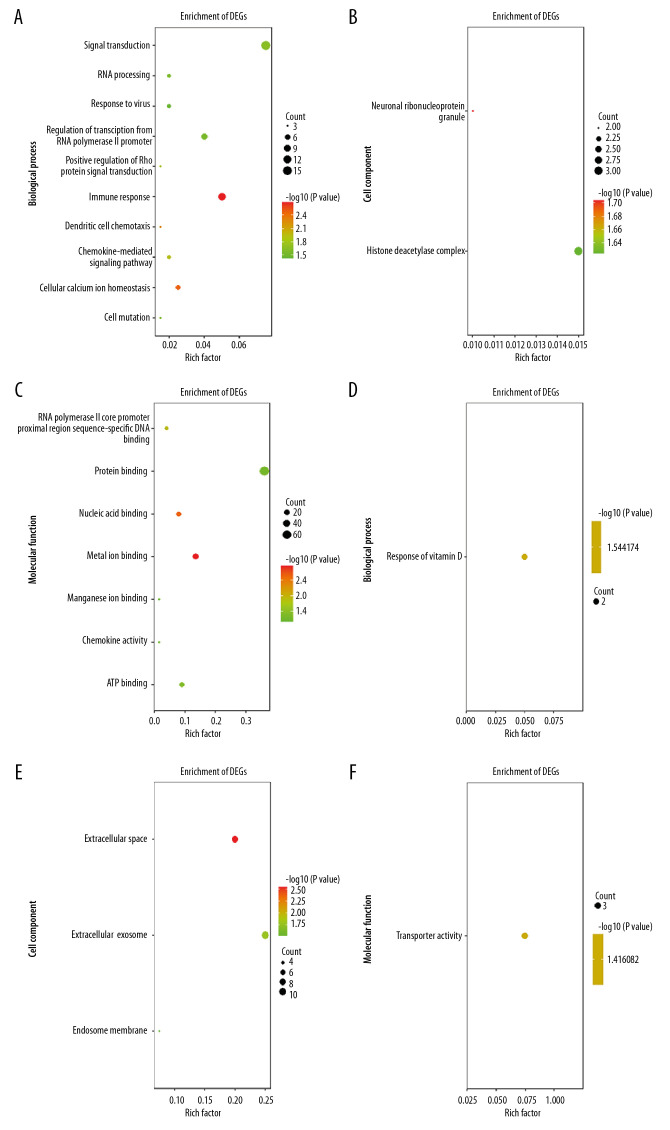
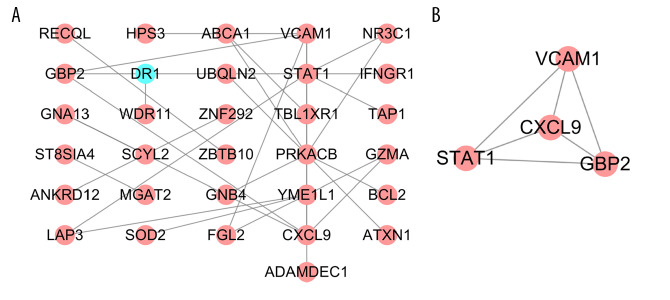
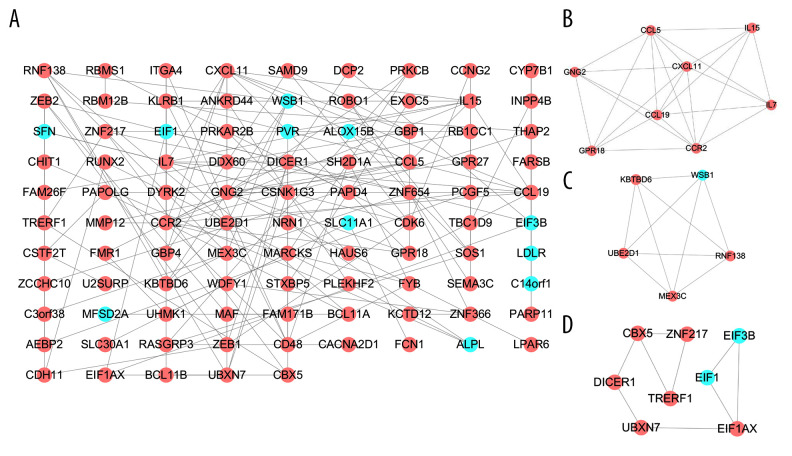
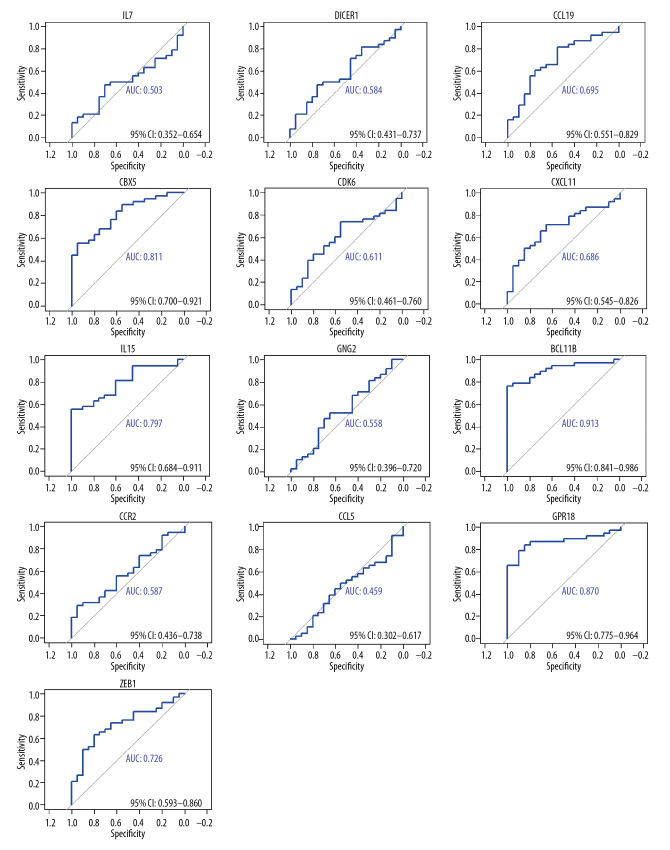
BACKGROUND Sarcoidosis (SARC) is a multisystem inflammatory disease of unknown etiology and pulmonary tuberculosis (PTB) is caused by Mycobacterium tuberculosis. Both of these diseases affect lungs and lymph nodes and share similar clinical manifestations. However, the underlying mechanisms for the similarities and differences in genetic characteristics of SARC and PTB remain unclear. MATERIAL AND METHODS Three datasets (GSE16538, GSE20050, and GSE19314) were retrieved from the Gene Expression Omnibus (GEO) database. Differentially expressed genes (DEGs) in SARC and PTB were identified using GEO2R online analyzer and Venn diagram software. Functional enrichment analysis was performed using Database for Annotation, Visualization and Integrated Discovery (DAVID) and R packages. Two protein-protein interaction (PPI) networks were constructed using Search Tool for the Retrieval of Interacting Genes database, and module analysis was performed using Cytoscape. Hub genes were identified using area under the receiver operating characteristic curve analysis. RESULTS We identified 228 DEGs, including 56 common SARC-PTB DEGs (enriched in interferon-gamma-mediated signaling, response to gamma radiation, and immune response) and 172 SARC-only DEGs (enriched in immune response, cellular calcium ion homeostasis, and dendritic cell chemotaxis). Potential biomarkers for SARC included CBX5, BCL11B, and GPR18. CONCLUSIONS We identified potential biomarkers that can be used as candidates for diagnosis and/or treatment of patients with SARC.
Conflict of interest statement
None.
Figures
References
-
- Landi C, Bargagli E, Carleo A, et al. A functional proteomics approach to the comprehension of sarcoidosis. J Proteomics. 2015;128:375–87. - PubMed
-
- Perez RL, Rivera-Marrero CA, Roman J. Pulmonary granulomatous inflammation: From sarcoidosis to tuberculosis. Semin Respir Infect. 2003;18(1):23–32. - PubMed
-
- Gupta D, Agarwal R, Aggarwal AN, Jindal SK. Molecular evidence for the role of mycobacteria in sarcoidosis: A meta-analysis. Eur Respir J. 2007;30(3):508–16. - PubMed
-
- Sharma OP. Murray Kornfeld, American College of Chest Physician, and sarcoidosis: A historical footnote: 2004 Murray Kornfeld Memorial Founders Lecture. Chest. 2005;128(3):1830–35. - PubMed
-
- Li QH, Zhang Y, Zhao MM, et al. Simultaneous amplification and testing method for Mycobacterium tuberculosis rRNA to differentiate sputum-negative tuberculosis from sarcoidosis. Am J Physiol Lung Cell Mol Physiol. 2019;316(3):L519–24. - PubMed
MeSH terms
Substances
LinkOut - more resources
Full Text Sources
Medical
