. 2020 Jul 23;16(7):e1008087.
doi: 10.1371/journal.pcbi.1008087. eCollection 2020 Jul.

The location of the axon initial segment affects the bandwidth of spike initiation dynamics

Affiliations

The location of the axon initial segment affects the bandwidth of spike initiation dynamics

Christophe Verbist et al. PLoS Comput Biol. .

Abstract

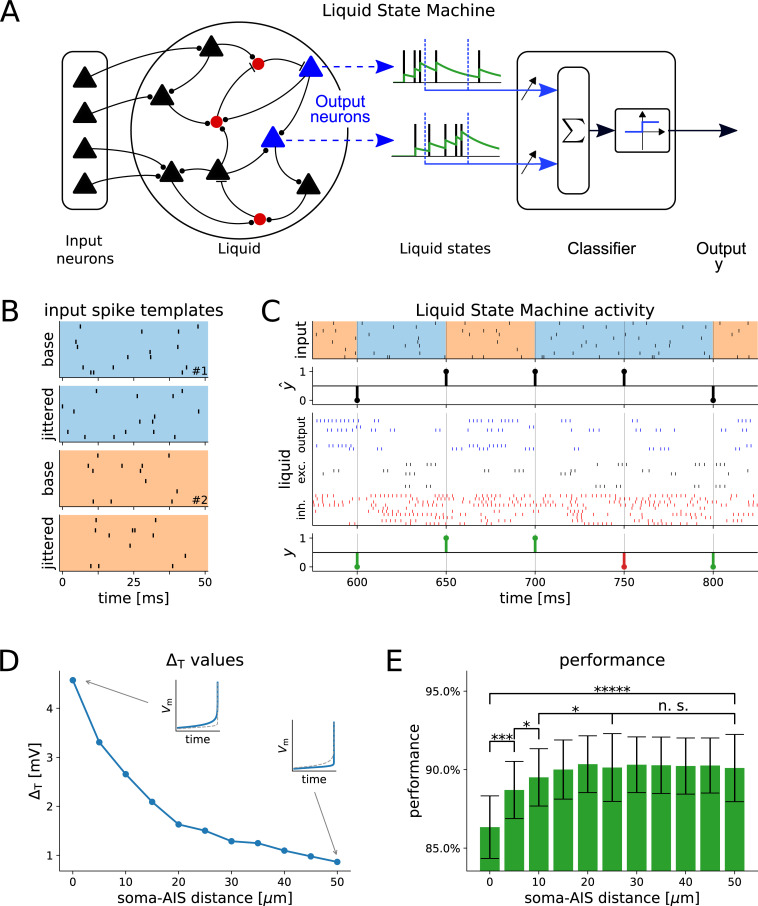
The dynamics and the sharp onset of action potential (AP) generation have recently been the subject of intense experimental and theoretical investigations. According to the resistive coupling theory, an electrotonic interplay between the site of AP initiation in the axon and the somato-dendritic load determines the AP waveform. This phenomenon not only alters the shape of APs recorded at the soma, but also determines the dynamics of excitability across a variety of time scales. Supporting this statement, here we generalize a previous numerical study and extend it to the quantification of the input-output gain of the neuronal dynamical response. We consider three classes of multicompartmental mathematical models, ranging from ball-and-stick simplified descriptions of neuronal excitability to 3D-reconstructed biophysical models of excitatory neurons of rodent and human cortical tissue. For each model, we demonstrate that increasing the distance between the axonal site of AP initiation and the soma markedly increases the bandwidth of neuronal response properties. We finally consider the Liquid State Machine paradigm, exploring the impact of altering the site of AP initiation at the level of a neuronal population, and demonstrate that an optimal distance exists to boost the computational performance of the network in a simple classification task.


Conflict of interest statement

The authors have declared that no competing interests exist.

Figures

Fig 1
Fig 1
Linear dynamical transfer properties of multicompartmental model neurons. We studied the dynamics of AP initiation in neuronal models, by estimating the temporal modulation of the instantaneous firing probability, in response to the somatic injection of a noisy current (B, green trace). The offset of this current (A-B, dashed grey trace) was weakly modulated over time at a harmonic frequency f. With Circular Statistics methods, we referred the time of each AP to the corresponding phase of the input oscillation. Then we regarded in the complex plane each AP as a vector with unitary length (C, filled colored markers) (C). We finally estimated the magnitude and phase of the vector sum r¯ (C), averaging together tens of thousands of APs and thus resulting in a vector with length lower than 1. We systematically explored magnitude and phase for a broad range of values of f (i.e. 10–1000 cycle/s). As the soma-AIS distance increased, the somatic AP waveform varied and became steeper (D).
Fig 2
Fig 2
Performance of the “ball-and-stick” neuron model. Color-coding across panels reflects the soma-AIS distances, with darker colors used for more proximal AIS locations and brighter colors for more distal AIS locations. The somatic AP waveform was examined in time (A) and in the phase-space, plotting the derivative of the potential versus the potential (B). We conventionally set the AP “onset” to 10mV/ms (dashed horizontal black line), deriving the value of AP threshold (i.e. the potential at the onset) (C) and the AP rapidity (i.e. the phase slope at onset) (D). The magnitude of the dynamical transfer gain of the model was estimated as in Fig 1 and plotted in the Fourier domain, across increasing soma-AIS distances, normalized to its value at 1 cycle/s (E). The “cut-off” frequency, defined as the harmonic frequency corresponding to a 30% attenuation of the magnitude, was then studied against the soma-AIS distance (D) and fitted by a logistic function. Error bars (C-F) represent the standard deviation over 100 independent repeated simulations.
Fig 3
Fig 3
Performance of a rat cortical pyramidal neuron model. We repeated the analysis of Fig 2 for a model of rat neocortical layer 5 pyramidal cells. As in the “ball-and-stick” model, when the AIS moved away from the soma (A), the somatic AP became steeper (A), while its threshold potential decreased (B,C) and its rapidity at onset increased (B,D). The magnitude of the dynamical transfer gain of the model was plotted in the Fourier domain, across increasing soma-AIS distances, normalized to its value at 1 cycle/s (E). The “cut-off” frequency was then studied against the soma-AIS distance (D) and fitted by a logistic function. Color coding as in Fig 2 and error bars (C-F) representing the standard deviation over 100 independent repeated simulations.
Fig 4
Fig 4
Performance of various excitatory rat cortical neuron models. We repeated the analysis of Figs 2 and 3, focusing on the “cut-off” frequency sensitivity to the soma-AIS distance (see Figs 2F and 3F) of all the 13 excitatory neuron models, as released by the Blue Brain Project. Each panel refers to a distinct cell type across cortical layers 2/3, 4, 5, and 6, and is representative of Pyramidal Cells (PC), Star Pyramidal cells (SP), Spiny Stellate neurons (SS), Thick-Tufted Pyramidal Cells (TTPC), Untufted Pyramidal Cells (UTPC), Slender Tufted Pyramidal Cells (STPC), Pyramidal Cell with Bipolar apical-like dendrites (BPC), Pyramidal Cell with Inverted apical-like dendrites (IPC), Tufted Pyramidal Cell with apical dendrites terminating in Layer 1 (TPCL1), and Tufted Pyramidal Cell with apical dendrites terminating in Layer 4 (TPCL4). The continuous traces represent logistic functions whose parameters (Table 1) have been best fitted to the simulation results. Color coding as in Fig 2.
Fig 5
Fig 5
Performance of a human cortical neuron model. We repeated the analysis of Figs 2 and 3 for a multicompartmental model of human neocortical layer 2/3 pyramidal cells. When the AIS moved away from the soma (A), the somatic AP became steeper (A), while its threshold potential decreased (B,C) and its rapidity at onset increased (B,D). The magnitude of the dynamical transfer gain of the model was plotted in the Fourier domain, across increasing soma-AIS distances, normalized to its value at 1 cycle/s (E). The “cut-off” frequency was then studied against the soma-AIS distance (D) and fitted by a logistic function. Color coding as in Fig 2 and error bars (C-F) representing the standard deviation over 100 independent repeated simulations.
Fig 6
Fig 6
Reduction to a point neuron model. We tuned the parameters of an exponential Integrate-and-Fire (eIF) point neuron model to optimally match the membrane potential of the ball-and-stick model, in response to the same noisy input current. (A) The voltage-dependent AP initiation current was isolated by subtraction, (B) best fitted to the current-voltage relationship of the eIF, and (C) shown to adequately capture both the timing of individual APs and the trajectory of subthreshold membrane potential.
Fig 7
Fig 7
Liquid-state machine computations. In order to test the functional impact of the AIS location and the bandwidth of the transfer gain, we simulated a network of exponential Integrate-and-Fire (eIF) units using parameters fit to models with different AIS locations (see Fig 6 and Table 3). (A) The input was fed to a pool of recurrently connected neurons (black and blue: excitatory, red: inhibitory). Neurons were connected randomly through dynamic synapses. The filtered spikes (liquid states) of a subset of excitatory neurons (output neurons, blue), was used as input to a linear classifier. (B) The network input consisted of jittered versions of two base spike templates. (C) The classifier was trained to compute a XOR of the last two shown templates (top) using the spikes of the output neurons (blue) in the liquid (middle). As performance criterion we recorded how often the readout response y (bottom) matched the target output y^ (correct outputs are shown in green, incorrect outputs in red) for the parameters for different AIS locations (e.g. the AP slope ΔT). (D) The fitted ΔT values are shown versus the soma-AIS distance. The insets show the change of the slope at the AP onset from the first to the last AIS position. (E) As we varied the AIS locations, the Liquid State Machine performance improved in the classification task. The effect was significant for the first two distance increments (50 runs, Wilcoxon rank-sum test, * = p < 0.05, ** = p < 0.005, etc.).

References

    1. Naundorf B, Wolf F, Volgushev M. Unique features of action potential initiation in cortical neurons. Nature. 2006;440: 1060–1063. 10.1038/nature04610 - DOI - PubMed
    1. Köndgen H, Geisler C, Fusi S, Wang XJ, Lüscher HR, Giugliano M. The dynamical response properties of neocortical neurons to temporally modulated noisy inputs in vitro. Cereb Cortex. 2008;18: 2086–2097. 10.1093/cercor/bhm235 - DOI - PMC - PubMed
    1. Lundstrom BN, Higgs MH, Spain WJ, Fairhall AL. Fractional differentiation by neocortical pyramidal neurons. [cited 13 Feb 2020]. 10.1038/nn.2212 - DOI - PMC - PubMed
    1. Boucsein C, Tetzlaff T, Meier R, Aertsen A, Naundorf B. Brief Communications Dynamical Response Properties of Neocortical Neuron Ensembles: Multiplicative versus Additive Noise. 2009. [cited 30 Apr 2019]. 10.1523/JNEUROSCI.3424-08.2009 - DOI - PMC - PubMed
    1. Tchumatchenko T, Malyshev A, Wolf F, Volgushev M. Ultrafast population encoding by cortical neurons. J Neurosci. 2011;31: 12171–12179. 10.1523/JNEUROSCI.2182-11.2011 - DOI - PMC - PubMed

Publication types

Substances