. 2020 Aug 6;182(3):625-640.e24.
doi: 10.1016/j.cell.2020.06.026. Epub 2020 Jul 22.

Microglia Require CD4 T Cells to Complete the Fetal-to-Adult Transition

Affiliations

Microglia Require CD4 T Cells to Complete the Fetal-to-Adult Transition

Emanuela Pasciuto et al. Cell. .

Abstract

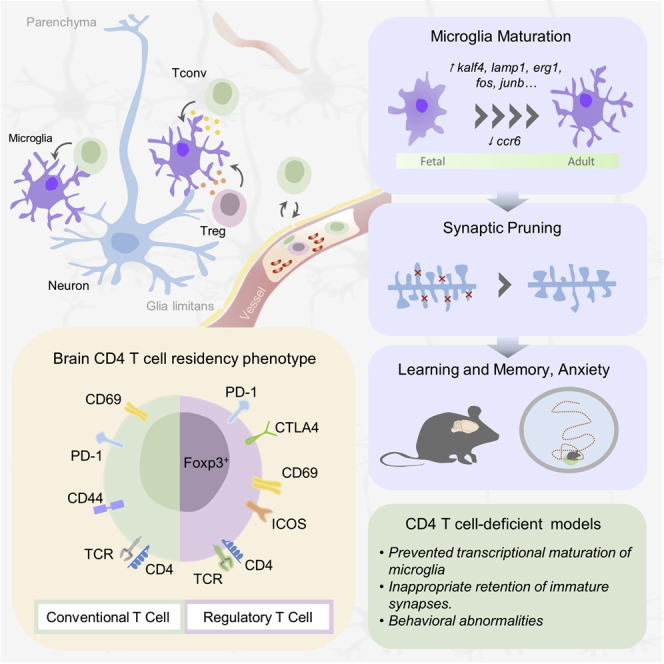
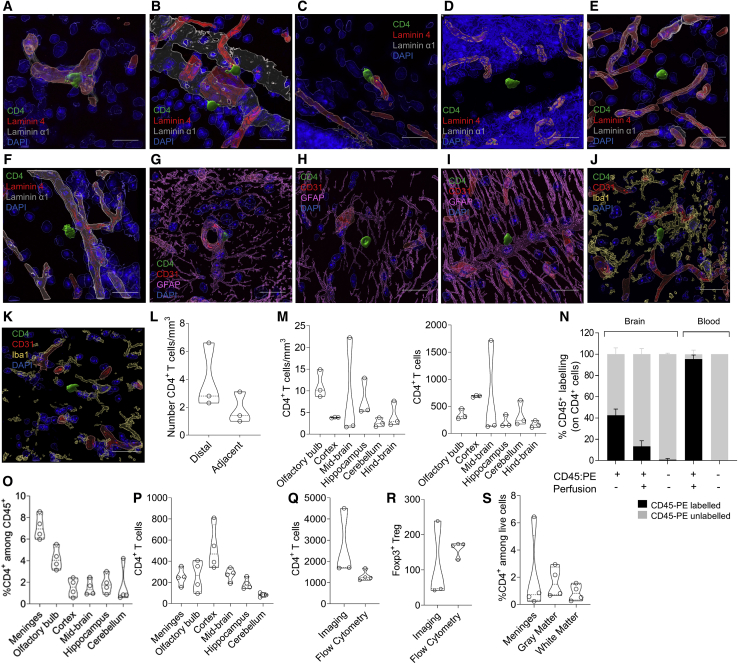
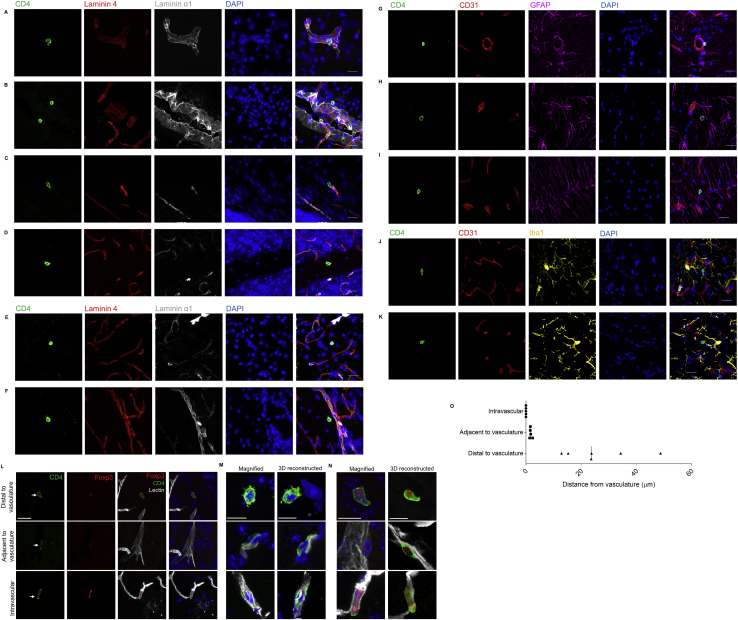
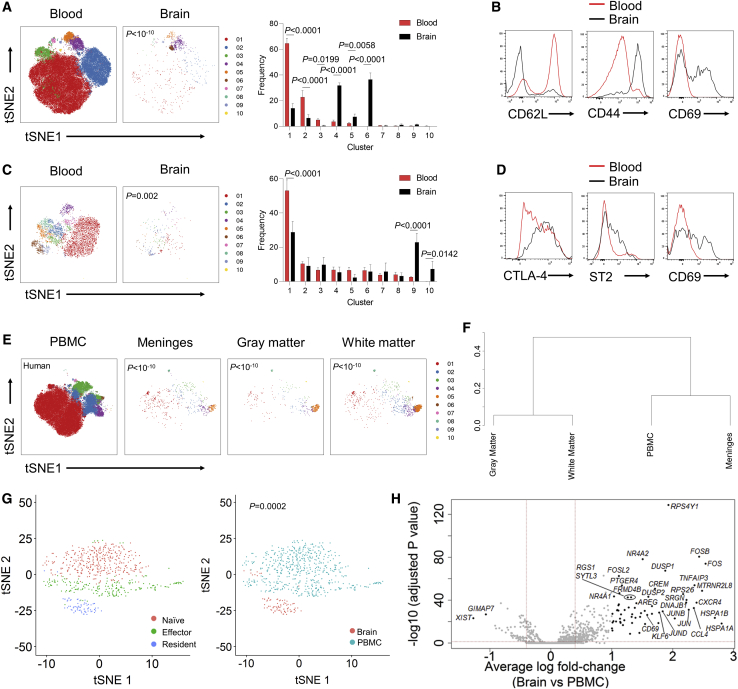
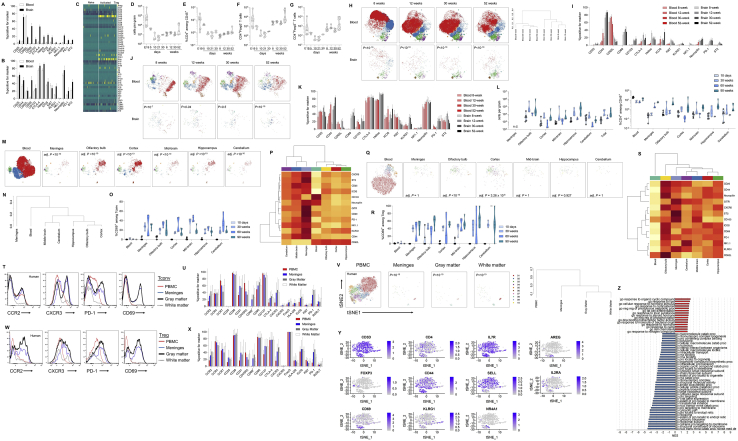
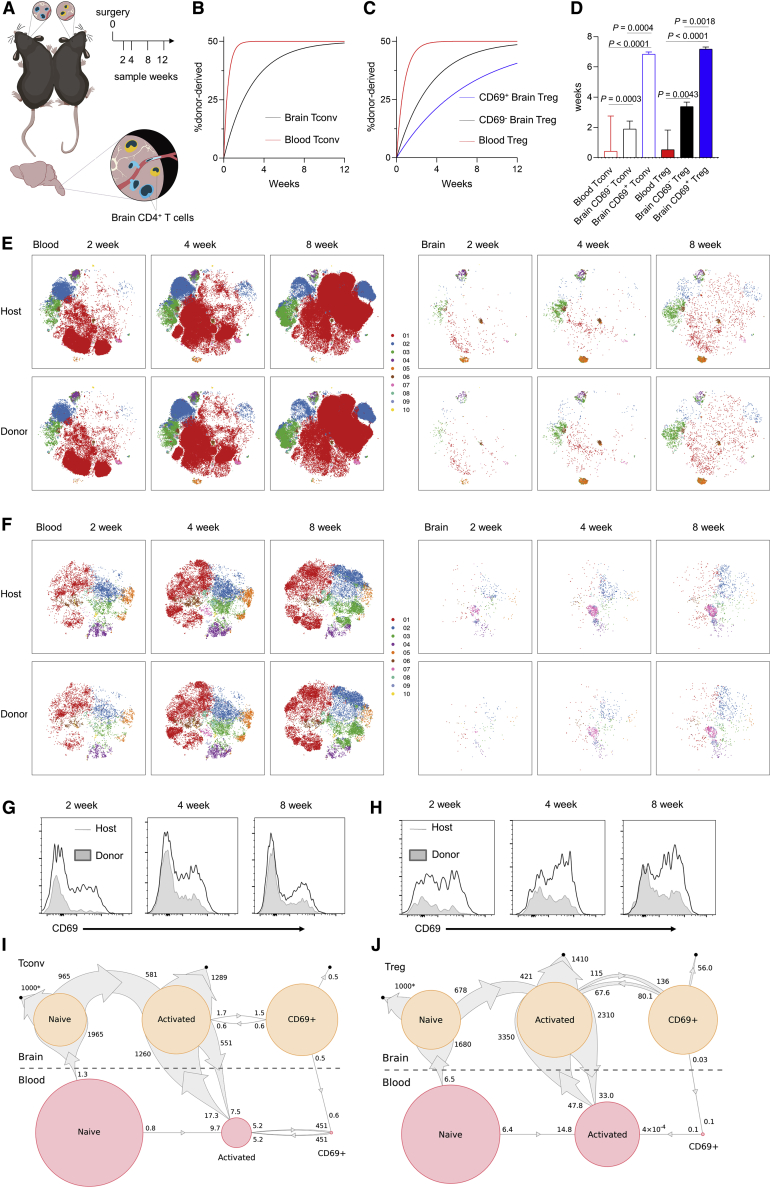
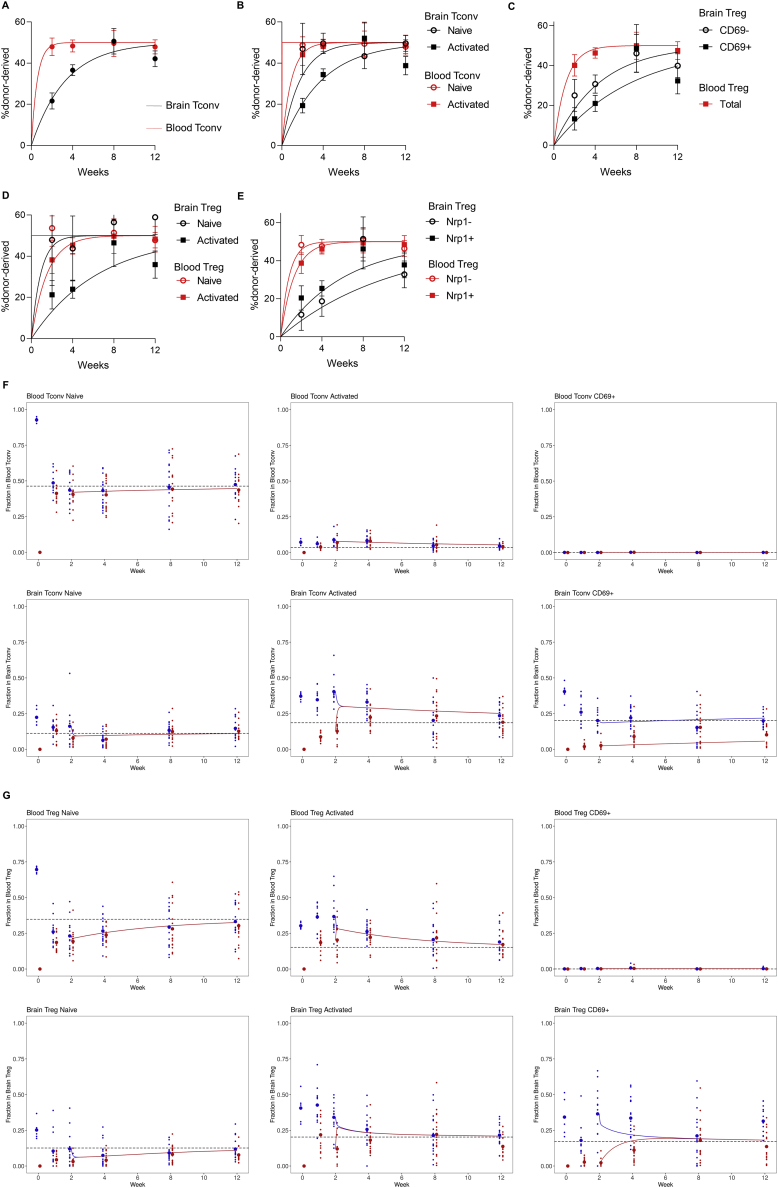
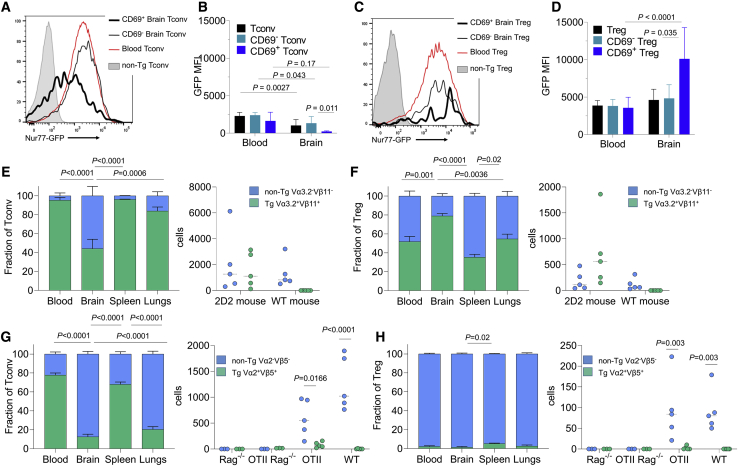
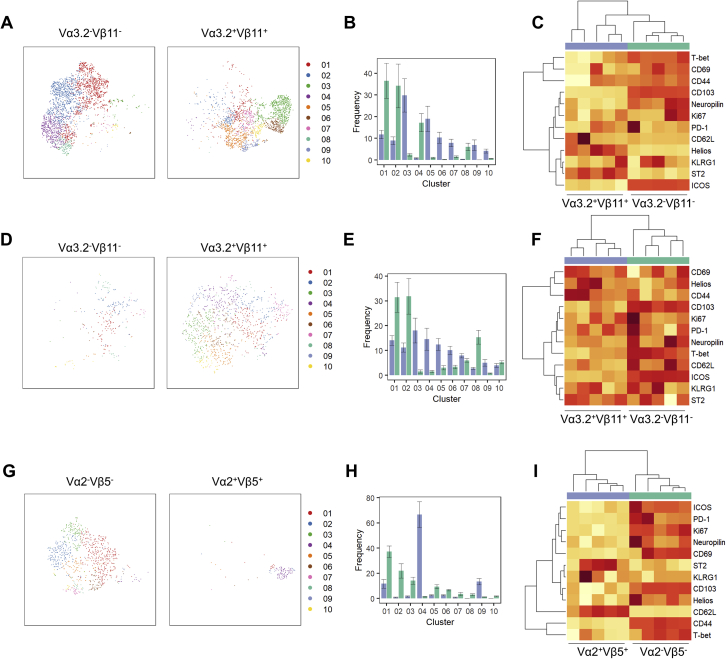
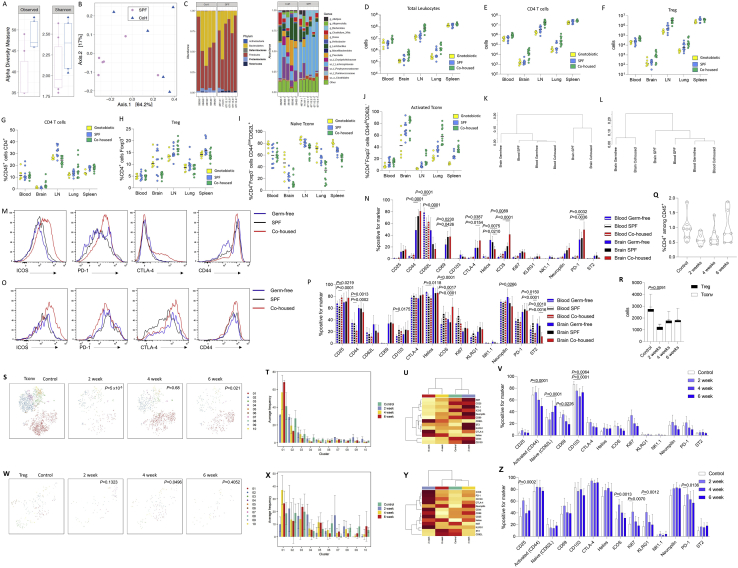
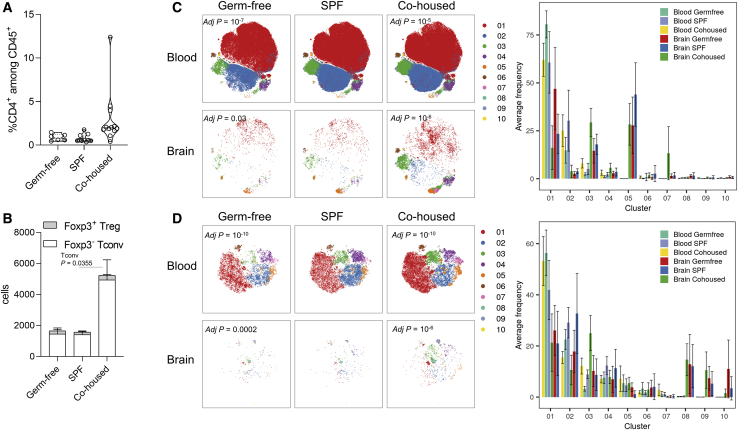
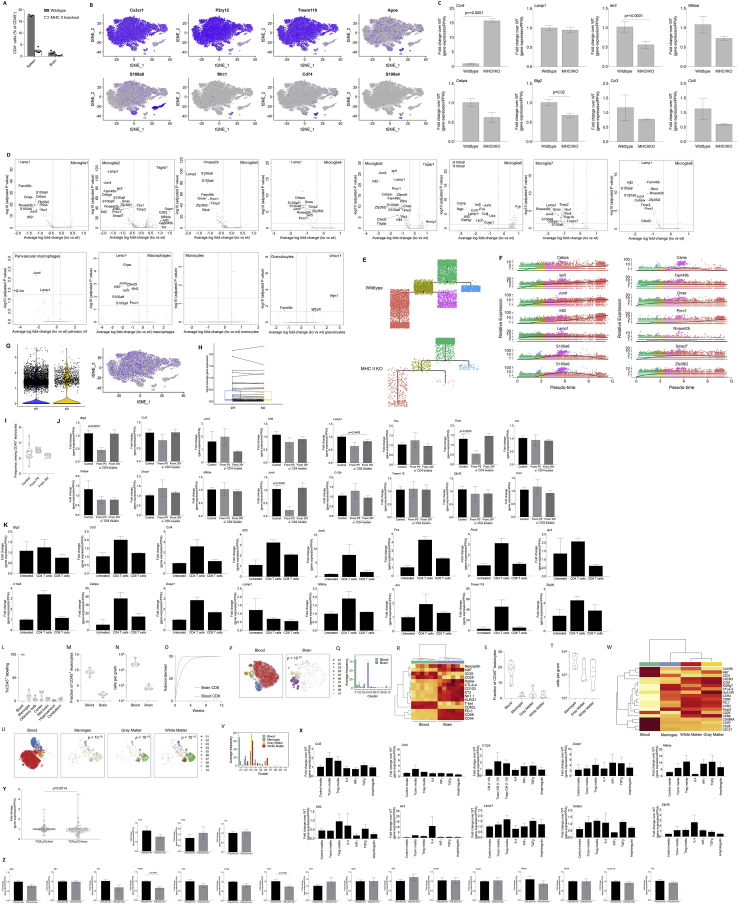
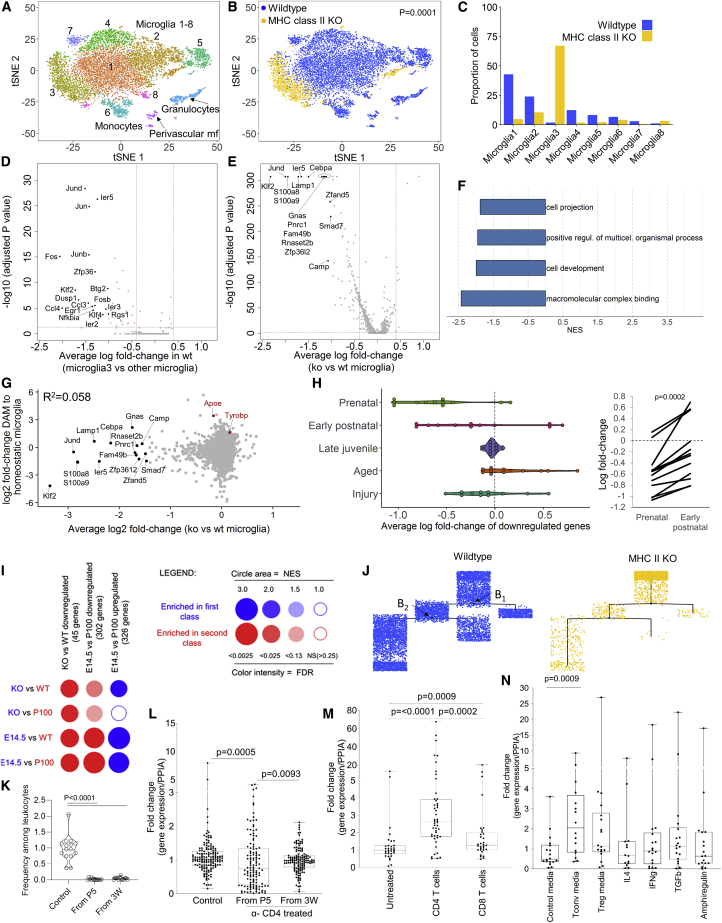
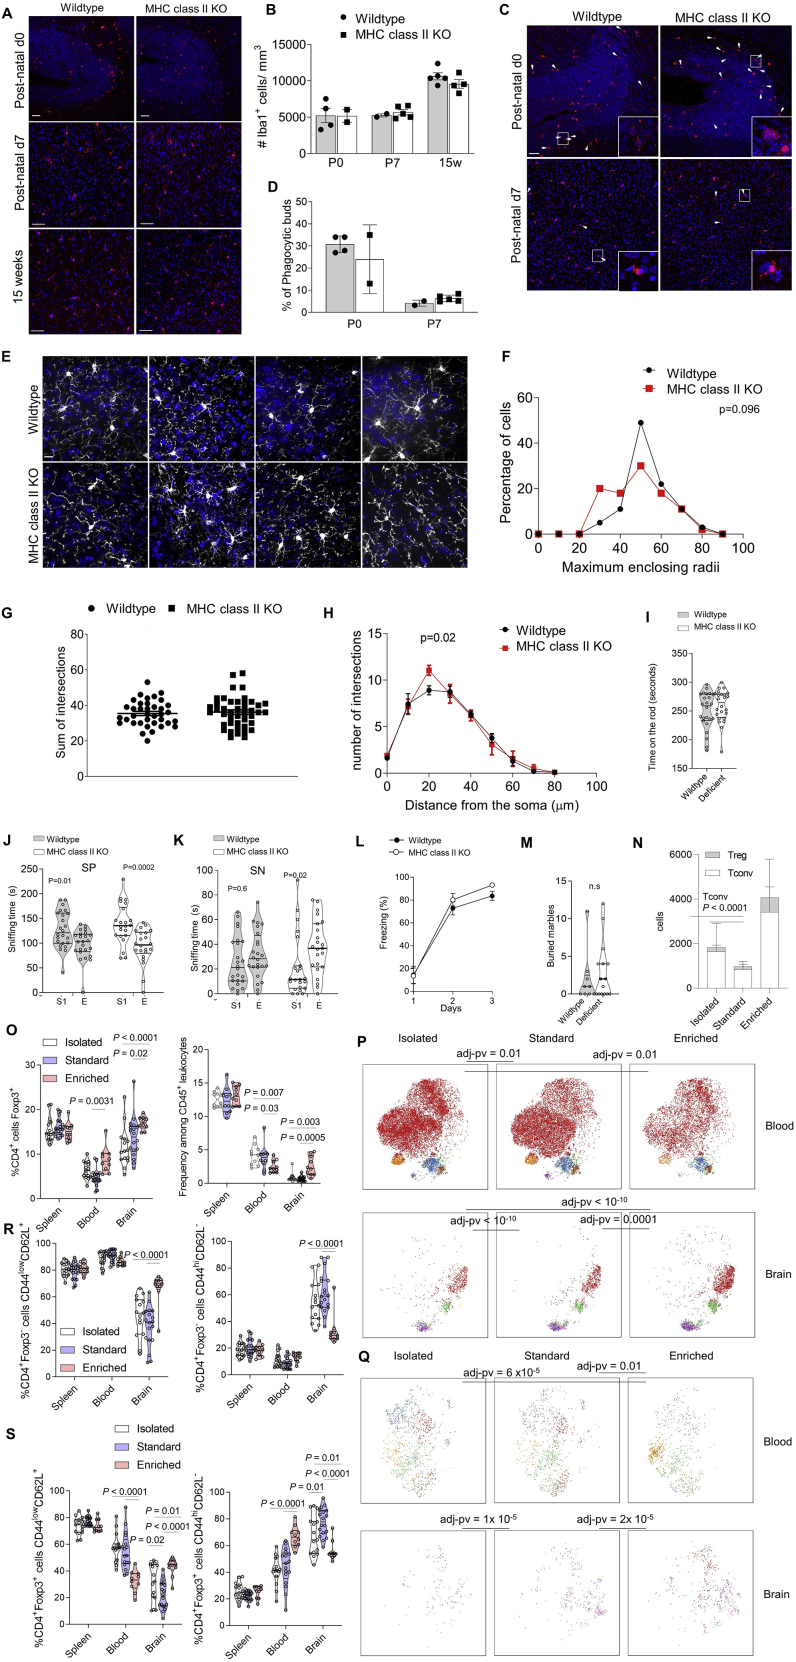
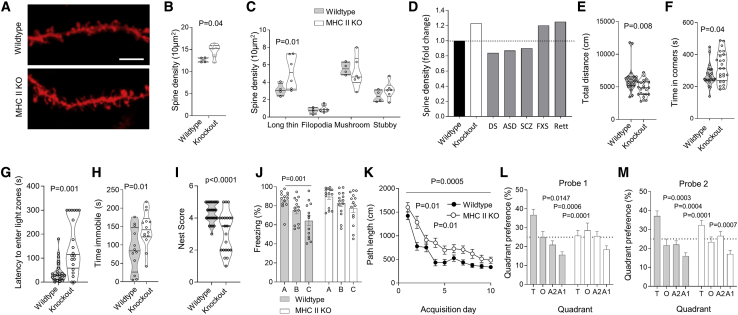
The brain is a site of relative immune privilege. Although CD4 T cells have been reported in the central nervous system, their presence in the healthy brain remains controversial, and their function remains largely unknown. We used a combination of imaging, single cell, and surgical approaches to identify a CD69+ CD4 T cell population in both the mouse and human brain, distinct from circulating CD4 T cells. The brain-resident population was derived through in situ differentiation from activated circulatory cells and was shaped by self-antigen and the peripheral microbiome. Single-cell sequencing revealed that in the absence of murine CD4 T cells, resident microglia remained suspended between the fetal and adult states. This maturation defect resulted in excess immature neuronal synapses and behavioral abnormalities. These results illuminate a role for CD4 T cells in brain development and a potential interconnected dynamic between the evolution of the immunological and neurological systems. VIDEO ABSTRACT.

Keywords: CD4 T cells; T cells; brain; differentiation; human; microflora; microglia; migration; mouse; tissue-resident.


Conflict of interest statement

Declaration of Interests The authors declare no competing interests.

Figures

None
Graphical abstract
Figure 1
Figure 1
CD4 T Cells Are Present in the Healthy Mouse and Human Brain For a Figure360 author presentation of this figure, see https://doi.org/10.1016/j.cell.2020.06.026. (A and B) Surface rendering of confocal images. Representative image of (A) CD4 T cell crossing laminin 4 barrier or (B) laminin α1 barrier within midbrain meningeal folds. (C) Representative image of a CD4 T cell undergoing transvascular movement in the hindbrain. (D–F) Representative images of CD4 T cells beyond the laminin 4/α1 barrier in the (D) cerebellum, (E) hindbrain, or (F) olfactory bulb. (G–I) Representative images of CD4 T cells (G) enclosed by the glia limitans in the mid-brain and beyond the glia limitans in (H) the midbrain and (I) the cerebellum. (J and K) Representative images of CD4 T cells in close proximity to microglia in the (J) midbrain (K) or hindbrain. Scale bar, 20 μm. (L) Quantification of CD4 T cells based on proximity to vasculature from the sagittal sections of the mouse brain. (M) Relative and absolute distribution of CD4 T cells across mouse brain regions, based on quantification of sagittal sections. Values represent the number of non-vascular CD4 T cells located in each region, per mm3 or in absolute number (biological replicates from the average of 21–23 quantified sections). (N) Mice were intravenously (i.v.) injected with anti-CD45-PE and perfused. Brains were then dissected and analyzed by flow cytometry for the proportion of intravascular CD4 T cells (n = 3,5,2). (O and P) CD4 T cells in dissected mouse brain regions by flow cytometry, based on (O) percentage of CD45+ cells or (P) absolute number (n = 4). (Q and R) Absolute number of (Q) CD4 T cells and (R) Tregs in the perfused healthy mouse brain, as assessed by imaging (excluding vascular cells) and flow cytometry (excluding meningeal cells). (S) Average proportion of CD4 T cells in the white matter, gray matter, and meninges of healthy brain tissue (n = 4). See also Figure S1 and Videos S1, S2, S3, S4, S5, S6, and S7.
Figure S1
Figure S1
Localization of CD4 T Cells in the Healthy Mouse Brain, Related to Figure 1 (A) Perfused brain was stained for CD4 (green), laminin 4 (red), laminin α1 (white) and DAPI (blue), displaying individual channels and composite image. Representative image of CD4 T cell crossing laminin 4 barrier or (B) laminin α1 barrier within midbrain meningeal folds. (C) Representative image of a CD4 T cell undergoing transvascular movement in the hindbrain. (D) Representative images of CD4 T cells beyond the laminin 4/α1 barrier in the cerebellum, (E) hindbrain or (F) olfactory bulb. (G) Surface rendering of confocal images showing CD4 T cells (green), CD31+ vasculature (red), GFAP+ astrocytes (magenta) and DAPI (blue). Representative images of CD4 T cells enclosed by the glia limitans in the mid-brain, and beyond the glia limitans in (H) the midbrain and (I) the cerebellum. (J) Perfused brain was stained for CD4 (green), CD31 (red), Iba1 (yellow) and DAPI (blue), displaying individual channels and composite image. Representative images of CD4 T cells in close proximity to microglia in the midbrain (K) or hindbrain. Scale bar = 20μm. (L) Representative confocal images showing CD4 T cells, immunostained using CD4 (green) and Foxp3 (red) staining located in mouse brain distal to the vasculature, adjacent to the vasculature, and in the intravascular space. Fluorescent-labeled lectin was used to label vasculature (white) and cell nuclei were stained with DAPI (blue). Scale bar = 20μm. (M) Magnification and 3D-reconstruction of an example of CD4+Foxp3- T cells, and (N) CD4+Foxp3+ T cells. Scale bar = 10μm. (O) Representative measurements of distances between CD4 T cells and the vasculature, for cells deemed distal to, adjacent to or inside the vasculature.
Figure 2
Figure 2
A Conserved Residency Program for CD4 T Cells and Tregs in the Healthy Mouse and Human Brain (A) Healthy perfused mouse brains were compared to blood by high-dimensional flow cytometry. n = 5. t-Distributed Stochastic Neighbor Embedding (t-SNE) of conventional T cells built on key markers (CD62L, CD44, CD103, CD69, CD25, PD-1, Nrp1, ICOS, KLRG1, ST2, Ki67, Helios, T-bet, and CTLA4). Colors indicate FlowSOM clusters, quantified in side panel. (B) Representative histograms for conventional T cells from wild-type mouse blood and brain. (C) t-SNE of Tregs built on key markers. Colors indicate FlowSOM clusters, quantified in side panel. (D) Representative histograms for Tregs from mouse blood and brain. (E) Unaffected human brain tissues were compared to peripheral blood mononuclear cells (PBMCs) by high-dimensional flow cytometry, n = 4. t-SNE of conventional T cells built on key markers (ICOS, CD28, CD69, Ki-67, CD95, CD31, HLA-DR, CCR2, CXCR5, CD25, PD-1, CXCR3, RORγT, CCR4, CTLA-4, CCR7, and CD45RA). Colors indicate FlowSOM clusters. (F) Dendrogram showing the relationship across the brain regions based on cross-entropy differences in t-SNE. (G) 10× single-cell sequencing was performed on sorted CD4 T cells from the human brain and PBMCs. Quality control filtering and gating based on expression markers identified 86 CD4+ T cells from the brain and 567 CD4+ T cells from the blood. t-SNE visualizing cell clusters built on the combined population of 653 CD4+ cells. Clusters are identified with different colors and labeled based on signature expression of transcriptional markers (left) or tissue origin (right). (H) Volcano plot of differential expression between brain and PBMC CD4 T cells. Indicated cut-offs are used for pathway analysis. See also Figure S2.
Figure S2
Figure S2
A Conserved Residency Profile for CD4 T Cells and Regulatory T Cells in the Healthy Mouse and Human Brain, Related to Figure 2 (A) Healthy perfused mouse brains were compared to blood by high-dimensional flow cytometry. Comparison of expression levels of CD62L, CD44, CD103, CD69, CD25, PD-1, Nrp1, ICOS, KLRG1, ST2, Ki67, Helios, T-bet and CTLA4 on blood versus brain CD4+CD3+CD45+CD8-Foxp3- T cells or (B) CD4+CD3+CD45+CD8-Foxp3+ Tregs (n = 5). (C) Transcription profile of CD4+ T cells purified from the murine brain, with analysis through the 10X single cell pipeline and filtering for known cytokines. Naive, activated and regulatory cells were defined based on tSNE clusters and the relative expression of CD44, CD62L and Foxp3 within each cluster. (D) CD4 T cells were assessed in the perfused mouse brain by high-dimensional flow cytometry. Wild-type mice were sampled across the late embryonic (day 19), post-natal development (day 5, 10, 21, 30) and during healthy aging (weeks 8, 12, 30 and 52). n = 9,3,3,5,2,8,5,6,5. Quantification of CD4+ cells per gram of brain tissue, (E) CD4+ T cells, as percentage of CD45+ cells, (F) CD4+Foxp3- conventional T cells and (G) CD4+Foxp3+ regulatory T cells. (H) tSNE of CD4+Foxp3- T cells gated on CD4+Foxp3-CD3+CD8-CD45+ cells and built on CD62L, CD44, CD103, CD69, CD25, PD-1, Nrp1, ICOS, KLRG1, ST2, Ki67, Helios, T-bet and CTLA4. FlowSOM clusters identified in color. P values refer to cross-entropy difference between age-matched blood and brain samples. Dendrogram represents cross-entropy distance between samples. (I) Comparison of expression levels of CD62L, CD44, CD103, CD69, CD25, PD-1, Nrp1, ICOS, KLRG1, ST2, Ki67, Helios, T-bet and CTLA4 on blood versus brain CD4+CD3+CD45+CD8-Foxp3- T cells at different ages. (G) tSNE of CD4+Foxp3+ T cells gated on CD4+Foxp3+CD3+CD8-CD45+ cells and built on CD62L, CD44, CD103, CD69, CD25, PD-1, Nrp1, ICOS, KLRG1, ST2, Ki67, Helios, T-bet and CTLA4. FlowSOM clusters identified in color. P values refer to cross-entropy difference between age-matched blood and brain samples. (J) Comparison of expression levels of CD62L, CD44, CD103, CD69, CD25, PD-1, Nrp1, ICOS, KLRG1, ST2, Ki67, Helios, T-bet and CTLA4 on blood versus brain CD4+CD3+CD45+CD8-Foxp3+ T cells at different ages. (K) Brain regions were surgically dissected and resident CD4 T cells were characterized by high-dimensional flow cytometry at 10 days, 30 weeks, 60 weeks and 90 weeks of age (n = 6,4,4,5). (L) Numbers and frequencies of CD4 T cells across brain regions in pups and adult mice. (M) tSNE of CD4+ Foxp3- T cells gated on CD4+Foxp3-CD3+CD8-CD45+ cells and built on CD62L, CD44, CD103, CD69, CD25, PD-1, Nrp1, ICOS, KLRG1, ST2, Ki67, Helios, T-bet, CTLA4, shown for blood and different brain regions in adult mice. The adjusted P value reflects the cross-entropy difference between tSNE plots in brain region versus blood. (N) Dendrogram showing the relationship in Tconv across the brain regions based on cross-entropy differences in tSNE. (O) CD69 expression in Tconv from the brain regions in pups and adult mice. (P) Heatmap showing expression of markers in brain region Tconv. (Q) tSNE of CD4+ Foxp3+ T cells gated on CD4+Foxp3+CD3+CD8-CD45+ cells and built on CD62L, CD44, CD103, CD69, CD25, PD-1, Nrp1, ICOS, KLRG1, ST2, Ki67, Helios, T-bet, CTLA4, shown for blood and different brain regions. The adjusted P value reflects the cross-entropy difference between tSNE plots in brain region versus blood. (R) CD69 expression in Treg from the brain regions in pups and adult mice. (S) Heatmap showing expression of markers in brain region Treg. (T) Unaffected human brain tissues removed during brain surgery were compared to peripheral blood mononuclear cells by high-dimensional flow cytometry (n = 4). Representative histograms for CD4+Foxp3- T cells from human peripheral blood mononuclear cells, white matter, gray matter and meninges for CCR2, CXCR3, PD-1 and CD69. (U) Expression of ICOS, CD28, CD69, Ki-67, CD95, CD31, HLA-DR, CCR2, CXCR5, CD25, PD-1, CXCR3, RORγT, CCR4, CTLA-4, CCR7 and CD45RA on CD4+Foxp3- T cells. (V) tSNE of CD4+Foxp3+ T cells gated on CD4+Foxp3+CD3+CD8-CD14- cells and built on ICOS, CD28, CD69, Ki-67, CD95, CD31, HLA-DR, CCR2, CXCR5, CD25, PD-1, CXCR3, RORγT, CCR4, CTLA-4, CCR7 and CD45RA. Colors indicate FlowSOM clusters. Dendrogram showing the relationship across the brain regions based on cross-entropy differences in tSNE. (W) Representative histograms for CD4+Foxp3+ T cells from human peripheral blood mononuclear cells, white matter, gray matter and meninges for CCR2, CXCR3, PD-1 and CD69. (X) Expression of ICOS, CD28, CD69, Ki-67, CD95, CD31, HLA-DR, CCR2, CXCR5, CD25, PD-1, CXCR3, RORγT, CCR4, CTLA-4, CCR7 and CD45RA on CD4+Foxp3+ T cells. (Y) Single cell RNaseq data from sorted CD4+CD3+CD8- cells from the human brain and PBMCs. Quality control filtering and gating based on expression markers identified 86 CD4+ T cells from the brain and 567 CD4+ T cells from the blood. tSNE dimensionality reduction is used for cluster display, with lineage marker expression indicated by color for CD3D, CD4, IL7R, IL2RA, FOXP3, CD44, SELL, AREG, CD69, KLRG1 and NR4A1. (Z) Differentially expressed genes were assessed for pathway by GSEA.
Figure 3
Figure 3
Brain-Resident CD4 T Cells Acquire a Residency Phenotype In Situ during a Prolonged Brain Transit (A) Schematic of parabiosis experiments (n = 12,12,18,16,14). (B and C) Curve of best fit for the origin of conventional (B) T cells or (C) Tregs showing CD69 and CD69+ in the blood and brain. (D) Derived median dwell times. (E and F) t-SNE of conventional (E) T cells and (F) Tregs built on CD62L, CD44, CD103, CD69, CD25, PD-1, Nrp1, ICOS, KLRG1, ST2, Ki67, Helios, T-bet, and CTLA4. FlowSOM clusters represented in color. Host and incoming cells were defined on CD45.1 versus CD45.2 expression, and are shown at the 2-, 4-, and 8-week time points. (G and H) CD69 histograms for CD4 conventional (G) T cells and (H) Tregs. (I and J) Population flow diagrams for conventional (I) T cells and (J) Tregs, in homeostatic state. Circle areas represent population frequencies, calculated independently for blood and brain. Small black circles represent cell death. The size of arrow ends is proportional to the rate of population flow. Numbers display the corresponding entry or exit rate, in events/1,000 cells/day. Numbers with asterisk denote rates with high estimation uncertainty. Population transitions with rates lower than 0.1/1,000 cells/day are not shown. See also Figure S3.
Figure S3
Figure S3
Parabiotic Analysis of Brain T Cell Kinetics, Related to Figure 3 Parabiosis surgery was performed on Foxp3Thy1.1CD45.1 and Foxp3Thy1.1CD45.2 mice, with analysis of brain and blood CD4 T cells at 1, 2, 4, 8 and 12 weeks (n = 12, 12, 18, 16, 14). Curves of best fit as well as the mean ± SEM for each subset are displayed at each time-point. (A) Curve of best fit for the origin of CD4+Foxp3- conventional T cells in the blood and brain. (B) Curve of best fit for the origin of CD4+Foxp3- conventional T cells in the blood and brain, divided into naive (CD62LhiCD44low) and antigen-experienced (CD62LlowCD44hi) subsets. (C) Curve of best fit for the origin of CD4+Foxp3+ regulatory T cells in the blood and brain, divided into CD69- and CD69+ subsets in the brain. (D) Curve of best fit for the origin of CD4+Foxp3+ regulatory T cells in the blood and brain, divided into naive (CD62LhiCD44low) and antigen-experienced (CD62LlowCD44hi) subsets. (E) Curve of best fit for the origin of CD4+Foxp3+ regulatory T cells in the blood and brain, divided into thymic-derived (Nrp1+) and peripherally-derived (Nrp1-) subsets. (F) Time evolution of average populations as predicted by a continuous-time Markov chain model fitted on the data from weeks 2 to 12, with homeostatic state identified from week 0. Experimental data (points) and calculations (solid lines) are shown in blue for host cells and in red for donor cells. Big points identify experimental population averages, whereas homeostatic states are displayed with black dashed lines. Model for CD4+Foxp3- conventional T cells and (G) CD4+Foxp3+ regulatory T cells. Tissue and subpopulation for each graph are shown in the top-left graph label.
Figure 4
Figure 4
Brain CD4 T Cells Are Licensed For Brain Entry by Peripheral Activation (A–D) Perfused brains from Nur77-GFP reporter mice were assessed for Nur77 reporter expression, n = 8. (A) Representative histograms and (B) average expression for conventional CD4 T cells in the blood and brain. (C) Representative histograms and (D) average expression for Tregs in the blood and brain. (E and F) Blood, perfused brains, spleen, and perfused lung from 2D2 transgenic mice and (right panel) wild-type controls were assessed for the frequency and numbers of transgene-expressing (Vα3.2+Vβ11+) and transgene-non-expressing (Vα3.2Vβ11) (E) conventional and (F) Tregs (n = 5,5). (G and H) Blood, perfused brains, spleen, and perfused lung were collected from OT-II and (right panel) wild-type mice, on the Rag-sufficient or -deficient background, were assessed for the frequency and numbers of transgene-expressing (Vα2+Vβ5+) and transgene-non-expressing (Vα2Vβ5) (G) conventional and (H) Tregs (n = 5,5). p values represent one-way ANOVA with Tukey’s multiple comparison for cross-organ data and Sidak’s multiple comparison test for 2-way ANOVA for within brain comparison. See also Figure S4.
Figure S4
Figure S4
Phenotypic Profile of Brain-Resident TCR Transgenic CD4 T Cells, Related to Figure 4 CD4 T cells from perfused brains of TCR transgenic mice and wild-type controls (n = 5) were assessed by high parameter flow cytometry for CD62L, CD44, CD103, CD69, CD25, PD-1, Nrp1, ICOS, KLRG1, ST2, Ki67, Helios, T-bet, CTLA4. (A) tSNE of CD4+Foxp3- conventional 2D2 T cells, gated on CD4+Foxp3-CD3+CD8-CD45+ cells and subdivided into transgene-expressing (Vα3.2+Vβ11+) and transgene-non-expressing (Vα3.2-Vβ11-) cells. The tSNE was built on CD62L, CD44, CD103, CD69, CD25, PD-1, Nrp1, ICOS, KLRG1, ST2, Ki67, Helios, T-bet, CTLA4. FlowSOM clusters are illustrated in color and (B) quantified. (C) Heatmap of expression changes between transgene-expressing (Vα3.2+Vβ11+) and transgene-non-expressing (Vα3.2-Vβ11-) conventional 2D2 CD4+ T cells. (D) tSNE of CD4+Foxp3+ 2D2 regulatory T cells, gated on CD4+Foxp3+CD3+CD8-CD45+ cells and subdivided into transgene-expressing (Vα3.2+Vβ11+) and transgene-non-expressing (Vα3.2-Vβ11-) cells. The tSNE was built on CD62L, CD44, CD103, CD69, CD25, PD-1, Nrp1, ICOS, KLRG1, ST2, Ki67, Helios, T-bet, CTLA4. FlowSOM clusters are illustrated in color and (E) quantified. (F) Heatmap of expression changes between transgene-expressing (Vα2+Vβ5+) and transgene-non-expressing (Vα2-Vβ5-) regulatory T cells. (G) tSNE of CD4+Foxp3- conventional OT-II T cells, gated on CD4+Foxp3-CD3+CD8-CD45+ cells and subdivided into transgene-expressing (Vα2+Vβ5+) and transgene-non-expressing (Vα2-Vβ5-) cells. The tSNE was built on CD62L, CD44, CD103, CD69, CD25, PD-1, Nrp1, ICOS, KLRG1, ST2, Ki67, Helios, T-bet, CTLA4. FlowSOM clusters are illustrated in color and (H) quantified. (I) Heatmap of expression changes between transgene-expressing (Vα2+Vβ5+) and transgene-non-expressing (Vα2-Vβ5-) conventional OT-II CD4+ T cells.
Figure S5
Figure S5
Altered Activated Conventional Brain CD4 T Cells following Exposure to a Wild Microbiome or Broad-Spectrum Antibiotic Treatment, Related to Figure 5 (A) The microbial diversity of caecal contents in specific pathogen-free (SPF) and wild-cohoused (CoH) mice was compared through 16S rRNA analysis. When comparing the microbial communities from SPE and CoH mice groups, we detect differences in richness but not in the Shannon diversity index (p < 0.03 and p > 0.05, respectively, Wilcoxon test) in the CoH compared to SPF mice. 32% of the variation on the microbial composition can be explained by this grouping (adonis test, R2 = 0.31681, p = 0.022). (B) Principal coordinate analysis (PCoA) of the mice microbiota community variation based on Bacteria and Archaea genus-level Bray-Curtis dissimilarity distances revealed two different clusters. (C) Phylum and genus distribution barplots. Only the top 14 genera are displayed. The body of the boxplot represents the first and third quartiles of the distribution and the median line. The whiskers extend from the quartiles to the last data point within 1.5 × IQR, with outliers beyond. ‘uc_f’: unclassified genus of the family and ‘uc_o’: unclassified genus of the order. Differential abundance analysis at the phylum level identified Deferribacteres and Proteobacteria enriched and Tenericutes depleted in CoH mice (q-values < 0.1, Wilcoxon test). (D) Lymph nodes, spleen, blood, perfused brain and perfused lung were dissected from gnotobiotic, SPF and dirty cohoused mice (n = 6, 10, 12) and assessed by flow cytometry. Total leukocyte counts, and (E) absolute numbers of CD4 T cells or (F) Tregs. (G) Proportion of CD4 T cells within the CD45+ compartment. (H) Proportion of Tregs within the CD4+ compartment. (I) Proportion of naive or (J) activated cells within the conventional T cell compartment. (K) Dendrogram showing the relationship of conventional T cells and (L) Tregs across the samples, based on cross-entropy differences in tSNE for expression of CD62L, CD44, CD103, CD69, CD25, PD-1, Nrp1, ICOS, KLRG1, ST2, Ki67, Helios, T-bet, CTLA4. (M) Representative histograms shown for ICOS, PD-1, CTLA-4 and CD44 on conventional CD4 T cells. (N) Expression of assessed markers on conventional CD4 T cells. (O) Representative histograms shown for ICOS, PD-1, CTLA-4 and CD44 on Tregs. (P) Expression of assessed markers on Tregs. (Q) Wild-type mice were placed on broad-spectrum antibiotics for 2, 4 or 6 weeks (n = 5, 8, 6) and were compared to untreated control mice (n = 8) by high parameter flow cytometry of the perfused brain. CD4 T cells in perfused brain, as a percentage of CD45+ cells, and (R) absolute numbers of conventional and regulatory CD4 T cells in the brain. P value refers to comparison of conventional T cells. (S) tSNE of CD4+Foxp3- T cells gated on CD4+Foxp3-CD3+CD8-CD45+ cells and built on CD62L, CD44, CD103, CD69, CD25, PD-1, Nrp1, ICOS, KLRG1, ST2, Ki67, Helios, T-bet, CTLA4. P values represent cross-entropy comparison to control mice. FlowSOM clusters are illustrated in color and (T) quantified. (U) Expression heatmap and (V) marker expression rate for CD62L, CD44, CD103, CD69, CD25, PD-1, Nrp1, ICOS, KLRG1, ST2, Ki67, Helios, T-bet and CTLA4 levels in CD4+Foxp3- T cells. (W) tSNE of CD4+Foxp3+ T cells gated on CD4+Foxp3+CD3+CD8-CD45+ cells and built on CD62L, CD44, CD103, CD69, CD25, PD-1, Nrp1, ICOS, KLRG1, ST2, Ki67, Helios, T-bet, CTLA4. P values represent cross-entropy comparison to control mice. FlowSOM clusters are illustrated in color and (X) quantified. (Y) Expression heatmap and (Z) marker expression rate for CD62L, CD44, CD103, CD69, CD25, PD-1, Nrp1, ICOS, KLRG1, ST2, Ki67, Helios, T-bet and CTLA4 levels in CD4+Foxp3+ T cells.
Figure 5
Figure 5
Brain Conventional CD4 T Cells Are Expanded by Exposure to the Microbiome (A and B) Perfused mouse brains were compared to blood by high-dimensional flow cytometry from gnotobiotic, SPF, and dirty co-housed mice (n = 6,10,12). CD4 T cells in perfused brain as (A) a percentage of CD45+ cells and (B) absolute numbers of CD4 T cells in the brain. (C and D) t-SNE of conventional (C) T cells and (D) Tregs built on CD62L, CD44, CD103, CD69, CD25, PD-1, Nrp1, ICOS, KLRG1, ST2, Ki67, Helios, T-bet, and CTLA4, with quantified FlowSOM clusters. p values represent cross-entropy comparison to SPF mice. See also Figure S5.
Figure S6
Figure S6
Brain T Cells Alter Gene Expression in Microglia, Related to Figure 6 (A) Graph of CD4+ T cells in wild-type and MHC II KO mice in the spleen and perfused brain, as a percentage of CD45+ cells (n = 4). (B) Single cell RNaseq data from CD11b+ cells purified from wild-type mice and MHC II-deficient mice were assessed for gene-expression. tSNE dimensionality reduction is used for cluster display, with lineage marker expression indicated by color for Cx3cr1, P2ry12, Tmem119, ApoE, S100a9, Mrc1, Cd74 and S100a4. (C) Gene expression from isolated microglia from adult male wild-type and MHC class II KO mice (n = 4,4) were measured by qPCR. The expression of the indicated genes, selected from the differentially-expressed single cell sequencing dataset (Ccr6 upregulated in MHC II KO microglia, other genes downregulated in MHC II KO microglia) was calculated relative to Ppia rRNA. P values were obtained by two-tailed Mann-Whitney U test. (D) Single cell RNaseq data was generated on microglia collected from wild-type mice and MHC II-deficient mice. Volcano plots of wild-type versus MHC II-deficient clusters 1, cluster 2, cluster 3, cluster 4, cluster 5, cluster 6, cluster 7 and cluster 8 microglia, perivascular macrophages, macrophages, monocytes and granulocytes. Labeled genes with a differential expression of more than 1-log fold change (p < 0.05) are shown in black. (E) Microglia along the trajectory are divided into five groups based on expression of highly variable genes in wild-type and MHC II KO microglia. Cells are colored according to the facet in which they reside. (F) Pseudotime kinetics of genes identified as differentially expressed between wild-type and MHC II KO microglia, colored according to pseudotime trajectory. (G) Single cell RNaseq data from CD11b+ cells purified from wild-type mice and MHC II-deficient mice were assessed for gene-expression. Signature genes previously identified as differentially expressed between yolk sac-derived microglia and peripheral macrophage-derived microglia (Cronk et al., 2018) were assessed. Expression of Sall1, the transcriptional regulator defining authentic microglia differentiation, distinct from macrophage-derived microglia. (left) distribution of reads in normalized UMI counts, (right) marker expression indicated by color on tSNE dimensionality reduction. (H) Average expression of genes constituting the transcriptional signature of genes upregulated in macrophage-derived microglia compared to yolk sac-derived microglia: Abca1, Arhgef10l, Car9, Cln6, Cxcr2, Dclre1c, Dnajb14, Fgf2, Flt3, Fmd6, Fzd7, Galc, Gk, Hoxb4, Ifnar1, Jag1, Kcnn4, Lpar6, Ltbp3, Nrp1, Pcgf2, Pgap1, Pi4k2b, Plekhg5, Pmepa1, Qpct, Rap2a, Rgs1, R1pr1, Sesn1, Sestd1, Sgsh, Slc26a11, Slc44a1, Stab1, Stbd1, Tlr8, Tmem176b, Tpst1, Txndc16, Xylt2, Zdhhc23, Znrf3. (I) Microglia were sorted from control wild-type mice, or wild-type mice treated with anti-CD4 depleting antibody from day 5 or week 3 of age until 7 weeks of age (n = 15,9,9). Quantification of the CD45hiCD11b+Gr1- myeloid compartment of the brain following anti-CD4 depletion, demonstrating no numerical loss of macrophages. (J) Gene expression from isolated microglia was measured by qPCR. The expression of the indicated genes, selected from the downregulated-genes in the single cell sequencing dataset, was calculated relative to Ppia rRNA. P values were obtained by two-tailed Mann-Whitney U test. (K) Brain slices were cultured from neonatal cerebellum and left untreated or seeded with sort-purified CD4+ or CD8+ T cells (n = 2,3,2). Gene expression from isolated microglia was measured by qPCR. The expression of the indicated genes, selected from the downregulated-genes in the single cell sequencing dataset, was calculated relative to Ppia rRNA. P values were obtained by two-tailed Mann-Whitney U test. (L) Mice were i.v. injected with anti-CD45-PE and perfused, following which brains were dissected and analyzed by flow cytometry for the proportion of intravascular CD8 T cells (n = 6). (M) Proportional representation of CD8 T cells among CD45+ leukocytes in mouse (n = 6). (N) Numbers of CD8 T cells per gram in mouse blood and brain (n = 6). (O) CD45.1 and CD45.2 mice were parabiosed and assessed for brain and blood CD8 infiltrate at 2, 4, 8 and 12 weeks post-surgery (n = 12, 12, 18, 16, 14). Curve of best fit for the origin of CD8+ T cells in the blood and brain. (P) Mouse blood and perfused brain were assessed by flow cytometry (n = 6). tSNE of CD8+CD3+CD4-CD45+ cells built on CD62L, CD44, CD103, CD69, CD25, PD-1, Nrp1, ICOS, KLRG1, ST2, Ki67, Helios, T-bet, CTLA4. Colors indicate FlowSOM clusters (Q) which are quantified. (R) Heatmap of protein expression in mouse CD8 T cells. (S) Unaffected human brain tissues removed during brain surgery were compared to peripheral blood mononuclear cells by high-dimensional flow cytometry (n = 8,4), with CD8 T cells quantified as a fraction of CD45+ leukocytes and (T) in absolute number per gram of tissue. (U) Representative tSNE of human CD8+ CD3+CD4-CD14- cells built on ICOS, CD28, CD69, Ki-67, CD95, CD31, HLA-DR, CCR2, CXCR5, CD25, PD-1, CXCR3, RORγT, CCR4, CTLA-4, CCR7 and CD45RA. Colors indicate FlowSOM clusters (V) which are quantified. (W) Heatmap of protein expression in human CD8 T cells. (X) Isolated microglia were cultured with control conditioned media, conventional T cell conditioned media, Treg conditioned media, IL-4, IFN-γ, TGF-β and Amphiregulin (n = 2/group). Gene expression from isolated microglia was measured by qPCR. The expression of the indicated genes, selected from the downregulated-genes in the single cell sequencing dataset, was calculated relative to Ppia rRNA. P values were obtained by two-tailed Mann-Whitney U test. (Y) Microglia were sorted from TCRα knockout mice or heterozygous littermate controls (n = 7,8). Expression of signature genes (downregulated in MHC II KO microglia) were assessed by qPCR, with individual data-points reflecting the average of quadruplicate technical repeats in each of 19 genes across 7-8 biological replicates. (Z) Gene expression from isolated microglia was measured by qPCR. The expression of the indicated genes, selected from the downregulated-genes in the single cell sequencing dataset, was calculated relative to Ppia rRNA.
Figure 6
Figure 6
CD4 T Cell Deficiency Traps Microglia in a Fetal-like Transcriptional State 10× single-cell sequencing was performed on 9,404 CD11b+ cells from the wild-type adult mouse brain and 2,278 CD11b+ cells from the MHC II KO adult mouse brain. (A) t-SNE visualizing cell clusters built on the combined population. (B and C) t-SNE visualizing cells originating from the (B) wild-type and MHC II KO condition with (C) relative proportions. (D) Volcano plot of differential expression between cluster 3 microglia and non-cluster 3 microglia in the wild-type mouse. (E and F) Volcano plot of differential expression between wild-type microglia and microglia from MHC II KO mice (E). High fold-change genes are labeled. Indicated cut-offs (signature genes) are used for (F) pathway analysis by GSEA. (G) Fold-change of all expressed genes between wild-type and MHC II KO mice plotted against the fold-change of the same gene set in a reference dataset comparing healthy and damage-associated microglia (Keren-Shaul et al., 2017). (H) Differentially expressed genes between wild-type and MHC II KO microglia plotted against a reference dataset of microglia spanning development, healthy adult status, aging, and neuroinjury (Hammond et al., 2019). Left: comparative expression in total microglia at each stage. Right: gene-level expression changes between the pre-natal and early post-natal period, paired t test. (I) BubbleGUM analysis using gene sets from differential expression in wild-type versus MHC II KO microglia (this manuscript) and E14.5 versus day 100 microglia (Hammond et al., 2019). Red for wild-type and day 100 microglia, blue for MHC II KO and E14.5 microglia. (J) The combined wild-type and MHC II KO microglia population were assessed for pseudotime trajectory, plotted separately for each genotype and showing branch points. (K) Brain CD4 T cell numbers were assessed in control wild-type mice, or wild-type mice treated with anti-CD4 depleting antibody from day 5 or week 3 of age (n = 15,14,13). (L) Microglia were sorted from control wild-type mice or anti-CD4 depleted mice. Expression of signature genes were assessed by qPCR, with data points reflecting 16 genes in 9–10 biological replicates. (M) Neonatal brain slices were left untreated or exposed to CD4 or CD8 T cells for 14 days prior to microglia sorting. Expression of signature genes was assessed by qPCR, with data points reflecting 16 genes in 2–3 biological replicates. (N) Neonatal microglia were cultured with control media, media from stimulated conventional or Tregs, or selected cytokines. Expression of signature genes were assessed by qPCR, with data points reflecting 10 genes in 2 biological replicates. See also Figure S6.
Figure S7
Figure S7
Microglial Density Morphology Diverges during Development between Wild-Type and MHC II-Deficient Mice, Related to Figure 7 Microglia structure and morphology were assessed in the brain of wild-type and MHC II-deficient mice at post-natal day 0 (striatum), day 7 and 15 weeks of age. (A) Representative 20 × view of confocal images of Iba1 immunostaining showing microglial density; scale = 50μm. (B) Quantification of microglia density at post-natal day 0, day 7 and 15 weeks (n = 4,2,2,5,4,4). (C) Representative 20 × view of confocal images Iba1 labeling (red) from the post-natal day 0 (striatum) and day 7 (cortex). Scale = 50μm, arrows indicate phagocytic microglia containing engulfed DAPI+ nucleus. (D) Quantification of microglia exhibiting phagocytotic buds (n = 4,2,2,5). (E) Representative 40 × images showing microglia morphology, process extensions and ramification at 15 weeks; scale = 50μm. (F) Quantification of the proportion of microglia with a maximum enclosing radius out to varying distances. Number of microglia analyzed: wild-type = 37; MHC II-deficient mice = 44 (n = 4,4). (G) Quantification of the total number of process intersections in microglia. (H) Sholl analysis of microglia process intersections per radii (spaced with the interval of 10 μm) from the soma. Dots represent each microglia, n = 8-10 microglia/mouse (n = 4,4). Fligner-Killeen non-parametric test for difference in variance. (I) MHC II-deficient mice and wild-type siblings were assessed for behavioral abnormalities. Time spent on the rod, average of 4 repeated tests of 300 s (n = 24,25). (J) Sociability test trials to monitor the interaction with a stranger mouse (S1) compared to a empty chamber (E1) (K) and the social preference for a new stranger (S2), with interaction with repeated stranger (S1) and new stranger (S2). (n = 24,23). (L) Freezing behavior over time during context acquisition conditioning (n = 13,14). (M) Marble burying test (n = 9,14). (N) Wild-type mice were housed under standard SPF conditions, or placed under behavioral modification in the form of isolated or environmental enrichment (n = 18, 15, 10). Mice were compared by high parameter flow cytometry of the blood and perfused brain. CD4 T cells as absolute numbers of conventional cells and Tregs in the brain. P value refers to comparison of conventional T cells. (O) Proportion of Foxp3+ cells within the CD4 T cell population in blood and brain. (P) tSNE of CD4+Foxp3- T cells gated on CD4+Foxp3-CD3+CD8-CD45+ cells or (Q) CD4+Foxp3+CD3+CD8-CD45+ cells and built on CD62L, CD44, CD103, CD69, CD25, PD-1, Nrp1, ICOS, KLRG1, ST2, Ki67, Helios, T-bet, CTLA4. P values represent cross-entropy comparison to control mice. FlowSOM clusters are illustrated in color. (R) Proportion of naive (top) and activated (bottom) cells within the conventional and (S) Treg populations in the blood and brain. Mean ± SEM.
Figure 7
Figure 7
Altered Neuronal Synapses and Behavior in MHC II KO (A) Wild-type and MHC II KO mice were assessed for neuronal synapses in cortical pyramidal neurons. Representative dendritic segments; scale, 5 μm. (B and C) Spine density in pyramidal neurons from (B) wild-type and MHC II KO mice, and (C) relative density of spine types (n = 4,6 mice, with 900–1,000 spines per condition). (D) Comparative change in spine density in MHC II KO mice (this study) versus disease models of Down syndrome (Belichenko et al., 2007), autism spectrum disorder (Zhou et al., 2016), schizophrenia (Zhou et al., 2016), Fragile X syndrome (FXS) (Liu et al., 2011), and Rett syndrome (Jiang et al., 2013). (E and F) Behavioral assessment of wild-type and MHC II KO mice. (E) Open field total distance moved and (F) time in the center (n = 23,24). (G) Latency to enter light zones in light-dark test (n = 22,20). (H) Time immobile during forced swim test (n = 12,14). (I) Nest building scoring (n = 35,21). (J) Contextual discrimination during generalization test (n = 13,14). (K–M) Spatial learning in the Morris water maze. (K) Path length to finding the hidden platform (n = 24,24), (L) probe tests after 5 days and (M) 10 days (n = 21,17). Mean ± SEM. See also Figure S7.

Comment in

References

    1. Attaai A., Neidert N., von Ehr A., Potru P.S., Zöller T., Spittau B. Postnatal maturation of microglia is associated with alternative activation and activated TGFβ signaling. Glia. 2018;66:1695–1708. - PubMed
    1. Baruch K., Rosenzweig N., Kertser A., Deczkowska A., Sharif A.M., Spinrad A., Tsitsou-Kampeli A., Sarel A., Cahalon L., Schwartz M. Breaking immune tolerance by targeting Foxp3(+) regulatory T cells mitigates Alzheimer’s disease pathology. Nat. Commun. 2015;6:7967. - PMC - PubMed
    1. Bechmann I., Galea I., Perry V.H. What is the blood-brain barrier (not)? Trends Immunol. 2007;28:5–11. - PubMed
    1. Belichenko P.V., Kleschevnikov A.M., Salehi A., Epstein C.J., Mobley W.C. Synaptic and cognitive abnormalities in mouse models of Down syndrome: exploring genotype-phenotype relationships. J. Comp. Neurol. 2007;504:329–345. - PubMed
    1. Benjamini Y., Hochberg Y. Controlling the False Discovery Rate - a Practical and Powerful Approach to Multiple Testing. J. R. Stat. Soc. B. 1995;57:289–300.

Publication types

MeSH terms