Review
. 2020 Sep 10;136(11):1250-1261.
doi: 10.1182/blood.2019000946.

Red cell membrane disorders: structure meets function

Affiliations
Review

Red cell membrane disorders: structure meets function

Mary Risinger et al. Blood. .

Abstract

The mature red blood cell (RBC) lacks a nucleus and organelles characteristic of most cells, but it is elegantly structured to perform the essential function of delivering oxygen and removing carbon dioxide from all other cells while enduring the shear stress imposed by navigating small vessels and sinusoids. Over the past several decades, the efforts of biochemists, cell and molecular biologists, and hematologists have provided an appreciation of the complexity of RBC membrane structure, while studies of the RBC membrane disorders have offered valuable insights into structure-function relationships. Within the last decade, advances in genetic testing and its increased availability have made it possible to substantially build upon this foundational knowledge. Although disorders of the RBC membrane due to altered structural organization or altered transport function are heterogeneous, they often present with common clinical findings of hemolytic anemia. However, they may require substantially different management depending on the underlying pathophysiology. Accurate diagnosis is essential to avoid emergence of complications or inappropriate interventions. We propose an algorithm for laboratory evaluation of patients presenting with symptoms and signs of hemolytic anemia with a focus on RBC membrane disorders. Here, we review the genotypic and phenotypic variability of the RBC membrane disorders in order to raise the index of suspicion and highlight the need for correct and timely diagnosis.


Conflict of interest statement

Conflict-of-interest disclosure: The authors declare no competing financial interests.

Figures

None
Graphical abstract
Figure 1.
Figure 1.
RBC membrane model depicting the structural proteins that, when abnormal, cause RBC membrane disorders. (A) Model of the RBC cytoskeleton quasihexagonal lattice forming a biconcave disc shape, supporting the lipid bilayer. An area of the cytoskeleton surface is shown “magnified” to demonstrate the arrangement of proteins within the hexagonal structure, focusing particularly on the proteins that, when defective, cause RBC membrane disorders. Illustration by Anastasios Manganaris (created using “blender” software, version 2.8). (B) α- and β-spectrin heterodimers associate head to head, as shown in the magnified circle, to form the spectrin tetramers that make the sides of each triangular unit in the hexagon. Each dimer head is composed of the N-terminal region of α-spectrin and the C-terminal region of β-spectrin. The junctional complex, at the corner of each triangle, is formed by an actin oligomer, with a length guided by tropomyosin, and capped by adducin and tropomodulin. Protein 4.1R enables the actin-spectrin association. The transmembrane protein complexes containing the integral membrane proteins band 3 and Rh-associated glycoprotein (RhAG) and the peripheral membrane proteins ankyrin and band 4.2 provide “vertical” linkages between the cytoskeleton and the lipid bilayer.
Figure 2.
Figure 2.
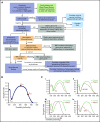
Evaluation workflow of patients with hemolytic anemia. (A) Proposed algorithm for the laboratory evaluation of a patient presenting with symptoms and signs of hemolysis. Of note, anemia may be well compensated, as in many cases of mild HS and most cases of PIEZO1-associated HX. Evaluation for autoimmune or, especially in an infant, alloimmune hemolytic anemia with direct and indirect antiglobulin test (DAT and IAT) is the first priority, since such a diagnosis typically requires immediate action. Consideration of the possibility of microangiopathic hemolytic anemia (MAHA) and paroxysmal nocturnal hemoglobinuria (PNH) may also be necessary. Blood smear review of the patient and parents, with attention to the RBC indices, including MCV, MCHC, and red blood cell distribution width (RDW), along with hemolytic markers (bilirubin, lactate dehydrogenase, and haptoglobin [the last one reliable after 6 months of life, since earlier, it may be low due to decreased production by the infant’s liver]), ferritin, and transferrin saturation to consider iron-loading inefficient erythropoiesis, can guide the differential diagnosis. Flow cytometry with eosin-5′-maleimide (EMA) binding of band 3 and Rh-related proteins is a rapid screening test for RBC membrane disorders that are characterized by membrane loss., Osmotic fragility is increased in HS and often decreased in HX. Osmotic gradient ektacytometry, which evaluates the deformability of RBCs as they are subjected to constant shear stress in a medium of increasing osmolality in a laser diffraction viscometer, is the reference technique for differential diagnosis of erythrocyte membrane and hydration disorders when a recent transfusion does not interfere with phenotypic evaluation of the patient.- When the patient is recently or chronically transfused, as it is typically the case in young children with congenital severe hemolytic anemia, options for phenotypic evaluation are limited. In such cases, genetic evaluation with clinically available next-generation sequencing panels may provide an accurate diagnosis necessary for appropriate management decisions.,, aHUS, atypical hemolytic uremic syndrome; HUS, hemolytic uremic syndrome; TTP, thrombotic thrombocytopenic purpura. (B) Osmotic gradient ektacytometry. The ektacytometry curve is determined by the RBC structural features. The points indicated in red are the following: Omin corresponds to the value of the hypotonic osmolality at which 50% of the cells hemolyze in an osmotic fragility assay and provides information on the initial surface to volume ratio of the RBCs. A shift to the right reflects a decrease in the surface area to volume ratio (ie, increased osmotic fragility). EImax corresponds to the maximum deformability of the RBC, and its value is affected by the cytoskeleton mechanics. The hypertonic descending part of the curve is represented by Ohyp, the osmolality value at which the cells’ average maximum diameter is half of EImax. The value of Ohyp correlates with the initial intracellular viscosity of the cell sample. A shift to the left reflects increased intracellular viscosity of the erythrocyte caused by increased intracellular concentration of hemoglobin, typically due to dehydration of the cell; a shift to the right may represent an overhydration state of the cell in overhydrated stomatocytosis or, most commonly, a decreased intracellular concentration of hemoglobin, such as in iron deficiency. (C) Typical osmotic gradient ektacytometry curves for various RBC membrane disorders (in red) in comparison with a normal control curve run concurrently (in green). (i) HS characterized by increased Omin and decreased EImax. (ii) HE/HPP characterized by decreased EImax and a trapezoid shape of the curve. (iii) HX with decreased Omin and decreased Ohyp. (iv) SAO with severely decreased deformability and decreased Omin.
Figure 3.
Figure 3.
HS. Examples of red cell morphology in HS due to different gene mutations and associated osmotic gradient ektacytometry curves. Spherocytes (ie, RBCs with no or decreased central pallor) predominate, but additional RBC morphology characteristics may provide hints to the gene/protein defect causing HS, as Palek and Sahr and Eber and Lux have described very astutely in the past. (A-E, left) Blood smear of a patient with AD ANK1-HS showing anisocytosis (A). Occasional mushroom-shaped red cells (arrows) are characteristic of HS due to deficiency of band 3 (SLC4A1) (B). Acanthocytes (arrowheads) and echinocytes (arrow) are noted along with spherocytes in SPTB-associated HS (C). Blood smear of a not-recently transfused patient with AR SPTA1-HS demonstrates remarkable anisocytosis and poikilocytosis with contracted dense cells (D). Ovalocytes (arrows) and few ovalostomatocytes (arrowheads) are noted in AR EPB42-HS (E). Nevertheless, the above described changes in RBC morphology are not always specific for the gene affected in HS. Scale bars, 14 µm; Wright-Giemsa stain. (A-E, right) The ektacytometry curve in HS is characterized by increased Omin, which corresponds to the increased osmotic fragility of the spherocytes. In almost all cases, decreased maximum deformability indicated by low EImax is also noted, as well as decreased Ohyp. The decrease in EImax tends to correlate with the degree of hemolysis and severity of anemia. (F) Important for differential diagnosis is that not all spherocytosis is hereditary. Autoimmune hemolytic anemia due to warm-reacting immunoglobulin G causes RBC membrane loss and acquired spherocytosis, with erythrocyte morphology and ektacytometry resembling HS. It is advisable to initiate the workup by first considering the possibility of an immune-mediated cause in every hemolytic anemia, since this radically alters management. In addition, blood smear and ektacytometry in congenital dyserythropoietic anemia type II also resemble HS; higher MCV, suboptimal reticulocytosis, and ferritin values disproportionally high for the number of transfusions will provide a clue to this possibility if bone marrow studies have not yet been performed. AIHA, autoimmune hemolytic anemia.
Figure 4.
Figure 4.
HE and HPP. The most common form of HPP, diagnosed in infants with neonatal hyperbilirubinemia, is due to an SPTA1 HE-causing mutation in trans to the intronic SPTA1 variant c.6531-12C>T known as αLELY (low-expression LYon). Familial studies at the time reveal that 1 parent carries the SPTA1 HE-causing mutation and has elliptocytosis (smear characterized by elliptically shaped red blood cells), while the other parent carries αLELY with a normal erythrocyte phenotype. The blood smear in HPP is characterized by marked anisocytosis and poikilocytosis with bizarre microcytes and fragmented cells along with elliptocytes (scale bars, 14 µm; Wright-Giemsa stain). HPP RBCs were found early on to have increased thermal sensitivity; this is maybe the source of the name pyro (coming from the Greek word “πυρ” meaning fire)-poikilocytosis. Another possibility for the origin of the term is that the cells resemble the morphology of the blood smear in patients with the microangiopathic hemolytic anemia of patients with extensive burns.
Figure 5.
Figure 5.
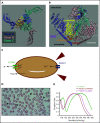
HX due to heterozygous PIEZO1 mutation. Human PIEZO1 is a 2521 amino acid (287 kDa) protein with ∼38 transmembrane helices. Cryoelectron microscopy studies of the highly homologous mouse Piezo1 reveal that PIEZO1 trimers form an elegant 3-bladed propeller structure with a curved transmembrane region creating an inverted membrane dome and a central ion pore formed by the C-terminal domains of the subunits, in which most of the disease-causing mutations are located.- This unique structure of PIEZO1 senses changes in membrane tension to alter gating of the ion channel., (A) Top view of the homotrimeric PIEZO1 channel showing its 3-bladed, propeller-like architecture (from the extracellular space looking down through the central pore). The 3 subunits of the trimer are color coded. (B) Side view of the homotrimeric PIEZO1 channel showing the curved transmembrane region, which creates a membrane dome., The position of the membrane is roughly indicated with white dotted lines. Two of the mutation “hot spot” areas described by Picard et al are highlighted in chain A (dark blue); the sequence p.R2456-P2510 in the pore domain (coded within exon 51) is colored orange, and one of the most common HX mutations in this region (p.R2456) is labeled in red; the sequence p.S1994-V2201 (coded within exons 42-45) is colored yellow, and one of the mutations in this area (p.L2023V) is indicated in magenta. A third hot-spot region for mutations is located N-terminally in exons 14 to 18; the structure of this area has not yet been modeled. Patients demonstrating a more severe phenotype are more likely to have mutations in the PIEZO1 pore domain. Images created using UCSF Chimera, with the Protein Data Bank structure model 3JAC. (C) Sketch of interaction between PIEZO1 and KCNN4 as RBCs travel through the vasculature. In narrow capillaries and sinusoids, mechanical stress (represented by the red arrowheads) results in activation of PIEZO1 and Ca2+ entry. Increased intracellular Ca2+ leads to activation of KCNN4 (a calcium ion binds to each of the 4 calmodulin molecules tightly bound to the cytoplasmic domains of the 4 KCNN4 subunits), and K+ efflux ensues. Subsequent water loss results in a temporary decrease in cell volume and facilitates passage.- (D) Blood smear from a patient heterozygous for p.R2456H with macrocytosis (MCV 96 fL) showing occasional stomatocytes (arrows), target cells (arrowheads), and dense cells (thin arrows). (E) Osmotic gradient ektacytometry showing the typical HX curve with left shift due to decreased Omin and Ohyp, indicating RBC dehydration. Ekatacytometry profiles are shown for 2 patients with HX due to PIEZO1 p.R2456H and p.L2023V.

References

    1. Lux SE, Palek J. Disorders of the red cell membrane. In: Handin RI, Stossel TP, eds. Blood: Principles and Practice of Hematology Lippincott: Philadelphia, PA; 19951701-1818.
    1. Mohandas N, Gallagher PG. Red cell membrane: past, present, and future. Blood. 2008;112(10):3939-3948. - PMC - PubMed
    1. Salomao M, Zhang X, Yang Y, et al. . Protein 4.1R-dependent multiprotein complex: new insights into the structural organization of the red blood cell membrane. Proc Natl Acad Sci USA. 2008;105(23):8026-8031. - PMC - PubMed
    1. Mohandas N, Evans E. Mechanical properties of the red cell membrane in relation to molecular structure and genetic defects. Annu Rev Biophys Biomol Struct. 1994;23(1):787-818. - PubMed
    1. Sung LA, Vera C. Protofilament and hexagon: a three-dimensional mechanical model for the junctional complex in the erythrocyte membrane skeleton. Ann Biomed Eng. 2003;31(11):1314-1326. - PubMed

Publication types

MeSH terms