Review
. 2020 Nov;40(11):2135-2151.
doi: 10.1177/0271678X20941263. Epub 2020 Jul 23.

Magnetic resonance assessment of the cerebral alterations associated with obesity development

Affiliations
Review

Magnetic resonance assessment of the cerebral alterations associated with obesity development

Blanca Lizarbe et al. J Cereb Blood Flow Metab. 2020 Nov.

Abstract

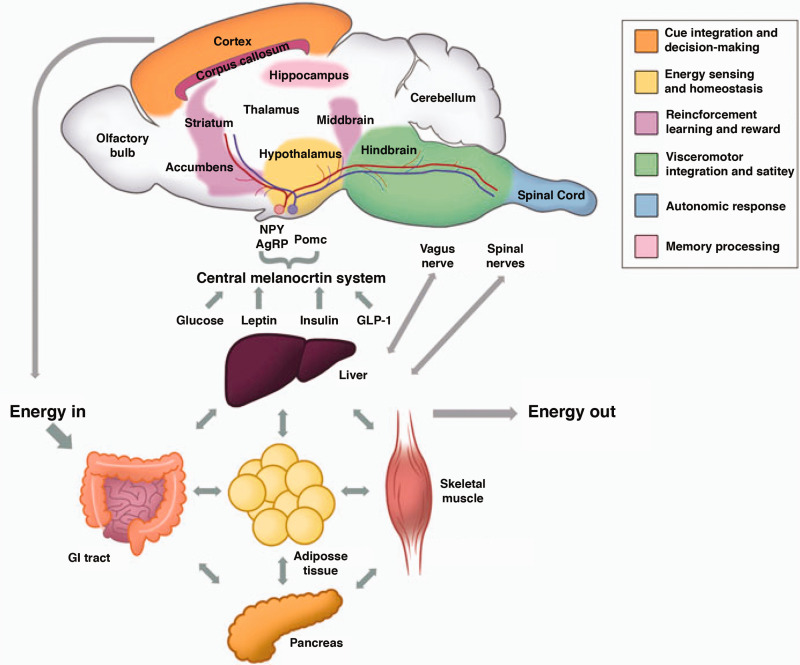
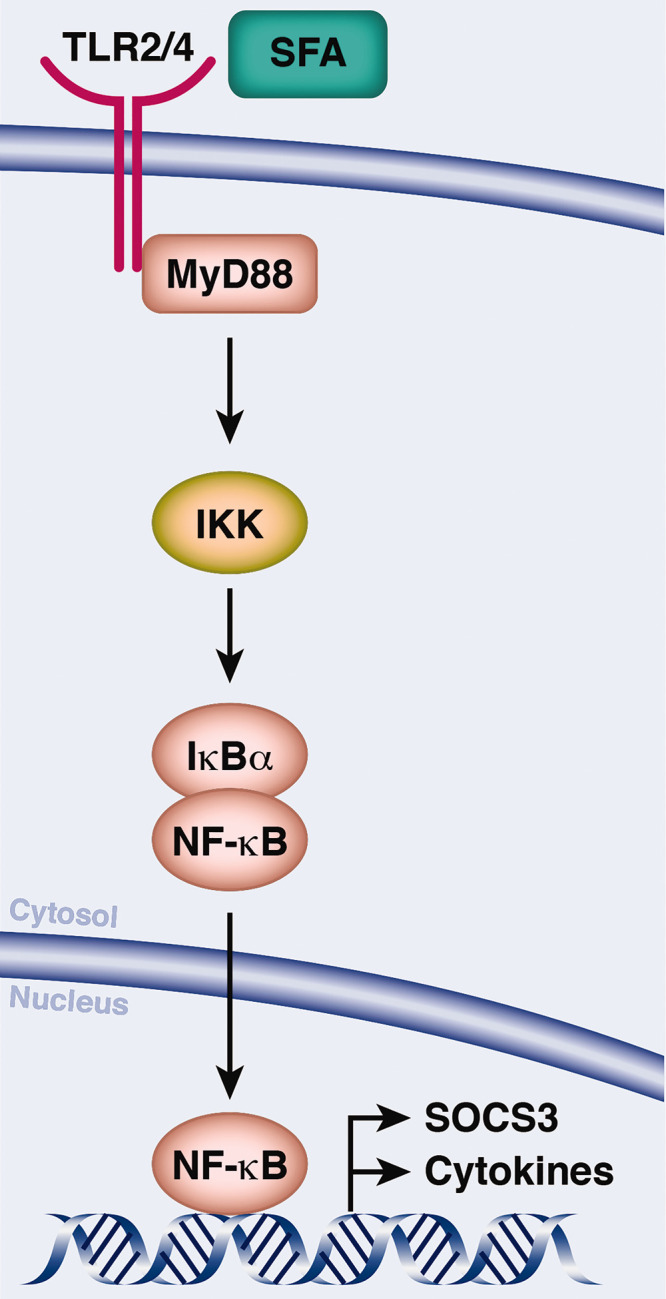
Obesity is a current threat to health care systems, affecting approximately 13% of the world's adult population, and over 18% children and adolescents. The rise of obesity is fuelled by inadequate life style habits, as consumption of diets rich in fats and sugars which promote, additionally, the development of associated comorbidities. Obesity results from a neuroendocrine imbalance in the cerebral mechanisms controlling food intake and energy expenditure, including the hypothalamus and the reward and motivational centres. Specifically, high-fat diets are known to trigger an early inflammatory response in the hypothalamus that precedes weight gain, is time-dependent, and eventually extends to the remaining appetite regulating regions in the brain. Multiple magnetic resonance imaging (MRI) and spectroscopy (MRS) methods are currently available to characterize different features of cerebral obesity, including diffusion weighted, T2 and volumetric imaging and 1H and 13C spectroscopic evaluations. In particular, consistent evidences have revealed increased water diffusivity and T2 values, decreased grey matter volumes, and altered metabolic profiles and fluxes, in the brain of animal models and in obese humans. This review provides an integrative interpretation of the physio-pathological processes associated with obesity development in the brain, and the MRI and MRS methods implemented to characterize them.

Keywords: High-fat feeding; hypothalamus; magnetic resonance imaging; magnetic resonance spectroscopy; neuro-inflammation; obesity.


Conflict of interest statement

The author(s) declared no potential conflicts of interest with respect to the research, authorship, and/or publication of this article.

Figures

Figure 1.
Figure 1.
Central and peripheral interactions regulating energy intake and expenditure. Appetite and energy expenditure are controlled by a complex feedback loop connecting endocrine signals from peripheral tissues with the brain. In the brain, the hypothalamus (yellow) senses these signals and regulates energy homeostasis. The hypothalamus is coupled to the cerebral circuitries encoding diverse behavioural mechanisms that influence food intake, such as motivational or hedonic feeding (blue and red traces). Motivational impulses are controlled by the mesocorticolimbic system (MCL), formed by the dopaminergic projections from the nucleus accumbens and ventral tegmental area (purple) to the prefrontal cortex (orange), hippocampus (pink) and basolateral amygdale. Hedonic or reward-based feeding circuitries are constituted by neuronal connections between the nucleus accumbens (purple), amygdala, and regions from the orbitofrontal cortex (orange). Adapted from Michaelides. Reproduced with permission from the publisher.
Figure 2.
Figure 2.
Saturated fatty acids (SFA) induce hypothalamic inflammation. SFAs bind to toll-like receptor 4 (TLR4) triggering the activation of inflammatory signalling cascades, with myeloid differentiation primary response 88 protein (MyD88) serving as a scaffold for downstream signalling molecules. NF-κB is sequestered in the cytoplasm by the inhibitor of NF-κB α (IκBα). Phosphorylation by the IKK complex leads to the release and nuclear translocations of NF-κB, binding to motifs in the promoter of the target gene SOCS3, a common inhibitor of insulin and leptin signalling and pro-inflammatory cytokines. Adapted from Jais and Bruning Reproduced with permission from the publisher.
Figure 3.
Figure 3.
High-fat diet induced cerebral alterations and underlying ADC changes. (a) Vasogenic edema. Top: Blood vessel’s endothelial tight junctions are disrupted by inflammatory reactions and oxidative stress following HFD feeding. Activated glial cells release vascular permeability and inflammatory mediators, that accelerate blood–brain barrier (BBB) hyper-permeability, result in fluid and albumin extravasation and accumulation in the extracellular space. Bottom: Dynamics of fluids (diffusion and bulk flow) through vascular, intra- and extracellular compartments under physiological conditions (left) or after HFD feeding (right). Bulk flow characterizes the vascular compartment (red), while diffusion occurs in the interstitial (yellow) and intracellular compartments (blue). Under HFDs, increased BBB permeability during vasogenic edema results in increased extracellular space and augmented ADC values. (b) Cellular alterations. Top: HFD induces the rapid appearance of activated microglia in the mediobasal hypothalamus. Middle: Long-term consumption of HFD has been also linked to neuronal apoptosis (arrows). Bottom: Highly cellular tissues with intact cell membranes restrict the movement of water molecules within intravascular, intracellular, and extracellular spaces (left). By contrast, less cellular tissues or damaged cells with defective cellular membranes increase the relative contribution of extracellular space, averaging faster water molecule displacements (right). In reactive gliosis, disruption of cell membranes, loss of myelin, or any process that alters the axon integrity would reduce the restrictions to water motion and increase the ADC. Panel A is redesigned and inspired from Michinaga and Koyama and Candelario-Jalil and Rosenberg and figures in Panel B are adapted from Valdearcos et al. and Moraes et al. All figures are reproduced with permission from the publishers.
Figure 4.
Figure 4.
Magnetic relaxation properties depend on tissue composition. Observed T1 and T2 values in tissues are the weighted average of the contributions from the different dynamic environments of water in the corresponding macromolecular suspensions. Water molecules trapped in the macromolecular interior contribute stability to the macromolecular structure, forming the “constitutive water”. Hydration water involves the inner and outer hydration shells. The inner hydration shell involves those water molecules in direct contact with or, in the closest layers, to the macromolecule. Together with constitutive water, these molecules experience directly cross-coupling interactions (electrostatic, hydrogen-bonding, or Van der Waals…) with the macromolecular core and surface. The outer hydration sphere is formed by those water molecules not in direct contact with the macromolecular surface, but experiencing its influence through weaker long-range interactions. Inner and outer hydration layers experience a rapid exchange of water molecules. Free water molecules are those, sufficiently far from the macromolecular structure, to avoid its influence, experiencing only hydrogen bond interactions with neighbouring water molecules. Mobile free fatty acids refer to protons of saturated or unsaturated fatty acid chains, with sufficient mobility to generate relatively narrow resonances. These may contain methyl and methylene resonances from fast tumbling triglyceride nanoparticles, long-chain saturated or unsaturated fatty acids or very small phospholipid nanovesicles. Their interaction with surrounding aqueous environments is weak, of the hydrophobic type.
Figure 5.
Figure 5.
HFD modifications of hypothalamic metabolism. (a) Metabolic profile of the mouse hypothalamus by 1H MRS in vivo before (baseline) and after four months of feeding with control (CD) (top) or high-fat diets (HFD) (bottom). After four months of controlled feeding, neurochemical quantification revealed that animals under CD had increased concentrations of Cr+PCr (blue peaks), while HFD showed augmented concentrations of Ins, Tau, Glc, Glu+Gln, NAA+NAAG and Cr+PCr (red peaks).(b) Metabolic fluxes after 10 weeks of HFD calculated from 13C MRS measurements in vivo. Left: Values of the metabolic fluxes after 10 weeks of diet diversification for CD fed mice (blue) and HFD animals (red), obtained by fitting their corresponding 13C enrichment turnover curves to a one-compartment model of hypothalamic metabolism. Stars represent statistical significance between fluxes (*p < 0.05, **0.005 and *** p < 0.001). Adapted from Lizarbe et al. with permission from the publisher. Ala: alanine, ASP: aspartate, PCho: phosphorylcholine; Cr: creatine; PCr: phosphoCreatine; Glc: glucose; Gln:glutamine; Glu: glutamate; Glx: glutamine + glutamate; Ins: myo-inositol; Lac:lactate; NAA: N-acetylaspartate; Tau: taurine; NAAG: N-Acetyl-aspartyl-glutamate; GPC: glycerolphosphorylcholin; FA: fatty acids; KB: ketone bodies; VPDH: pyruvate dehydrogenase complex flux; VTCA; tricarboxylic acid cycle flux; VGln: glutamate-glutamine cycle;VGABA: glutamate-GABA cycle flux;Vdil: dilution flux; Vx: transmitochondrial glutamate exchange flux; VPC: pyruvate carboxylase flux; Veff: glutamine efflux flux.

References

    1. Apovian CM.Obesity: definition, comorbidities, causes, and burden. Am J Manag Care 2016; 22: s176–185. - PubMed
    1. Frisardi V, Solfrizzi V, Seripa D, et al.. Metabolic-cognitive syndrome: a cross-talk between metabolic syndrome and Alzheimer's disease. Age Res Rev 2010; 9: 399–417. - PubMed
    1. Smith KB, Smith MS.Obesity statistics. Prim Care 2016; 43: 121–135, ix. - PubMed
    1. Flegal KM, Carroll MD, Ogden CL, et al.. Prevalence and trends in obesity among US adults, 1999–2008. JAMA 2010; 303: 235–241. - PubMed
    1. Wellen KE, Hotamisligil GS.Inflammation, stress, and diabetes. J Clin Invest 2005; 115: 1111–1119. - PMC - PubMed

Publication types

MeSH terms