. 2020 Jul 23;17(1):221.
doi: 10.1186/s12974-020-01892-4.

Three-dimensional morphometric analysis reveals time-dependent structural changes in microglia and astrocytes in the central amygdala and hypothalamic paraventricular nucleus of heart failure rats

Affiliations

Three-dimensional morphometric analysis reveals time-dependent structural changes in microglia and astrocytes in the central amygdala and hypothalamic paraventricular nucleus of heart failure rats

Ferdinand Althammer et al. J Neuroinflammation. .

Erratum in

Abstract

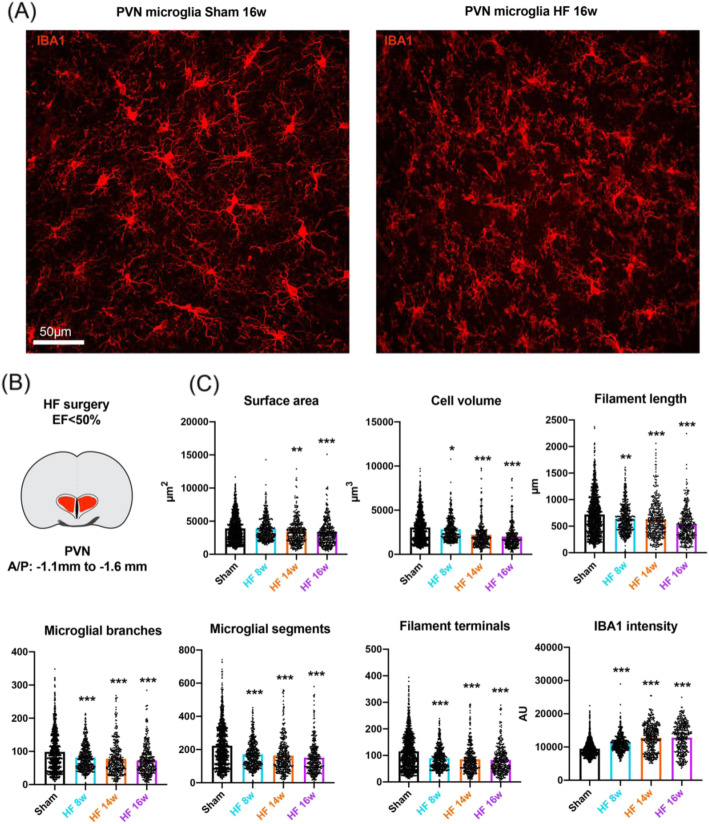
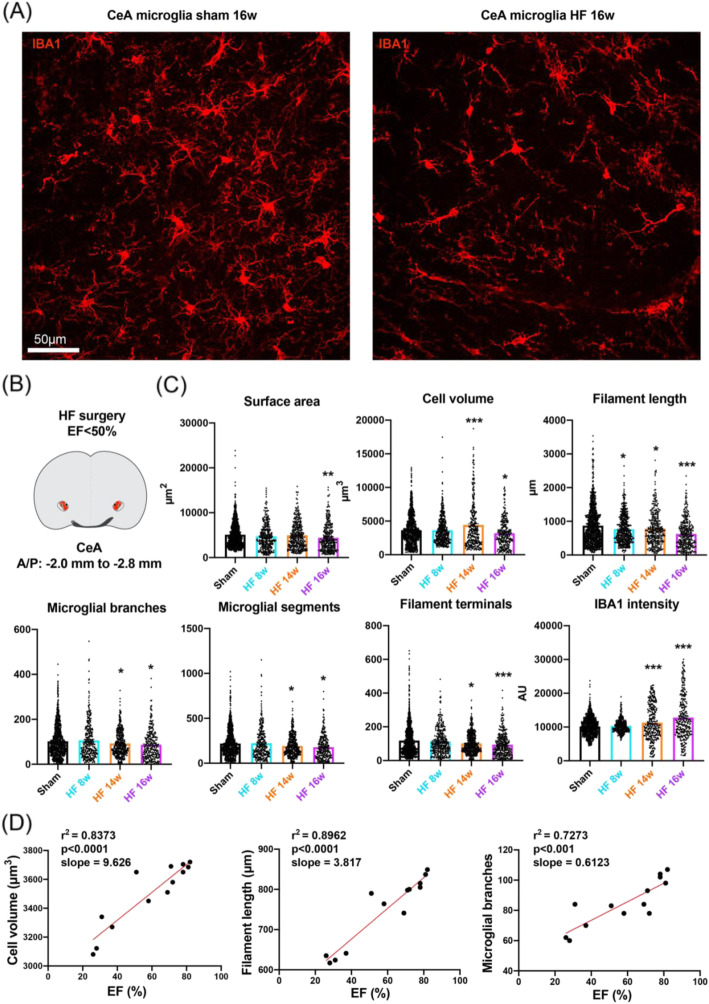
Background: Cardiovascular diseases, including heart failure, are the most common cause of death globally. Recent studies support a high degree of comorbidity between heart failure and cognitive and mood disorders resulting in memory loss, depression, and anxiety. While neuroinflammation in the hypothalamic paraventricular nucleus contributes to autonomic and cardiovascular dysregulation in heart failure, mechanisms underlying cognitive and mood disorders in this disease remain elusive. The goal of this study was to quantitatively assess markers of neuroinflammation (glial morphology, cytokines, and A1 astrocyte markers) in the central amygdala, a critical forebrain region involved in emotion and cognition, and to determine its time course and correlation to disease severity during the progression of heart failure.

Methods: We developed and implemented a comprehensive microglial/astrocyte profiler for precise three-dimensional morphometric analysis of individual microglia and astrocytes in specific brain nuclei at different time points during the progression of heart failure. To this end, we used a well-established ischemic heart failure rat model. Morphometric studies were complemented with quantification of various pro-inflammatory cytokines and A1/A2 astrocyte markers via qPCR.

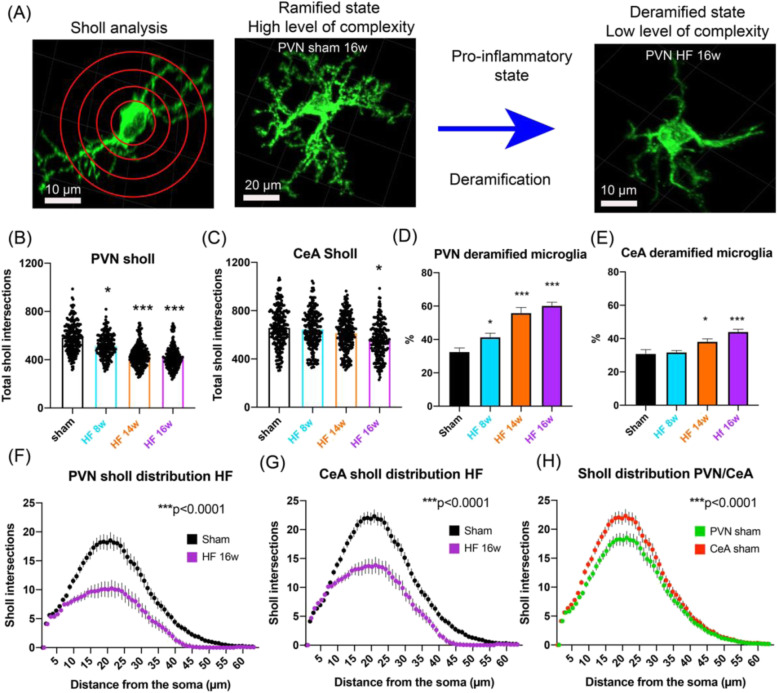
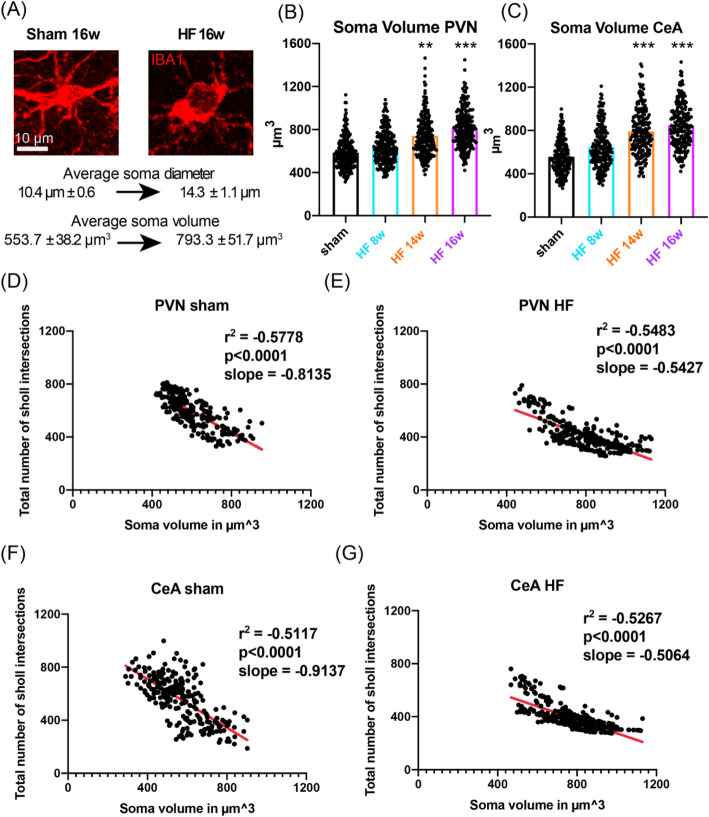
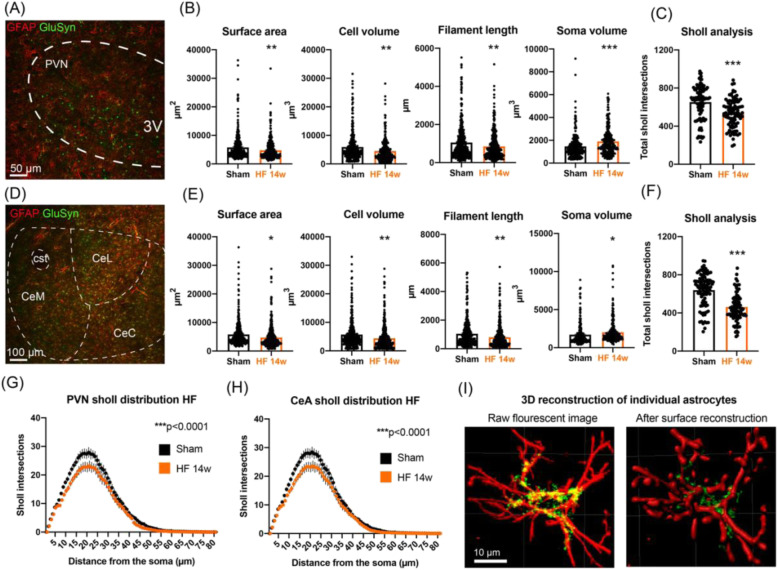
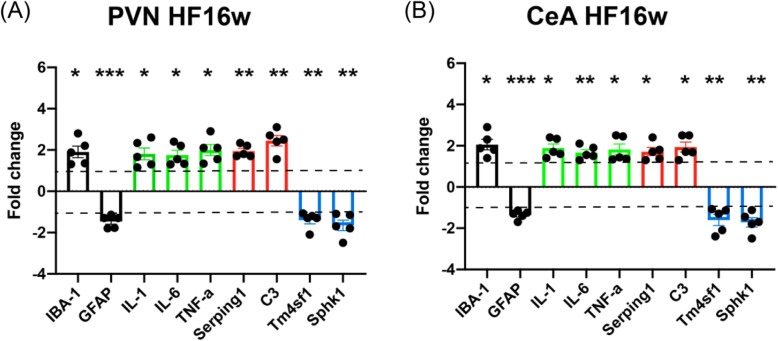
Results: We report structural remodeling of central amygdala microglia and astrocytes during heart failure that affected cell volume, surface area, filament length, and glial branches, resulting overall in somatic swelling and deramification, indicative of a change in glial state. These changes occurred in a time-dependent manner, correlated with the severity of heart failure, and were delayed compared to changes in the hypothalamic paraventricular nucleus. Morphometric changes correlated with elevated mRNA levels of pro-inflammatory cytokines and markers of reactive A1-type astrocytes in the paraventricular nucleus and central amygdala during heart failure.

Conclusion: We provide evidence that in addition to the previously described hypothalamic neuroinflammation implicated in sympathohumoral activation during heart failure, microglia, and astrocytes within the central amygdala also undergo structural remodeling indicative of glial shifts towards pro-inflammatory phenotypes. Thus, our studies suggest that neuroinflammation in the amygdala stands as a novel pathophysiological mechanism and potential therapeutic target that could be associated with emotional and cognitive deficits commonly observed at later stages during the course of heart failure.

Keywords: A1; Amygdala; Astrocytes; Autonomic; Behavior; Cytokines; Heart failure; Hypothalamus; Microglia; Neuroinflammation.


Conflict of interest statement

The authors declare that they have no competing interests.

Figures

Fig. 1
Fig. 1
HF-induced morphometric changes in PVN microglia. a Representative confocal images show IBA1-stained microglia in the PVN of HF and sham rats 16 weeks post-surgery. b Brain scheme shows the topographic location of PVN microglia that have been used for the morphometric assessment. The red area within the PVN (heart-shaped nucleus) highlights the fraction of the nucleus where pictures were taken. c Dot-plot graphs show the individual values of PVN microglia for surface area, cell volume, filament length, microglial branches, microglial segments, filament terminals, and IBA 1 intensity for sham rats (N = 1135 cells from 12 rats, pooled) and HF rats at 8, 14, and 16 weeks post-surgery (N = 378 cells from 4 rats, N = 407 cells from 4 rats and N = 399 cells from 4 rats, respectively). *p < 0.05, **p < 0.01, and ***p < 0.0001 vs. respective sham, one-way ANOVA followed by Tukey’s post hoc test
Fig. 2
Fig. 2
HF-induced morphometric changes in CeA microglia. a Representative confocal images show IBA1-stained microglia in the PVN of HF and sham rats 16 weeks post-surgery. b Brain scheme shows the topographic location of CeA microglia that have been used for the morphometric assessment. The red dotted line highlights the CeA. c Dot-plot graphs show the individual values of CeA microglia for surface area, cell volume, filament length, microglial branches, microglial segments, filament terminals, and IBA 1 intensity for sham rats (N = 1070 cells from 12 rats, pooled) and HF rats at 8, 14, and 16 weeks post-surgery (N = 363 cells from 4 rats, N = 355 cells from 4 rats and N = 332 cells from 4 rats, respectively). *p < 0.05, **p < 0.01, and ***p < 0.0001 vs. respective sham, one-way ANOVA followed by Tukey’s post hoc test. d Plot graphs depicting cell volume, filament length, and number of microglial branches as a function of %EF values combining sham (n = 4), HF rats (EF < 50%, n = 4) and mild HF rats (EF > 50%, n = 5). R2 and p values were obtained following a Pearson correlation analysis
Fig. 3
Fig. 3
HF-induced deramification and increased the proportion of pro-inflammatory microglia in the PVN and CeA. a Scheme depicts the HF-induced transition from ramified to deramified microglia. Red circles depict superimposed spheres centered around microglia somata used for Sholl analysis. b, c Bar graphs show the mean number of total of Sholl intersections for PVN and CeA microglia in sham rats (n = 12, pooled) and HF rats at 8, 14, and 16 weeks post-surgery (n = 4/group). d, e Bar graphs show the mean proportion of deramified microglia in the PVN and CeA in sham rats (n = 12, pooled) and HF rats at 8, 14, and 16 weeks post-surgery (n = 4/group). f, g Mean distribution plots of the number of Sholl intersections as a function of the distance from the microglial soma for sham and HF rats 16 weeks post-surgery (n = 4/group). h Distribution plot comparing Sholl intersections as a function of the distance from the microglial soma for PVN and CeA microglia (n = 12/group, pooled). *p < 0.05, **p < 0.01, and ***p < 0.0001 vs. respective sham, two-way ANOVA, or one-way ANOVA followed by Tukey’s post hoc test
Fig. 4
Fig. 4
HF-induced somatic swelling of PVN and CeA microglia is correlated with microglial deramification. a Confocal images show a representative example of HF-induced microglial swelling. b, c Bar graphs show the mean microglia somata volume in the PVN and CeA in sham rats (n = 12, pooled) and HF rats at 8, 14, and 16 weeks post-surgery (n = 4/group). dg Plots showing the total number of Sholl intersections as a function of soma volume for individual microglial cells in the PVN of sham (d) and HF (e) rats and in the CeA of sham (f) and HF (g) rats. Red lines represent best-fit lines assuming a non-linear relationship between the total number of Sholl intersections and soma volume. **p < 0.01 and ***p < 0.0001 vs. respective sham, one-way ANOVA followed by Tukey’s post hoc test or Pearson correlation
Fig 5
Fig 5
HF-induced morphometric changes in PVN and CeA astrocytes. a Representative confocal image showing PVN astrocytes in a sham rat stained with GFAP (red) and GluSyn (green). b Dot-plot graphs show the individual values of PVN microglia for surface area, cell volume, filament length, and IBA1 intensity in sham (n = 4) and HF rats 14 weeks post-surgery (n = 4). c Bar graph shows the mean number of total sholl intersections in PVN astrocytes in sham (n = 4) and HF rats 14 weeks post-surgery (n = 4). d Representative confocal image showing CeA astrocytes stained with GFAP (red) and GluSyn (green) in a sham rat. e Dot-plot graph show the individual values of CeA microglia for surface area, cell volume, filament length, and IBA1 intensity in sham (n = 4) and HF rats 14 weeks post-surgery (n = 4). f Bar graph shows the mean number of total Sholl intersections in CeA astrocytes in sham (n = 4) and HF rats 14 weeks post-surgery (n = 4). g, h Mean distribution plots of the number of Sholl intersections as a function of the distance from the microglial soma for sham and HF rats 14 weeks post-surgery (n = 4/group). i Confocal images show a single PVN astrocyte from a sham animal before and after surface reconstruction with IMARIS. *p < 0.05, **p < 0.01, and ***p < 0.0001 vs. respective sham, Student’s t test, or two-way ANOVA
Fig. 6
Fig. 6
HF-induced changes in neuroinflammation-associated microglia and astrocyte marker mRNA. a Bar graphs show the mean fold change in mRNA transcript levels in HF rats compared to sham rats in the PVN (a) and the CeA (b). All graphs depict the fold changes of mRNA levels in HF group compared to their respective shams. Green bars: cytokines, red bars: a1 astrocyte markers, blue bars: a2 astrocyte markers. Dashed lines indicate the hypothetical mean (+ 1/− 1) for the one-sample t test. Each dot represents an individual animal in the respective group. *p < 0.05, **p < 0.01, and ***p < 0.0001 vs. respective controls, one sample t test

References

    1. Group WCRCW World Health Organization cardiovascular disease risk charts: revised models to estimate risk in 21 global regions. Lancet Glob Health. 2019;7(10):e1332–e1e45. - PMC - PubMed
    1. Beemath A, Stein PD, Skaf E, Al Sibae MR, Alesh I. Risk of venous thromboembolism in patients hospitalized with heart failure. Am J Cardiol. 2006;98(6):793–795. - PubMed
    1. Mbakwem A, Aina F, Amadi C. Expert Opinion-Depression in Patients with Heart Failure: Is Enough Being Done? Card Fail Rev. 2016;2(2):110–112. - PMC - PubMed
    1. Parissis JT, Fountoulaki K, Paraskevaidis I, Kremastinos D. Depression in chronic heart failure: novel pathophysiological mechanisms and therapeutic approaches. Expert Opin Investig Drugs. 2005;14(5):567–577. - PubMed
    1. Rustad JK, Stern TA, Hebert KA, Musselman DL. Diagnosis and treatment of depression in patients with congestive heart failure: a review of the literature. Prim Care Companion CNS Disord. 2013;15(4). - PMC - PubMed