. 2020 Nov;10(11):1690-1705.
doi: 10.1158/2159-8290.CD-19-1472. Epub 2020 Jul 23.

Exploiting the Therapeutic Interaction of WNT Pathway Activation and Asparaginase for Colorectal Cancer Therapy

Affiliations

Exploiting the Therapeutic Interaction of WNT Pathway Activation and Asparaginase for Colorectal Cancer Therapy

Laura Hinze et al. Cancer Discov. 2020 Nov.

Abstract

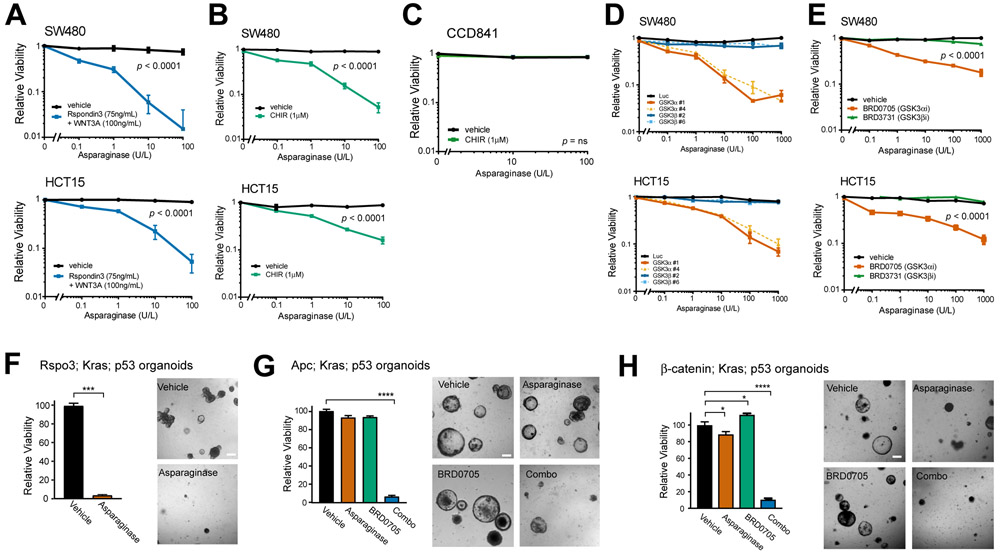
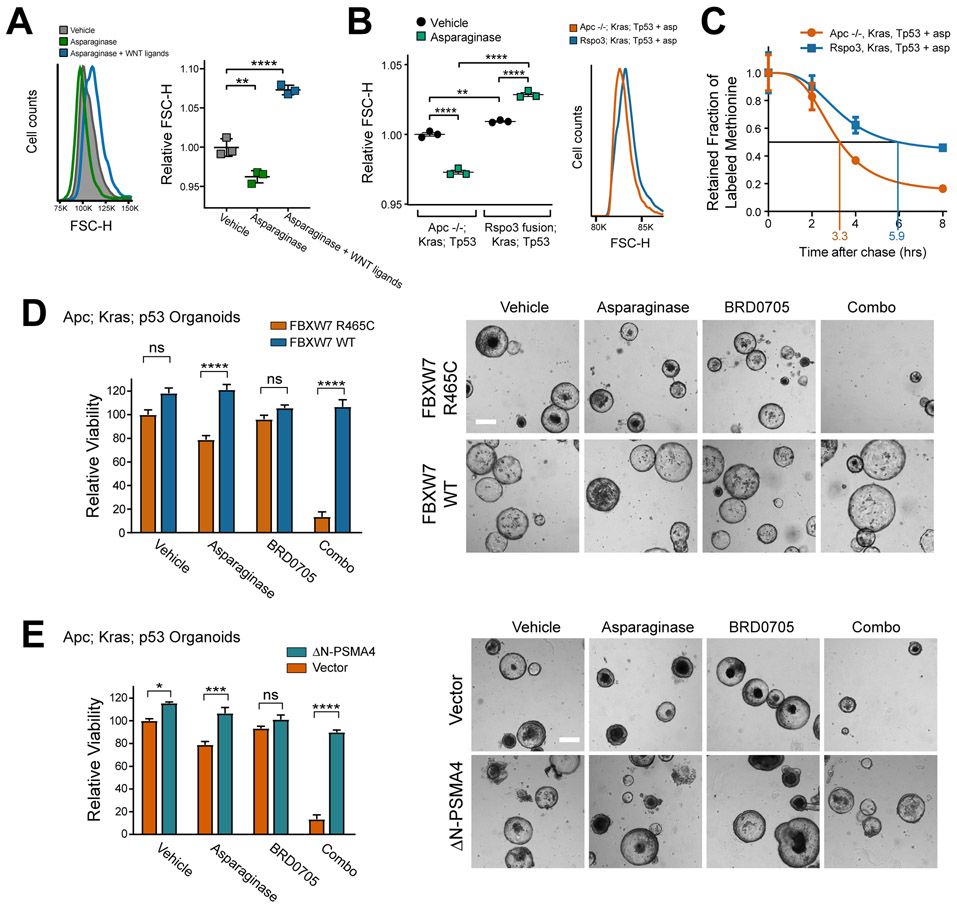
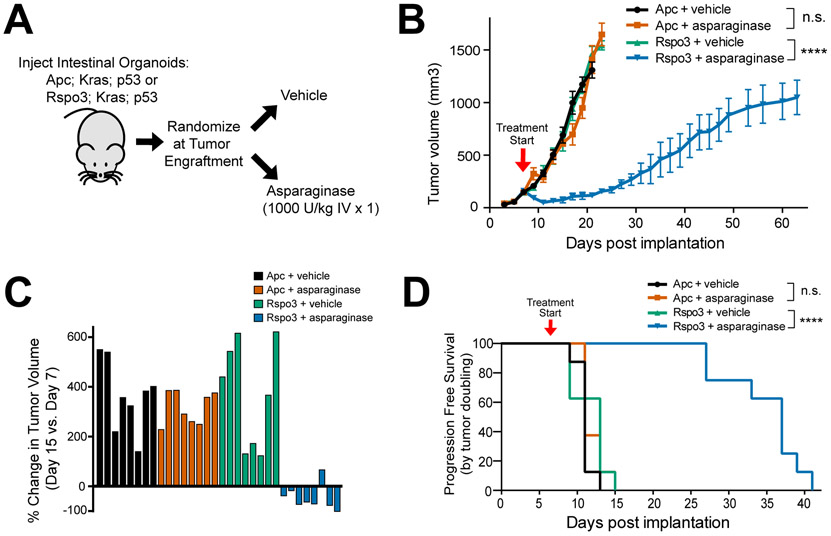
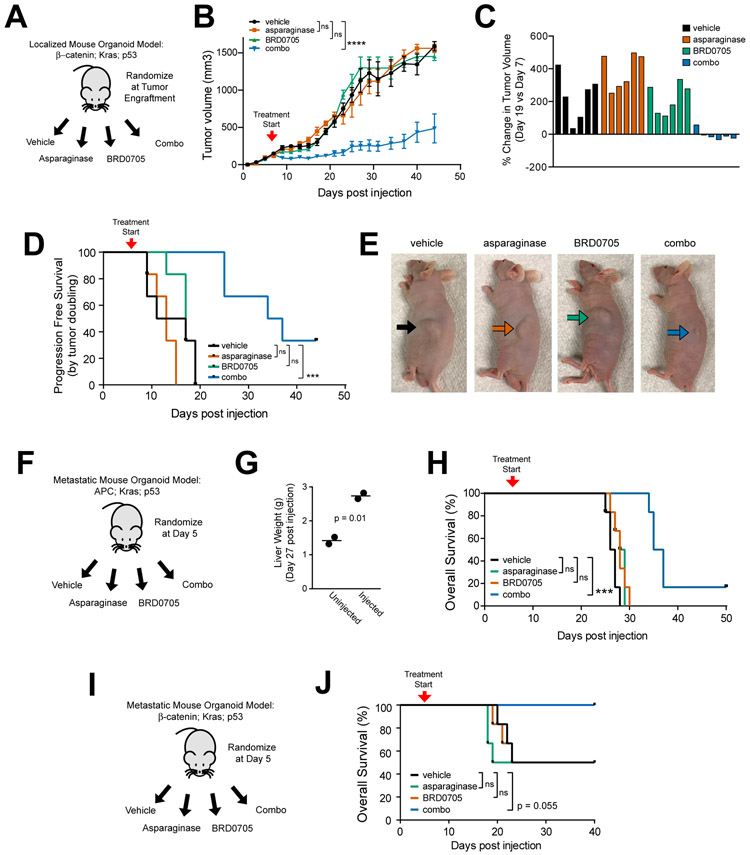
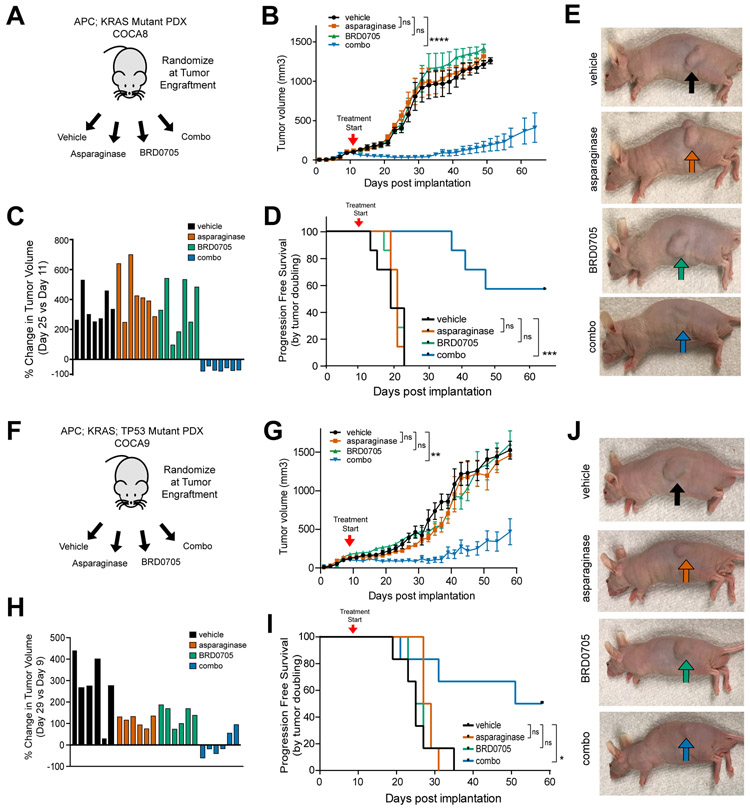
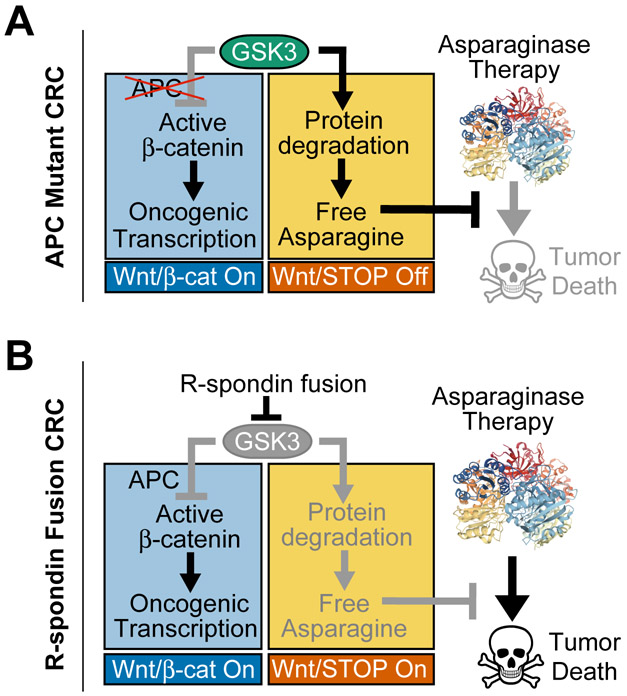
Colorectal cancer is driven by mutations that activate canonical WNT/β-catenin signaling, but inhibiting WNT has significant on-target toxicity, and there are no approved therapies targeting dominant oncogenic drivers. We recently found that activating a β-catenin-independent branch of WNT signaling that inhibits GSK3-dependent protein degradation induces asparaginase sensitivity in drug-resistant leukemias. To test predictions from our model, we turned to colorectal cancer because these cancers can have WNT-activating mutations that function either upstream (i.e., R-spondin fusions) or downstream (APC or β-catenin mutations) of GSK3, thus allowing WNT/β-catenin and WNT-induced asparaginase sensitivity to be unlinked genetically. We found that asparaginase had little efficacy in APC or β-catenin-mutant colorectal cancer, but was profoundly toxic in the setting of R-spondin fusions. Pharmacologic GSK3α inhibition was sufficient for asparaginase sensitization in APC or β-catenin-mutant colorectal cancer, but not in normal intestinal progenitors. Our findings demonstrate that WNT-induced therapeutic vulnerabilities can be exploited for colorectal cancer therapy. SIGNIFICANCE: Solid tumors are thought to be asparaginase-resistant via de novo asparagine synthesis. In leukemia, GSK3α-dependent protein degradation, a catabolic amino acid source, mediates asparaginase resistance. We found that asparaginase is profoundly toxic to colorectal cancers with WNT-activating mutations that inhibit GSK3. Aberrant WNT activation can provide a therapeutic vulnerability in colorectal cancer.See related commentary by Davidsen and Sullivan, p. 1632.This article is highlighted in the In This Issue feature, p. 1611.


Figures

Figure 1.
Figure 1.. Activation of WNT signaling upstream of GSK3 induces asparaginase hypersensitivity.
A, SW480 and HCT15 cells were treated with the indicated doses of asparaginase for 10 days, in the presence of recombinant Rspondin3 (75 ng/ml) and WNT3a (100 ng/ml) or vehicle. The number of viable cells was counted by trypan blue vital dye staining, and all cell counts were normalized to those in vehicle-treated cells (no asparaginase, Rspo3 or WNT3a). Two-way ANOVA was performed for each cell line and included interaction terms between asparaginase doses and WNT ligands. The p value for the main effect of WNT ligands vs. vehicle is presented in each plot and the interaction terms were overall significant (p < 0.0001). B, SW480 and HCT15 cells were treated with the GSK3 inhibitor CHIR99021 (CHIR, 1μM) or vehicle, together with the indicated doses of asparaginase for 10 days. Viability was assessed as in (A). Statistical significance was calculated using a two-way ANOVA and included interaction terms between asparaginase doses and GSK3 inhibitor. The p value for the main effect of WNT ligands vs. vehicle is presented in each plot and the interaction terms were significant (p < 0.0001). C, CCD841 cells derived from normal human colonic epithelium were treated with CHIR99021 (1 μM) or vehicle, together with the indicated doses of asparaginase for 10 days, and viable cell counts were assessed as described in (A). Two-way ANOVA was performed for each cell line and included interaction terms between asparaginase dose and GSK3 inhibitor. The interaction terms were not significant (p = ns). D, SW480 and HCT15 cells were transduced with the indicated shRNAs and then treated with the indicated doses of asparaginase. Viability was assessed after 10 days of treatment by counting viable cells. All cell counts were normalized to those in shLuc-transduced, vehicle-treated controls. E, The indicated cell lines were treated with vehicle, the GSK3α-selective inhibitor BRD0705 (1 μM), or the GSK3β-selective inhibitor BRD3731 (1 μM), in the presence of the indicated doses of asparaginase for 10 days. Viability was assessed as in (A). Two-way ANOVA was performed and included interaction terms between asparaginase dose and type of GSK3 inhibitor type. The p value for the main effect of GSK3 inhibitor type is presented. F, Mouse intestinal organoids expressing an endogenous Rspo3 fusion in addition to p53 loss-of-function and an activating KrasG12D mutations were cultured in basal medium (which lacks WNT/R-spondin supplementation) and treated with vehicle or asparaginase (100 U/L) for 10 days. Viability was assessed by counting viable organoids using an Axio Imager A1 microscope. Images were taken from a representative of three experiments, and statistical significance was calculated using a two-sided Welch t-test. Scale bar, 100 μm. G, Apc-deficient organoids with mutations of p53 and Kras were cultured in basal medium and treated with vehicle, asparaginase (100 U/L), BRD0705 (1 μM) or combo (100 U/L asparaginase + 1 μM BRD0705) for 10 days. Viability was assessed as in (F). Images were taken from a representative of three experiment. Scale bar, 100 μm. Differences between groups were analyzed using a one-way ANOVA with Dunnett’s adjustment for multiple comparisons, using the vehicle group as the reference group. H, Organoids with a β-catenin activating mutation, as well as Kras and p53 mutations, were cultured in basal medium, treated and analyzed as in (G).
Figure 2.
Figure 2.. WNT-induced sensitization to asparaginase is mediated by WNT/STOP
A, HCT15 cells were treated with vehicle or asparaginase (100 U/L) together with human RSpondin3 (75 ng/ml) and WNT3A protein (100 ng/ml) (referred to collectively as WNT ligands here) for 10 days. Cell size was assessed by forward scatter height (FSC-H) by flow cytometry (left). Scatter plot depicts results of individual biologic replicates, with horizontal bars indicating mean, and error bars indicating SEM (right). Differences between groups were analyzed using a one-way ANOVA with Dunnett’s adjustment for multiple comparisons. B, Mouse intestinal organoids of the indicated genotypes were treated with vehicle or asparaginase (100 U/L), and cell size was assessed by forward scatter height (FSC-H) by flow cytometry on a BD FACS DIVA instrument. Scatter plots (left) depict results of individual biologic replicates, with horizontal bars indicating mean, and error bars indicating SEM. Differences between groups were assessed by two-sided ANOVA with Tukey adjustment for multiple comparisons. Histograms (right) show results from a representative organoid of the indicated genotype treated with asparaginase. C, Mouse intestinal organoids of the indicated genotypes were incubated with a pulse of the methionine analog 5-azidohomoalanine (AHA) for 18 hrs. Organoids were then released from AHA and treated with asparaginase (100 U/L) during the chase period. The degree of AHA label retention was assessed by flow cytometry at the indicated timepoints. Results are normalized to time 0 for each condition. See also Supplementary Fig. S2. Error bars indicate SEM. D, Apc deficient; Kras; p53 organoids were cultured in basal medium, transduced with the indicated constructs and treated with vehicle, asparaginase (100 U/L), BRD0705 (1 μM) or combo (100 U/L asparaginase + 1 μM BRD0705) for 10 days. Viability was assessed as in (1G). Images were taken from a representative of three experiments. Scale bar, 100 μm. Differences between groups were analyzed using a one-way ANOVA with Tukey adjustment for multiple comparisons. E, Apc deficient; Kras; p53 organoids were cultured in basal medium, transduced with the indicated constructs and treated with vehicle, asparaginase (100 U/L), BRD0705 (1 μM) or combo (100 U/L asparaginase + 1 μM BRD0705) for 10 days. Viability was assessed as in (1G). Images were taken from a representative of three experiments. Scale bar, 100 μm. Differences between groups were analyzed using a one-way ANOVA with Tukey adjustment for multiple comparisons. * p ≤ 0.05; ** p ≤ 0.01; *** p ≤ 0.001, **** p ≤ 0.0001, n.s., p > 0.05. All error bars represent SEM.
Figure 3.
Figure 3.. Therapeutic Activity of Asparaginase in CRCs with Upstream WNT Pathway Mutations.
A, Experimental schema. Triple-mutant mouse intestinal organoids with mutations of p53, Kras, and either an Rspo3 fusion or Apc deficiency were injected subcutaneously into male nude mice (n=8 per group). Once tumor engraftment was confirmed (>100 mm3 tumor volume), mice were randomized into groups and treated with vehicle or asparaginase (1,000 U/Kg x 1 dose). B, Tumor volumes of mice injected with intestinal organoids in the experiment shown in (A). Treatment start is denoted by the arrowhead on the graph and tumor volumes were assessed every other day by caliper measurements. Significance was assessed by two-way ANOVA with Tukey adjustment for multiple comparisons, for tumor volume on day 15. Error bars represent SEM. **** p ≤ 0.0001. n.s., p > 0.05. C, Waterfall plots of % change in tumor volume at post-implantation day 15 versus the pre-treatment measurement on day 7 from the experiment shown in (A); each bar represents an individual mouse. D, Kaplan-Meier progression-free survival analysis of mice injected with indicated organoids and treated with vehicle or asparaginase from the experiment shown in (A). Progression-free survival was defined by time to death or doubling of tumor volume. Significance was assessed by log rank test. **** p ≤ 0.0001. n.s., p > 0.05.
Figure 4.
Figure 4.. GSK3α Inhibition and Asparaginase for CRCs with APC or β-catenin Mutations
A, Experimental schema. Triple-mutant mouse intestinal organoids with an activating β-catenin mutation, together with mutations of Kras and p53, were injected subcutaneously into male nude mice (n=6 per group). Once tumor engraftment was confirmed (>100 mm3 tumor volume), mice were randomized and treated with vehicle, asparaginase 1000 U/Kg x 1 dose, BRD0705 15 mg/kg every 12 hours x 21 days or both asparaginase and BRD0705 in combination (combo). B, Tumor volumes of mice with β-catenin; Kras; p53 mutant tumors treated as in (A). Treatment start is denoted by the arrowhead on the graph. Significance was assessed by two-way ANOVA with Tukey adjustment for multiple comparisons, for tumor volume on day 19. Error bars represent SEM. **** p ≤ 0.0001. n.s., p > 0.05. C, Waterfall plots showing % change in tumor volume over the first 14 days of treatment. Each bar represents an individual mouse. D, Kaplan-Meier progression-free survival analysis of mice injected with indicated organoids and treated with vehicle or asparaginase from the experiment shown in (A). Progression-free survival was defined by time to death or doubling of tumor volume. Significance was assessed by log rank test. *** p ≤ 0.001. n.s., p > 0.05. E, Representative images of anesthetized mice taken on day 14 post treatment from the experiment shown in (A). Arrows point to the location of the subcutaneous tumor. F, Design of the experiment testing therapeutic activity in a liver-metastatic model of Apc; Kras; p53 triple-mutant mouse intestinal organoids. Treatment began on day 5 post-injection, and was performed as described in (A). G, Liver weights of mice harvested to assess metastatic burden to the liver. Each data point represents an individual mouse. Significance was assessed by a two-sided Welch t-test. H, Kaplan-Meier analysis of overall survival from mice in the experiment shown in (F) (n = 6 mice per group). Significance was assessed by log-rank test. *** p ≤ 0.001., *p ≤ 0.05 n.s., p > 0.05. I, Design of the experiment testing therapeutic activity in a liver-metastatic model of β-catenin; Kras; p53 triple-mutant mouse intestinal organoids. Treatment began on day 5 post-injection, and was performed as described in (A). J, Kaplan-Meier analysis of overall survival from mice in the experiment shown in (I) (n = 6 mice per group). Significance was assessed by log-rank test. *** p ≤ 0.001., *p ≤ 0.05 n.s., p > 0.05.
Figure 5.
Figure 5.. Activity of GSK3α Inhibition and Asparaginase in APC-Mutant Patient-Derived Xenografts of CRCs
A, Experimental schema. A human CRC PDX harboring a biallelic APC mutation was implanted subcutaneously into male nude mice (n=7 per group). Mice were treated at the time of tumor engraftment (>100 mm3) with vehicle, asparaginase 1000 U/Kg x 1 dose, BRD0705 15 mg/kg every 12 hours x 21 days or both asparaginase and BRD0705 in combination (combo). B, Tumor volumes of mice implanted with the human CRC PDX in the experiment shown in (A). Arrowhead denotes treatment start. Tumor volumes were assessed every other day by caliper measurements. Significance was assessed by two-way ANOVA comparing tumor volumes on day 25, with Tukey adjustment for multiple comparison testing. Error bars represent SEM. *** p ≤ 0.001; n.s., p > 0.05. C, Waterfall plot of % change in tumor volume at post-implantation day 25 versus the pre-treatment measurement on day 11 from the experiment shown in (A); each bar represents an individual mouse. D, Kaplan-Meier progression-free survival curve of mice treated with asparaginase, BRD0705 or combo. Significance was assessed by log rank test. *** p ≤ 0.001; n.s., p > 0.05. E, Representative images of mice implanted with the APC-mutant CRC PDX from the experiment shown in (A). Images were taken 30 days post treatment from mice anesthetized with isoflurane. F, Experimental design using a distinct PDX model, COCA9, harboring a monoallelic APC mutation. Randomization and treatment were performed as in (A). G, Tumor volumes of mice from the experiment depicted in (F). Arrowhead denotes treatment start. Tumor volumes were assessed every other day by caliper measurements. Significance was assessed by two-way ANOVA comparing tumor volumes on day 25, with Tukey adjustment for multiple comparison testing. Error bars represent SEM. ** p ≤ 0.01; n.s., p > 0.05. H, Waterfall plots of % change in tumor volume at post-implantation day 29 versus day 9. Each bar represents an individual mouse. I, Kaplan-Meier progression-free survival curve of mice from the experiment shown in (F). Significance was assessed via log-rank test. J, Representative images of mice implanted with the APC-mutant CRC PDX from the experiment shown in (F). Images were taken 30 days post treatment from mice anesthetized with isoflurane.
Figure 6.
Figure 6.. Model for Therapeutic Interaction of WNT Pathway Activation and Asparaginase.
A, Our model is that APC mutations selectively activate the β-catenin branch of WNT signaling downstream of GSK3. Thus, the ability of GSK3 to phosphorylate a large number of cellular proteins, leading to their ubiquitination and degradation, is unperturbed (WNT/STOP off). This degradation serves as a catabolic source of free asparagine, which prevents asparaginase-induced tumor death. Asparaginase structure is from PDB: 2HIM. B, In R-spondin fusion CRC, WNT signaling is activated upstream of GSK3, which results in activation of both the WNT/β-catenin and the WNT-dependent stabilization of proteins (WNT/STOP) branches of this pathway. Activation of WNT/STOP inhibits protein degradation, limiting cellular asparagine availability, and triggering a unique vulnerability to its enzymatic degradation by asparaginase. Thus, asparaginase therapy induces tumor death in R-spondin fusion CRC. In APC-mutant CRC, selective inhibition of GSK3α phenocopies this effect.

Comment in

References

    1. Siegel RL, Miller KD, Jemal A. Cancer statistics, 2019. CA Cancer J Clin 2019;69(1):7–34 doi 10.3322/caac.21551. - DOI - PubMed
    1. Siegel RL, Miller KD, Goding Sauer A, Fedewa SA, Butterly LF, Anderson JC, et al. Colorectal cancer statistics, 2020. CA Cancer J Clin 2020;70(3):145–64 doi 10.3322/caac.21601. - DOI - PubMed
    1. Yaeger R, Chatila WK, Lipsyc MD, Hechtman JF, Cercek A, Sanchez-Vega F, et al. Clinical Sequencing Defines the Genomic Landscape of Metastatic Colorectal Cancer. Cancer Cell 2018;33(1):125–36 e3 doi 10.1016/j.ccell.2017.12.004. - DOI - PMC - PubMed
    1. Su LK, Kinzler KW, Vogelstein B, Preisinger AC, Moser AR, Luongo C, et al. Multiple intestinal neoplasia caused by a mutation in the murine homolog of the APC gene. Science 1992;256(5057):668–70. - PubMed
    1. Cheung AF, Carter AM, Kostova KK, Woodruff JF, Crowley D, Bronson RT, et al. Complete deletion of Apc results in severe polyposis in mice. Oncogene 2010;29(12):1857–64 doi 10.1038/onc.2009.457. - DOI - PMC - PubMed

Publication types