

When possible, report a Fisher-exact P value and display its underlying null randomization distribution
- PMID: 32703808
- PMCID: PMC7431075
- DOI: 10.1073/pnas.1915454117
When possible, report a Fisher-exact P value and display its underlying null randomization distribution
Abstract
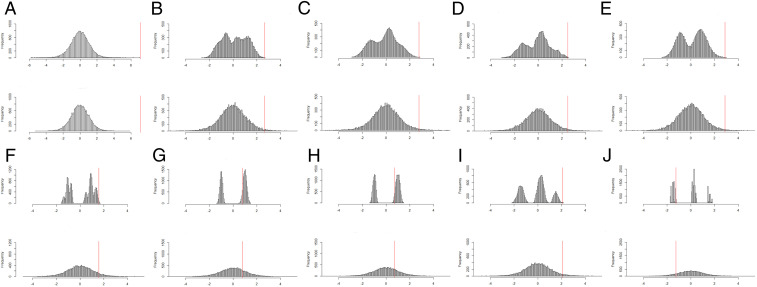
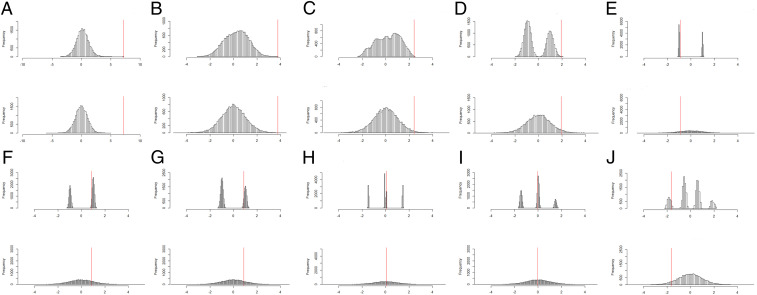
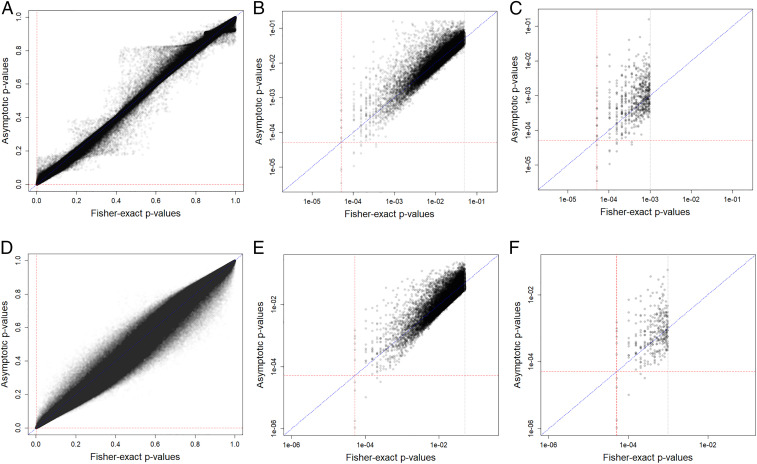
In randomized experiments, Fisher-exact P values are available and should be used to help evaluate results rather than the more commonly reported asymptotic P values. One reason is that using the latter can effectively alter the question being addressed by including irrelevant distributional assumptions. The Fisherian statistical framework, proposed in 1925, calculates a P value in a randomized experiment by using the actual randomization procedure that led to the observed data. Here, we illustrate this Fisherian framework in a crossover randomized experiment. First, we consider the first period of the experiment and analyze its data as a completely randomized experiment, ignoring the second period; then, we consider both periods. For each analysis, we focus on 10 outcomes that illustrate important differences between the asymptotic and Fisher tests for the null hypothesis of no ozone effect. For some outcomes, the traditional P value based on the approximating asymptotic Student's t distribution substantially subceeded the minimum attainable Fisher-exact P value. For the other outcomes, the Fisher-exact null randomization distribution substantially differed from the bell-shaped one assumed by the asymptotic t test. Our conclusions: When researchers choose to report P values in randomized experiments, 1) Fisher-exact P values should be used, especially in studies with small sample sizes, and 2) the shape of the actual null randomization distribution should be examined for the recondite scientific insights it may reveal.
Keywords: Fisher-exact P values; asymptotic P values; crossover randomized experiments; randomization-based inference; sensitivity analyses.
Copyright © 2020 the Author(s). Published by PNAS.
Conflict of interest statement
The authors declare no competing interest.
Figures
References
-
- Tukey J. W., The future of data analysis. Ann. Math. Stat. 33, 1–67 (1962).
-
- Fisher R. A., Statistical Methods for Research Workers, (Oliver and Boyd, ed. 1, 1925).
-
- Brillinger D. R., Jones L. V., Tukey J. W., “Report of the Statistical Task Force for the Weather Modification Advisory Board” in The Management of Western Resources, Vol. II: The Role of Statistics on Weather Resources Management, (Stock No. 003-018-00091-1, US Government Printing Office, Washington, DC, 1978), p. F-5.
-
- Devlin R. B. et al. ., Controlled exposure of healthy young volunteers to ozone causes cardiovascular effects. Circulation 126, 104–111 (2012). - PubMed
-
- Rosenbaum P. R., Design of Observational Studies, (Springer, New York, 2010).
Publication types
MeSH terms
Grants and funding
LinkOut - more resources
Full Text Sources
