. 2020 Jul;30(7):985-999.
doi: 10.1101/gr.257741.119. Epub 2020 Jul 23.

Transcriptome-wide sites of collided ribosomes reveal principles of translational pausing

Affiliations

Transcriptome-wide sites of collided ribosomes reveal principles of translational pausing

Alaaddin Bulak Arpat et al. Genome Res. 2020 Jul.

Abstract

Translation initiation is the major regulatory step defining the rate of protein production from an mRNA. Meanwhile, the impact of nonuniform ribosomal elongation rates is largely unknown. Using a modified ribosome profiling protocol based on footprints from two closely packed ribosomes (disomes), we have mapped ribosomal collisions transcriptome-wide in mouse liver. We uncover that the stacking of an elongating onto a paused ribosome occurs frequently and scales with translation rate, trapping ∼10% of translating ribosomes in the disome state. A distinct class of pause sites is indicative of deterministic pausing signals. Pause site association with specific amino acids, peptide motifs, and nascent polypeptide structure is suggestive of programmed pausing as a widespread mechanism associated with protein folding. Evolutionary conservation at disome sites indicates functional relevance of translational pausing. Collectively, our disome profiling approach allows unique insights into gene regulation occurring at the step of translation elongation.


Figures

Figure 1.
Figure 1.
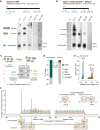
Sequencing of disome footprints identifies transcriptome-wide ribosomal collisions. (A,B) Northern blot analysis of RNase I-treated mouse liver extracts using probes antisense to Alb (A) and Mup7 mRNA (B). Expected footprint sizes for monosomes, disomes, and trisomes are shown to the left of blots. Positions of probes (nt) relative to the annotated CDS start sites on the indicated transcripts are shown above each lane and depicted as blue boxes below the CDS (black bar). The CDS region encoding the signal peptide (SP) is marked in red. (C) Schematic of experimental setup for sequencing of ∼60-nt disome footprints. (D) Proportion of reads from monosome and disome libraries that mapped to different sequence types: rRNA (gray), tRNA (golden), genomic (green), and cDNA/mRNA (teal for monosomes and brick red for disomes). Percentages of unmapped reads are shown in blue. (E) Histogram of insert size (nt) for reads that mapped to cDNA/mRNA sequences (monosomes: teal, disomes: brick red). A single mode for monosomes (29–30 nt) and two modes for disomes (59–60 and 62–63 nt) are labeled above histograms. (F) Density distribution of footprint reads within 120 nt from the start or −120 nt from the stop codons reveals 3-nt periodicity of footprints within coding sequences. The metatranscript analysis quantified the mean of per-transcript normalized number of reads (monosomes: teal, disomes: brick red) at each nucleotide based on the A-site prediction (15 nt and 45 nt downstream of the 5′ end of monosome and disome footprints, respectively). Transcripts from single protein isoform genes with total RNA-RPKM > 5, CDS > 400 nt, and UTRs of >180 nt (N = 4994) were used. The predicted E-, P-, and A-sites of ribosomes that presumably protected the corresponding footprints are shown in graphical depictions. Start/stop codons are highlighted (green) on a representative transcript below.
Figure 2.
Figure 2.
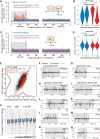
Disomes are associated locally with signal peptides and globally with high volumes of translation. (A,C) Density distribution of disome footprints identify signal peptide (SP)-related pausing events. Metatranscript analysis quantified the mean normalized footprint densities of disomes (A) and monosomes (C) within 400 nt from the start or −400 nt from the stop codons of transcripts encoding SPs (red, N = 713) or not (blue, N = 4743). (B,D) Violin-plots show the probability densities of length-normalized proportions of footprints within the first 75 codons and the rest of CDS from transcripts with (red, N = 713) or without (blue, N = 4743) SP for disomes (B) and monosomes (D). (E) Scatterplot of the relationship between per-gene normalized densities of disome and monosome footprints. All genes (N = 8626) were marked red or black depending on if they coded a SP (N = 1119) or not, respectively. Kernel density estimates are plotted on the margins (monosome on x-, disome on y-axis) for data sets of all genes (black) and SP coding genes (red) (without an axis of ordinates). Deming regression (errors-in-variables model) lines are shown for all genes (black) and the SP-coding subset (red). Regression slopes and their 95% confidence intervals (CI) are given in the top-left legends. Dashed gray line indicates the 1-to-1 slope. (FO) Distribution of normalized counts of monosome and disome footprints along transcripts of representative genes confirms stochastic versus deterministic sites. The upward y-axis of the bar-plots shows the normalized read counts for disomes (brick red), while the downward y-axis was used for monosomes (teal) and total RNA (pink, pile-up). Transcript coordinates (nt) are shown on the x-axis; CDS regions are shaded in gray. If present, SP or signal anchor (SA) regions are indicated as red boxes along the x-axis. Plots show: Adgrg3, Tfrc, Psmd4, Psmd5, Aldoa, Aldh1a1, Acox3, Pklr, Eif2a, and Eif5a in FO, respectively. (P) Box-plots illustrate the estimated proportion of ribosomes retained in disomes as a percentage of all translating ribosomes for different groups of genes. Box-and-whiskers were drawn for all genes detectable in the spike-in experiment (gray, N = 7375), subsets that code for SP (red, N = 892) or not (blue, N = 6483) and stratified into eight groups based on the octiles of the TE calculated from all genes, with right-closed interval boundaries (−5.41, −1.23, −0.77, −0.47, −0.23, −0.04, 0.17, 0.47, 3.17), depicted as increasing TE below the graph. Width of each box is proportional to the number of data points it represents.
Figure 3.
Figure 3.
Disome sites show specific amino acid and codon enrichment. (A) Position-specific enrichment analysis reveals selectivity for amino acids in the decoding center of paused ribosomes. Normalized ratios of observed-to-expected occurrences (y-axis, log-scaled) of nucleotide triplets, grouped by the amino acid they code (inset in right plot), are plotted for each codon position relative to the estimated A-site (0 at x-axis) of the leading ribosome of disomes (left), or of the individual ribosome in the case of monosomes (middle). For total RNA (right), position 0 denotes the midpoint of the reads. Ratios above and below 1 suggest enrichment and depletion, respectively. The vertical gray bars indicate the positions of the 5′ and 3′ ends of the read inserts for different library types. A- and P-sites are marked by vertical dashed lines. (BD) Position-specific enrichment plots of sequences coding for representative amino acids at and around pause sites identified by disomes. Similar to A, yet triplets were not combined into amino acids but instead shown individually (inset) for aspartic acid (Asp), isoleucine (Ile), and glycine (Gly), respectively, in BD. (E) Position weight matrix of sequence triplets grouped by amino acids illustrates enrichment and depletion of specific amino acids within the decoding center of the leading ribosome of the disomes. Position-specific weighted log2-likelihood scores were calculated from the observed-to-expected ratios (A). Enrichment and depletion carry positive and negative scores, respectively. Height of each single-letter amino acid character is determined by its absolute score. At each codon position, letters were sorted by the absolute scores of the corresponding amino acids, in descending order. Letters are colored by amino acid hydrophobicity and charge. The ribosome pair and their footprint are depicted graphically at the top, with gray zones at the extremities of the footprint denoting the spread of 5′ and 3′ ends of the read inserts. (F,G) Similar to B, for asparagine (Asn) (F) and lysine (Lys) (G). (H) Position-specific enrichment plots for dipeptides. Similar to A, but instead of triplets and single amino acids, 6-mers coding for a pair of amino acids (dipeptides) were used to calculate the observed-to-expected ratios for all possible dipeptides. Color code is not given due to vast number of dipeptides. (IK) Similar to B, showing enrichment of individual 6-mers for dipeptides Gly-Ile (I), Asp-Ile (J), and Gly-Asp (K). (L) Enrichment and codon selectivity of all amino acid combinations at the predicted P- and A-sites of the leading ribosome. Identities of amino acids at the P- and A-sites are resolved vertically and horizontally, respectively. Disk area and color represent enrichment of disome sites and codon selectivity, respectively. Codon selectivity is calculated as the difference between the max. and min. enrichment ratios (log) of all 6-mers coding for a given dipeptide. (M,N) As in IK, for Asp-Lys (M) and Gly-Gly (N). Disome-prone and disome-poor codon usages are marked in blue and black, respectively. (O) Relative disome occupancy by dicodon. Disome occupancy for the 3721 dicodon combinations was plotted in descending order. Occupancies were calculated for a given 6-mer (dicodon) as the raw percentage of sites with disome to all present sites (with + without disome) across the studied transcriptome. The frequency of sites is shown at the top of the graph colored in lime (moving average trend line in orange). Annotated are two pairs of 6-mers from panels M and N, coding for Asp-Lys or Gly-Gly, which show large differences in disome occupancies depending on codon usage (blue vs. black for high vs. low occupancy, respectively).
Figure 4.
Figure 4.
Disome site positions are related to nascent polypeptide charge and secondary structure. (A) Position-specific enrichment analysis reveals association with positive charge in the nascent polypeptide. Average charge of three consecutive amino acids was stratified into five charge groups (interval boundaries and color codes on the left). Normalized ratios of observed-to-expected occurrences (y-axis, log-scaled) of charge groups were plotted at the center position of the tripeptide relative to the estimated A-site (0 at x-axis) of the leading ribosome (disomes, left panel), or of the individual ribosome (monosomes, middle). RNA is shown in the right panel. The red shaded area in the disome panel (left) marks the extended stretch of positive charge upstream of pause sites. See Figure 3A for general plotting features. (B) Schematic of the electrostatic interactions between the leading ribosome and the nascent peptide chain. Associations of negatively charged residues (blue) with the P- and A-sites and a stretch of positively charged residues (red) within the exit tunnel is depicted. (C) Association between disome sites and the nascent polypeptide structure. Based on the UniProt structural annotation, each position of translated peptides was labeled “structured” for α-helix or β-sheet, “unstructured”, or “unknown”; β-turns were excluded. See Figure 3A for general plotting features. (D) Schematic depicting a preference for pausing during the translation of unstructured polypeptide stretches (orange) that are preceded and followed by structured regions (purple). (E) Enrichment of disome sites within the unstructured stretches of polypeptides that are preceded and followed by structured regions. Structured (min. 3 aa, up to 30th position) - unstructured (min. 6, max. 30 aa) - structured (min. 3 aa, up to 30th position) regions were identified transcriptome-wide. Positions across regions were scaled to the length of the unstructured region and aligned to its start, such that start and end of the unstructured region would correspond to 0 and 1, respectively (x-axis). Kernel density estimates (thick black lines) were calculated for peaks across normalized positions weighted with their normalized counts, estimated at the A-site of the leading ribosome for disomes (left), A-site of the monosomes (center), or center of total RNA reads (right). The density lines drop naturally towards the extremities, as the data matrices were normalized and aligned to the unstructured region and lower numbers of data points are expected to be observed at increasing distance from the boundaries. Confidence intervals for the kernel densities, which were calculated by randomly shuffling (N = 10,000) peaks within each transcript, are shown by gray shaded regions (and allow estimating statistical significance of the signal): darkest at the center, 50% (median) to outward, 25%, 12.5%, 5%, 2.5%, and 1%. (FI) Three-dimensional structures of proteins with disome site amino acids highlighted. Human PSMA5 (PDB ID: 5VFT) (F); human ALDH1A1 (4WJ9) (G); human GAPDH (4WNC), corresponding residues at aa 65–66 (H); murine EIF5A (5DLQ) (I). The positions of the strongest disome sites are shown in red.
Figure 5.
Figure 5.
Disome sites are associated with specific pathways and with known pausing events. (A) Functional enrichment analysis of the top 200 genes from the prominent disome peak list. Five terms with the highest −log10(padj) values (horizontal bars) are shown from each Gene Ontology (GO) group: molecular function, cellular component, biological process. See Supplemental Table S4 for full analysis. (BG) Distribution of normalized counts of monosome and disome footprints (per nt) and RNA (pileup) along selected transcripts, similar to Figure 2F–O. Selenok (B) and Sephs2 (C) show a strong disome peak on the selenocysteine codon (Sec, marked in pink). Position of the SECIS elements is indicated in pink. Sec61b (D) and Vamp2 (E) are tail-anchored proteins with a transmembrane domain (TMD, green). For Sec61b, a strong disome site is located on GK91-92 (marked in blue). Xbp1 (F) contains a C-terminal region (CTR, green) with several disome sites. The strong site on Asn256 is marked in blue; Azin1 (G) contains an upstream conserved coding region (uCC, green) that undergoes polyamine-dependent translational elongation. The main disome site is on a the uCC dipeptide GP14-15.
Figure 6.
Figure 6.
Evolutionary conservation at disome sites. (A) Association of highly conserved codons with the P- and A-sites of disome sites revealed by position-specific enrichment analysis. Along coding regions, phyloP conservation scores were grouped into categories: neutral - blue, [−3, 3), conserved - orange, [3, 5), and highly conserved [5,). Normalized ratios of observed-to-expected occurrences (y-axis, log-scaled) of conservation categories were plotted relative to the estimated A-site (0 at x-axis) of the leading ribosome (disomes, left), or of the individual ribosome (monosomes, middle). See Figure 3A for other elements. (B) Box-and-whiskers illustrating the estimated percentages of ribosomes that were in disomes for groups of transcripts with different overall evolutionary conservation. Groups included all detectable genes (all, gray, N = 7375), which were stratified into four groups (N = 2270 or 2271 for each; color code at the top) based on the quartiles of average phyloP scores with the following right-closed boundaries: −0.585, 2.327, 3.356, 4.239, 6.437. x-axis and other features are as in Figure 2P. (C) Odds ratio estimates of dipeptides and disome sites for increased phyloP scores. Odds ratios (OR) for having a high phyloP score at P-A dicodons were estimated for dipeptides encoded by the dicodon (orange dots, 399 levels relative to dipeptide VH, which had moderate phyloP scores in both models) and presence of a disome peak (green dots, A-position disome density > mean transcript density) using a logistic regression model. Confidence levels of estimates were represented by transparency levels that corresponded to deciles of the logarithm of absolute values of their z-scores (legend). Two separate regression models were fitted using phyloP scores from the 60-way vertebrate data set (left) and the Euarchontoglire subset (right). For disomes, OR is larger than 1 (dashed line) indicating that it is more likely to observe a high phyloP score when disome peaks are present than when they are absent.

References

    1. Andreev DE, O'Connor PB, Zhdanov AV, Dmitriev RI, Shatsky IN, Papkovsky DB, Baranov PV. 2015. Oxygen and glucose deprivation induces widespread alterations in mRNA translation within 20 minutes. Genome Biol 16: 90 10.1186/s13059-015-0651-z - DOI - PMC - PubMed
    1. Charneski CA, Hurst LD. 2013. Positively charged residues are the major determinants of ribosomal velocity. PLoS Biol 11: e1001508 10.1371/journal.pbio.1001508 - DOI - PMC - PubMed
    1. Dana A, Tuller T. 2012. Determinants of translation elongation speed and ribosomal profiling biases in mouse embryonic stem cells. PLoS Comput Biol 8: e1002755 10.1371/journal.pcbi.1002755 - DOI - PMC - PubMed
    1. Dao Duc K, Song YS. 2018. The impact of ribosomal interference, codon usage, and exit tunnel interactions on translation elongation rate variation. PLoS Genet 14: e1007166 10.1371/journal.pgen.1007166 - DOI - PMC - PubMed
    1. Darnell AM, Subramaniam AR, O'Shea EK. 2018. Translational control through differential ribosome pausing during amino acid limitation in mammalian cells. Mol Cell 71: 229–243.e11. 10.1016/j.molcel.2018.06.041 - DOI - PMC - PubMed

Publication types