. 2020 Sep 4;369(6508):1255-1260.
doi: 10.1126/science.abd2161. Epub 2020 Jul 23.

Evolution and epidemic spread of SARS-CoV-2 in Brazil

Darlan S Candido #  1   2 Ingra M Claro #  2   3 Jaqueline G de Jesus #  2   3 William M Souza #  4 Filipe R R Moreira #  5 Simon Dellicour #  6   7 Thomas A Mellan #  8 Louis du Plessis  1 Rafael H M Pereira  9 Flavia C S Sales  2   3 Erika R Manuli  2   3 Julien Thézé  10 Luiz Almeida  11 Mariane T Menezes  5 Carolina M Voloch  5 Marcilio J Fumagalli  4 Thaís M Coletti  2   3 Camila A M da Silva  2   3 Mariana S Ramundo  2   3 Mariene R Amorim  12 Henrique H Hoeltgebaum  13 Swapnil Mishra  8 Mandev S Gill  7 Luiz M Carvalho  14 Lewis F Buss  2 Carlos A Prete Jr  15 Jordan Ashworth  16 Helder I Nakaya  17 Pedro S Peixoto  18 Oliver J Brady  19   20 Samuel M Nicholls  21 Amilcar Tanuri  5 Átila D Rossi  5 Carlos K V Braga  9 Alexandra L Gerber  11 Ana Paula de C Guimarães  11 Nelson Gaburo Jr  22 Cecila Salete Alencar  23 Alessandro C S Ferreira  24 Cristiano X Lima  25   26 José Eduardo Levi  27 Celso Granato  28 Giulia M Ferreira  29 Ronaldo S Francisco Jr  11 Fabiana Granja  12   30 Marcia T Garcia  31 Maria Luiza Moretti  31 Mauricio W Perroud Jr  32 Terezinha M P P Castiñeiras  33 Carolina S Lazari  34 Sarah C Hill  1   35 Andreza Aruska de Souza Santos  36 Camila L Simeoni  12 Julia Forato  12 Andrei C Sposito  37 Angelica Z Schreiber  38 Magnun N N Santos  38 Camila Zolini de Sá  39 Renan P Souza  39 Luciana C Resende-Moreira  40 Mauro M Teixeira  41 Josy Hubner  42 Patricia A F Leme  43 Rennan G Moreira  44 Maurício L Nogueira  45 Brazil-UK Centre for Arbovirus Discovery, Diagnosis, Genomics and Epidemiology (CADDE) Genomic NetworkNeil M Ferguson  8 Silvia F Costa  2   3 José Luiz Proenca-Modena  12 Ana Tereza R Vasconcelos  11 Samir Bhatt  8 Philippe Lemey  7 Chieh-Hsi Wu  46 Andrew Rambaut  47 Nick J Loman  21 Renato S Aguiar  39 Oliver G Pybus  1 Ester C Sabino  48   3 Nuno Rodrigues Faria  49   2   8
Affiliations

Evolution and epidemic spread of SARS-CoV-2 in Brazil

Darlan S Candido et al. Science. .

Abstract

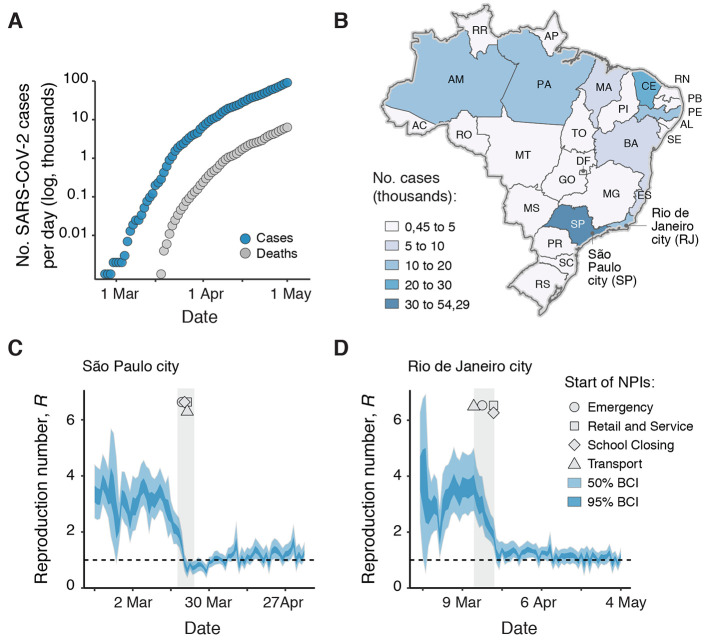
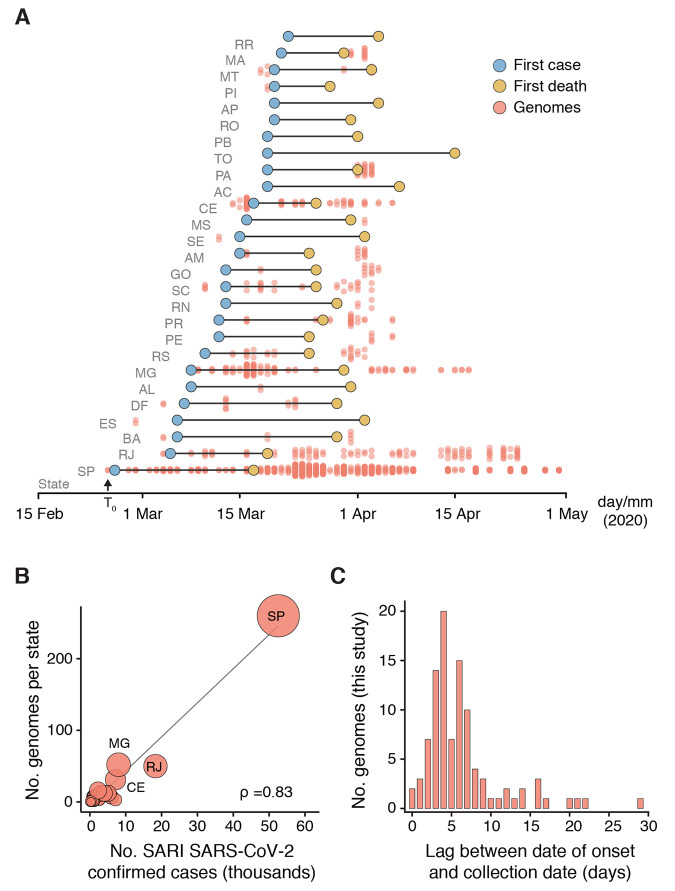
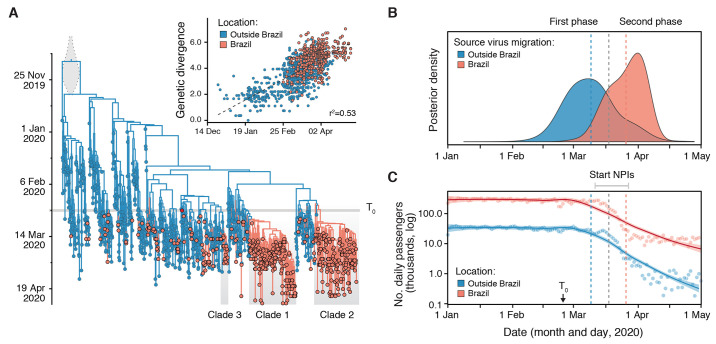
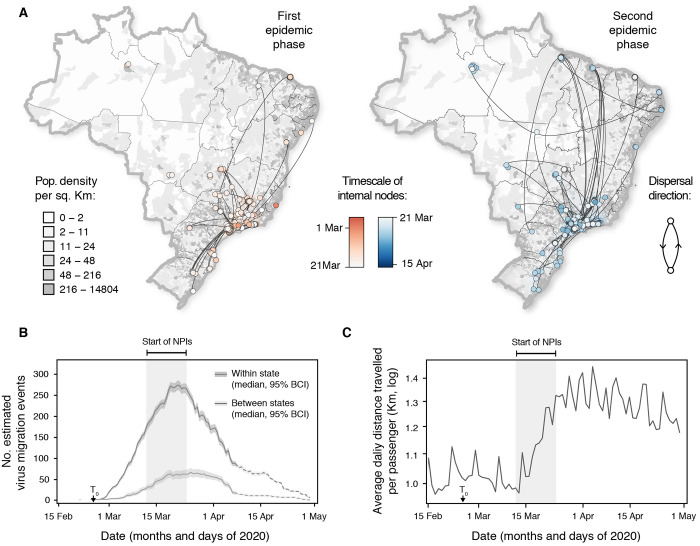
Brazil currently has one of the fastest-growing severe acute respiratory syndrome coronavirus 2 (SARS-CoV-2) epidemics in the world. Because of limited available data, assessments of the impact of nonpharmaceutical interventions (NPIs) on this virus spread remain challenging. Using a mobility-driven transmission model, we show that NPIs reduced the reproduction number from >3 to 1 to 1.6 in São Paulo and Rio de Janeiro. Sequencing of 427 new genomes and analysis of a geographically representative genomic dataset identified >100 international virus introductions in Brazil. We estimate that most (76%) of the Brazilian strains fell in three clades that were introduced from Europe between 22 February and 11 March 2020. During the early epidemic phase, we found that SARS-CoV-2 spread mostly locally and within state borders. After this period, despite sharp decreases in air travel, we estimated multiple exportations from large urban centers that coincided with a 25% increase in average traveled distances in national flights. This study sheds new light on the epidemic transmission and evolutionary trajectories of SARS-CoV-2 lineages in Brazil and provides evidence that current interventions remain insufficient to keep virus transmission under control in this country.


Figures

Fig. 1
Fig. 1. SARS-CoV-2 epidemiology and epidemic spread in Brazil.
(A) Cumulative number of SARS-CoV-2 reported cases (blue) and deaths (grey) in Brazil. (B) States are colored according to the number of cumulative confirmed cases by 30 April 2020. (C and D) Reproduction number (R) over time for the cities of São Paulo (C) and Rio de Janeiro (D). R were estimated using a Bayesian approach incorporating daily number of deaths and four variables related to mobility data (a social isolation index from Brazilian geolocation company InLoco, and Google mobility indices for time spent in transit stations, parks, and the average between groceries and pharmacies, retail and recreational, and workspaces). Dashed horizontal line indicates R = 1. Grey area and geometric symbols show the times at which NPIs interventions were implemented. Bayesian credible intervals (BCIs, 50 and 95%) are shown as shaded areas. The 2-letter ISO 3166-1 codes for the 27 federal units in Brazil are provided in Supplementary Information.
Fig. 2
Fig. 2. Spatially-representative genomic sampling.
(A) Dumbbell plot showing the time intervals between date of collection of sampled genomes, notification of first cases and first deaths in each state. Red lines indicate the lag between the date of collection of first genome sequence and first reported case. The key for the 2-letter ISO 3166-1 codes for Brazilian federal units (or states) are provided in Supplementary Information. (B) Spearman’s rank (ρ) correlation between the number of SARI SARS-CoV-2 confirmed and SARI cases with unknown aetiology against number of sequences for each of the 21 Brazilian states included in this study (see also fig. S4). Circle sizes are proportional to the number of sequences for each federal unit. (C) Interval between the date of symptom onset and date of sample collection for the sequences generated in this study.
Fig. 3
Fig. 3. Evolution and spread of SARS-CoV-2 in Brazil.
(A) Time-resolved maximum clade credibility phylogeny of 1182 SARS-CoV-2 sequences, 490 from Brazil (red) and 692 from outside Brazil (blue). The largest Brazilian clades are highlighted by grey boxes (Clade 1, Clade 2 and Clade 3). The panel A inset shows a root-to-tip regression of genetic divergence against dates of sample collection. (B) Dynamics of SARS-CoV-2 import events in Brazil. Dates of international and national (between federal states) migration events were estimated from virus genomes using a phylogeographic approach. The first phase was dominated by virus migrations from outside Brazil while the second phase is marked by virus spread within Brazil. Dashed vertical lines correspond to the mean posterior estimate for migration events from outside Brazil (blue) and within Brazil (red). (C) Locally estimated scatterplot smoothing of the daily number of international (blue) and national (red) air passengers in Brazil in 2020. T0 = date of first reported case in Brazil (25 February 2020).
Fig. 4
Fig. 4. Spread of SARS-CoV-2 in Brazil.
(A) Spatiotemporal reconstruction of the spread of Brazilian SARS-CoV-2 clusters containing >2 sequences during the first (left) and the second epidemic phase (right) epidemic phase (Fig. 3B). Circles represent nodes of the MCC phylogeny and are colored according to their inferred time of occurrence. Shaded areas represent the 80% highest posterior density (HPD) interval and depict the uncertainty of the phylogeographic estimates for each node. Solid curved lines denote the links between nodes and the directionality of movement. Sequences belonging to clusters with <3 sequences were also plotted on the map with no lines connecting them. Background population density for each municipality was obtained from the Brazilian Institute of Geography (https://www.ibge.gov.br/). See fig. S14 for details of virus spread in the Southeast region. (B) Estimated number of within state (or within a given federal unit) and between-state (or between federal units) virus migrations over time. Dashed lines indicate estimates obtained during period of limited sampling (fig. S2). (C) Average distance in kilometres travelled by an air passenger per day in Brazil. Number of daily air passengers is shown in Fig. 3B. Light grey boxes indicate starting dates of NPIs across Brazil.

References

    1. Andersen K. G., Rambaut A., Lipkin W. I., Holmes E. C., Garry R. F., The proximal origin of SARS-CoV-2. Nat. Med. 26, 450–452 (2020). 10.1038/s41591-020-0820-9 - DOI - PMC - PubMed
    1. Wu F., Zhao S., Yu B., Chen Y.-M., Wang W., Song Z.-G., Hu Y., Tao Z.-W., Tian J.-H., Pei Y.-Y., Yuan M.-L., Zhang Y.-L., Dai F.-H., Liu Y., Wang Q.-M., Zheng J.-J., Xu L., Holmes E. C., Zhang Y.-Z., A new coronavirus associated with human respiratory disease in China. Nature 579, 265–269 (2020). 10.1038/s41586-020-2008-3 - DOI - PMC - PubMed
    1. World Health Organization, Coronavirus Disease (COVID-2019) Situation Reports (2020); www.who.int/emergencies/diseases/novel-coronavirus-2019/situation-reports.
    1. Tian H., Liu Y., Li Y., Wu C.-H., Chen B., Kraemer M. U. G., Li B., Cai J., Xu B., Yang Q., Wang B., Yang P., Cui Y., Song Y., Zheng P., Wang Q., Bjornstad O. N., Yang R., Grenfell B. T., Pybus O. G., Dye C., An investigation of transmission control measures during the first 50 days of the COVID-19 epidemic in China. Science 368, 638–642 (2020). 10.1126/science.abb6105 - DOI - PMC - PubMed
    1. Kraemer M. U. G., Yang C.-H., Gutierrez B., Wu C.-H., Klein B., Pigott D. M., du Plessis L., Faria N. R., Li R., Hanage W. P., Brownstein J. S., Layan M., Vespignani A., Tian H., Dye C., Pybus O. G., Scarpino S. V.; Open COVID-19 Data Working Group , The effect of human mobility and control measures on the COVID-19 epidemic in China. Science 368, 493–497 (2020). 10.1126/science.abb4218 - DOI - PMC - PubMed

Publication types

MeSH terms