. 2020 Jul 23;11(1):3687.
doi: 10.1038/s41467-020-17491-z.

Gasdermin-D-dependent IL-1α release from microglia promotes protective immunity during chronic Toxoplasma gondii infection

Affiliations

Gasdermin-D-dependent IL-1α release from microglia promotes protective immunity during chronic Toxoplasma gondii infection

Samantha J Batista et al. Nat Commun. .

Abstract

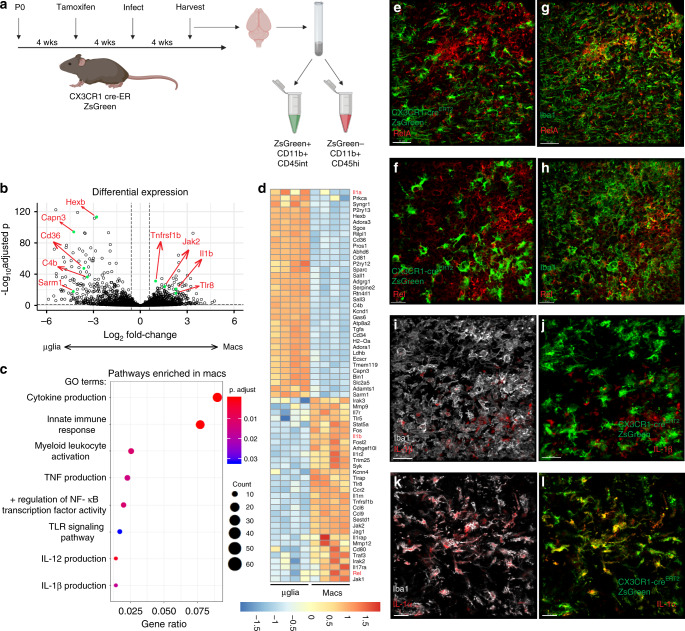
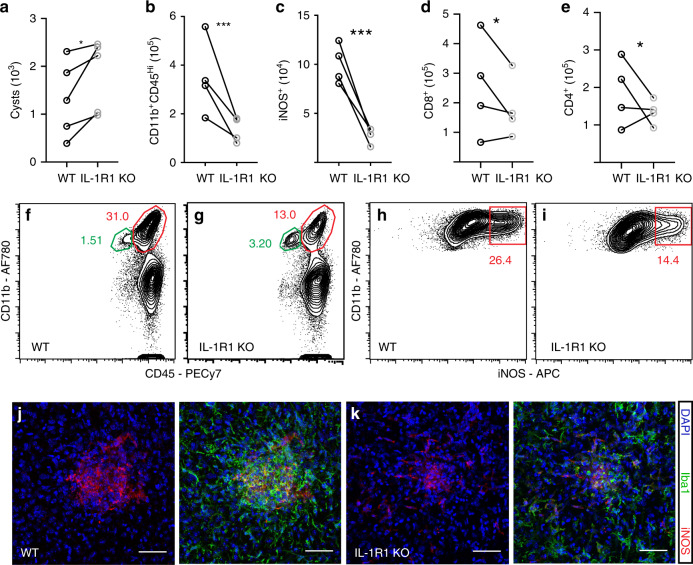
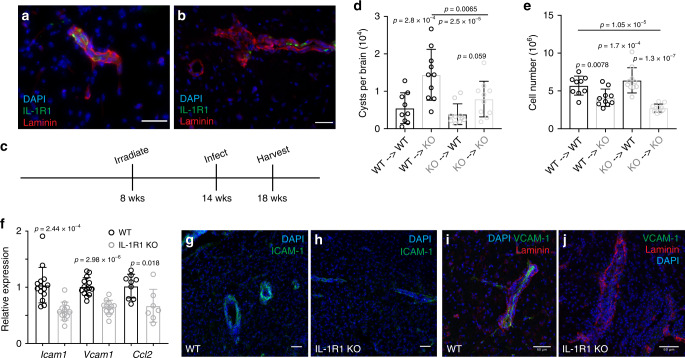
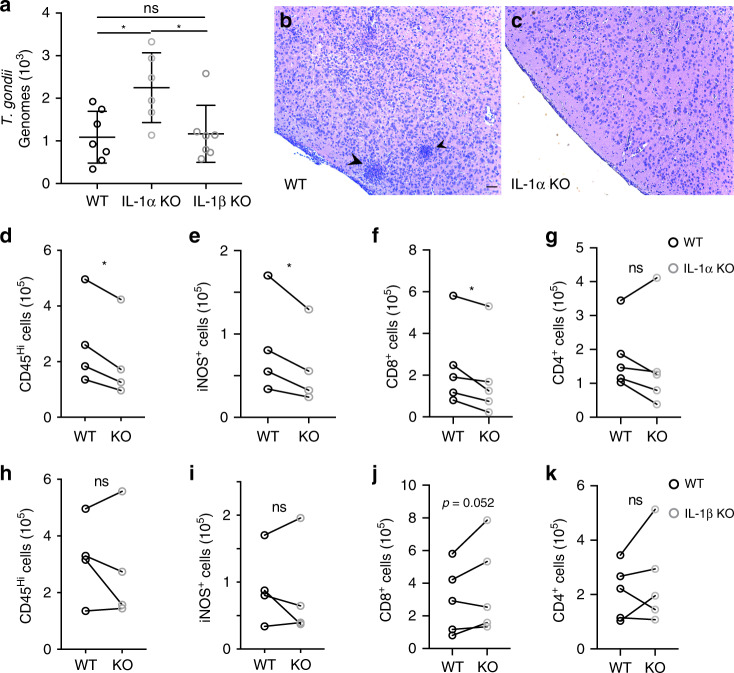
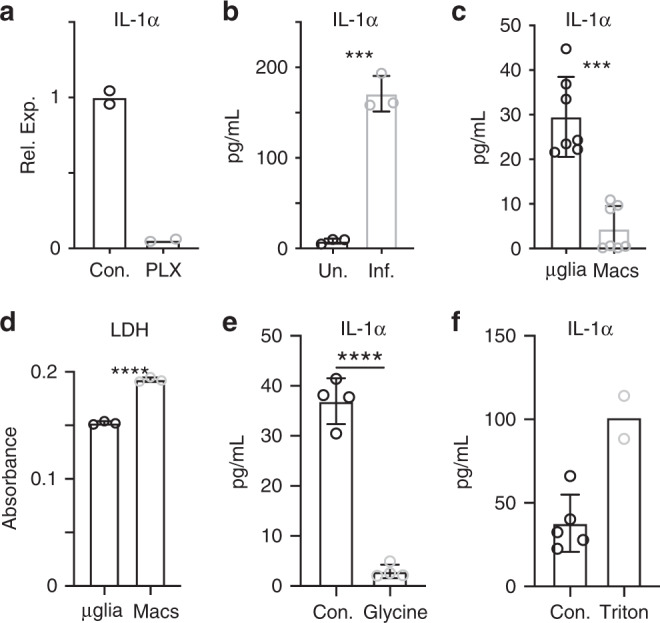
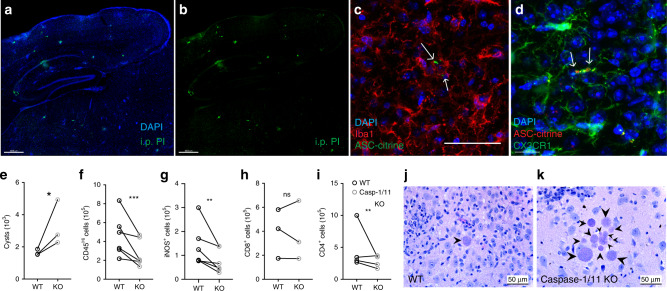
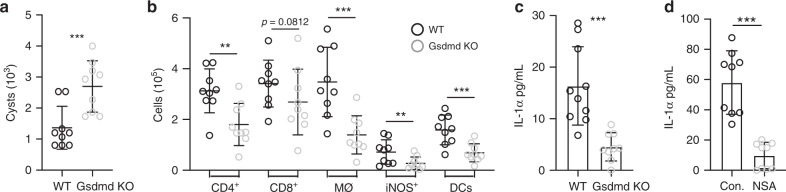
Microglia, resident immune cells of the CNS, are thought to defend against infections. Toxoplasma gondii is an opportunistic infection that can cause severe neurological disease. Here we report that during T. gondii infection a strong NF-κB and inflammatory cytokine transcriptional signature is overrepresented in blood-derived macrophages versus microglia. Interestingly, IL-1α is enriched in microglia and IL-1β in macrophages. We find that mice lacking IL-1R1 or IL-1α, but not IL-1β, have impaired parasite control and immune cell infiltration within the brain. Further, we show that microglia, not peripheral myeloid cells, release IL-1α ex vivo. Finally, we show that ex vivo IL-1α release is gasdermin-D dependent, and that gasdermin-D and caspase-1/11 deficient mice show deficits in brain inflammation and parasite control. These results demonstrate that microglia and macrophages are differently equipped to propagate inflammation, and that in chronic T. gondii infection, microglia can release the alarmin IL-1α, promoting neuroinflammation and parasite control.


Conflict of interest statement

The authors declare no competing interests.

Figures

Fig. 1
Fig. 1. Microglia lack an NF-κB signature in the infected brain.
ad Chronically infected CX3CR1Cre-ERT2 × ZsGreenfl/stop/fl mice were sacrificed and brains were harvested and processed for flow cytometry (n = 4 mice). Samples were run on a BD Aria, gated on live/singlets/CD45+/CD11b+ from which ZsGreen+ and ZsGreen populations were gated and sorted. Sorted cell populations were subjected to RNA sequencing. a Experimental setup. b Differential abundance testing was performed and results were plotted in R to produce a volcano plot showing differentially expressed genes between microglia and macrophage populations. Example genes are labeled in red corresponding to green dots. c GO terms statistically over-represented in macrophages compared to microglia were generated and a selection of significantly enriched pathways of interest were plotted using R. d Significantly differentially expressed genes between the two cell populations were selected based on interest and plotted in a heatmap using complete-linkage clustering of a euclidean distance matrix of all samples. e–l Representative images of brain sections from chronically infected CX3CR1Cre-ERT2 × ZsGreenfl/stop/fl mice. Experiment was performed twice. ZsGreen is shown in green (e, f, j, l) and sections were stained for Iba1 (green, g, h; gray, i, k), RelA (e, g red), Rel (f, h red), IL-1β (i, j red), and IL-1α (k, l red). Scale bars indicate 30 μm.
Fig. 2
Fig. 2. IL-1R1 KO mice have an impaired immune response to infection.
WT C57B6/J or IL-1R1 KO mice were infected i.p. with 10 cysts of the Me49 strain of T. gondii. 6 weeks p.i. brains were harvested and homogenized. a Cyst burden per brain was determined by counting cysts in brain homogenate on a light microscope. Paired averages from five experiments are shown, and statistics were performed using a randomized block ANOVA (two way). p = 0.048 (n = 35 mice) b–i Brains from the same mice were processed to achieve a single cell suspension and analyzed by flow cytometry. Data compiled from four experiments; statistics were performed using a randomized block ANOVA (two way). (n = 33 mice). b Blood-derived myeloid cells were defined as CD11b+CD45hi, cells were pre-gated on singlets/live/CD45+/CD11c, p = 2.07 × 10−7, representative flow plots are shown in (f, g). c The number of iNOS+ cells per brain were calculated, pre-gated on singlets/live/CD45+/CD11c/CD11b+CD45hi, p = 3.99 × 10−7, representative flow plots are shown in (h, i). d, e CD8+ (p = 0.015) and CD4+ (p = 0.035) T cell numbers were calculated, pre-gated on singlets/live/CD3+. j, k Representative confocal images of focal areas of inflammation in chronically infected brains of WT (j) and IL-1R1 KO (k) mice. Scale bars indicate 50 μm. Source data (ae) are provided as a Source data file.
Fig. 3
Fig. 3. IL-1R1 is expressed by brain vasculature.
a, b Brains from chronically infected C57B6/J WT mice were sectioned and stained with DAPI (blue) and antibodies against laminin (red) and IL-1R1 (green), showing parenchymal blood vessels. ce WT (CD45.1) and IL-1R1 KO (CD45.2) mice were lethally irradiated and then reconstituted with bone marrow from either WT or IL-1R1 KO mice. Mice were allowed to reconstitute for 6 weeks and then were infected i.p. with 10 cysts of the Me49 strain of T. gondii. 4 weeks p.i. mice were sacrificed and their brains were harvested for analysis. (n = 39 mice). d Brains were homogenized and cysts were counted by light microscopy. e Brains were processed for flow cytometry and the numbers of total leukocytes were calculated. Cells were pre-gated on singlets/live. d, e Data compiled from two experiments, statistics performed using a randomized block ANOVA (two way). Data presented as mean values ± SEM. f WT and IL-1R1 KO mice were infected i.p. with 10 cysts of the Me49 strain of T. gondii. 6 weeks p.i. the mice were sacrificed and brains were homogenized, RNA was extracted, and qPCR analysis was performed. Data compiled from 2 (Ccl2) or 3 (Icam1, Vcam1) experiments; statistics performed using a randomized block ANOVA (two way). Data presented as mean values ± SEM. (n = 26 mice for Icam1 and Vcam1, n = 16 mice for Ccl2). gj Brains from chronically infected WT and IL-1R1 KO mice were sectioned and stained for either ICAM-1 (g, h) or VCAM-1 (i, j). Representative images of blood vessels are shown. g, h Scale bars are 50 μm and i, j scale bars are 60 μm.
Fig. 4
Fig. 4. IL-1α KO mice have an impaired immune response to infection.
WT C57B6/J, IL-1α KO, and IL-1β KO were infected i.p. with 10 cysts of the Me49 strain of T. gondii. 6 weeks p.i. brains were harvested and analyzed. a Genomic DNA was isolated from brain homogenate, and parasite DNA was quantified using real-time qPCR. Data compiled from two experiments; statistics performed using a randomized block ANOVA (two way). Data presented as mean values ± SEM. (n = 20 mice) For WT vs IL-1α KO p = 0.0259, for IL-1α KO vs IL-1β KO p = 0.0198. b, c Brain slices from WT (b) and IL-1α KO (c) were H&E stained and representative images are shown. Arrow heads indicate clusters of immune cells. Scale bar indicates 100 μm (images were taken at the same magnification). dk Brains were processed to obtain a single cell suspension, and analyzed by flow cytometry. Paired averages from 4 or 5 compiled experiments, statistics performed using a randomized block ANOVA (two way). d, h Blood-derived myeloid cells per brain as defined by CD11b+CD45hi. Cells were pre-gated on singlets/live/CD45+/CD11c-. (n = 32 mice). d p = 0.039. e, i iNOS+ cells per brain were quantified, pre-gated on singlets/live/CD45+/CD11c-/CD11b+CD45hi. (n = 32 mice). e p = 0.045. f, g, jk CD8+ and CD4+ T cells were quantified, pre-gated on singlets/live/CD3+. f p = 0.033. (f, g, n = 37 mice; j, k, n = 40 mice). Source data (dk) are provided as a Source data file.
Fig. 5
Fig. 5. IL-1α is released by microglia isolated from infected brains.
Uninfected mice were fed either control chow or chow containing PLX5622 for 12 days prior to sacrifice. a mRNA levels of IL-1α were determined by RT-qPCR on whole-brain homogenate. (n = 2 mice per group) Data are presented as mean values. b 6 weeks p.i. brains from WT mice were harvested and processed to a single cell suspension. Cells were plated in a 96 well plate and incubated at 37 °C overnight. IL-1α release was then measured by ELISA. (n = 3 mice per group, p = 0.0001) Data are presented as mean values ± SEM. c, d Chronically infected CX3CR1Cre-ERT2 × ZsGreenfl/stop/fl mice were sacrificed and brains were harvested and processed for flow cytometry. Samples were run on a BD Aria, gated on live/singlets/CD45+/CD11b+ from which ZsGreen+ and ZsGreen populations were gated and sorted. Cells from 6 mice were pooled. Equal numbers of each cell population were plated and incubated overnight at 37°C. Supernatants were collected and analyzed by ELISA for IL-1α (c, n = 7 wells per group, p = 9.76 × 10−9) and LDH (d, n = 3 wells per group, p < 0.0001) (plotted as absorbance at 490–680 nm). For c results from two experiments are shown. Data are presented as mean values ± SEM. e, f Assay was performed as in (b), with some wells treated with glycine to stop membrane permeability (e, n = 4 wells per group, p < 0.0001) or triton-containing lysis buffer to show total possible release (f, n = 7 wells). Data are presented as mean values ± SEM. Statistics were performed using a two-tailed Student’s T test (a, b, d, e) or a Randomized Block ANOVA (two way) (c).
Fig. 6
Fig. 6. Caspase-1/11 KO mice have an impaired response to infection.
a, b Chronically infected C57B6/J mice were injected i.p. with 20 mg/kg propidium iodide. 24 h later, mice were sacrificed and brains were imaged with confocal microscopy. A representative image is shown. c, d Mice expressing ASC-citrine (c) or ASC-citrine and CX3CR1-creERT2ZsGreen (d) were infected with 10 cysts of the Me49 strain of T. gondii. 4 weeks post infection brains were harvested, cryopreserved, stained, and imaged. Arrows indicate ASC aggregates in Iba1+ cells (c) or in ZsGreen+ microglial cells (d). e–i WT and casp-1/11KO mice were infected with 10 cysts of the Me49 strain of T. gondii. 6 weeks p.i. brains were harvested and analyzed. Paired averages for 3–6 experiments are shown. e Cyst burden per brain was determined by counting cysts in brain homogenate on a light microscope. (n = 20 mice, p = 0.034). f Infiltrating myeloid cell populations were quantified by flow cytometry. Cells were pre-gated on singlets/live/CD45+/CD11c. (n = 51 mice, p = 1.47 × 10−4). g iNOS+ cell populations were quantified, cells were pre-gated on singlets/live/CD45+/CD11c/CD11b+/CD45hi. (n = 51 mice, p = 0.0024). h, i CD8+ and CD4+ T cell populations were quantified, cells were pre-gated on live/singlets/CD3+. h (n = 41 mice). g (n = 51 mice, p = 7.47 × 10−4). j, k Brain slices from WT (j) and caspase-1/11 KO (k) mice were H&E stained and representative images are shown. Arrow heads indicate parasite cysts. Statistics were performed using a randomized block ANOVA (two way) (ei). Scale bars in (a, b) are 400 μm, scale bar in (d) is 15 μm, all other scale bars are 50 μm. Source data (ei) are provided as a Sourcedata file.
Fig. 7
Fig. 7. Inflammation and IL-1α release depend on gasdermin-D.
ac C57B6/J and Gasdermin D KO mice were infected i.p. with 10 cysts of the Me49 strain of T. gondii. 6 weeks p.i., mice were sacrificed and tissues were harvested for analysis. Data from two experiments are shown (n = 18 mice). a Cyst burden per brain was determined by counting cysts in brain homogenate on a light microscope, p = 8.14 × 10−4. b Brain tissue was processed for flow cytometry analysis and immune cell populations were quantified. All populations were previously gated on live/singlets. CD4+ and CD8+ were pre-gated on CD3+ T cells; DCs were pre-gated on CD45+ cells; infiltrating macrophage/monocytes (Mϕ) are defined as CD11cCD11b+CD45hi; iNOS+ cells were gated within the Mϕ gate. p values from left to right are: 0.0017, 0.0812, 0.00048, 0.0012, and 0.00022. c Single cell suspension from brain homogenate from WT and gsdmd KO mice was plated in a 96 well plate and incubated at 37 °C overnight. Supernatant was isolated and analyzed by ELISA for IL-1α, p = 4.77 × 10−4. d Brain homogenate from WT mice was plated as in (c), with either control media or 20 μm necrosulfonamide (NSA), p = 8.05 × 10−10. IL-1α release from two experiments is shown (d). (n = 9 mice) Data are presented as mean values ± SEM. Statistics were performed using a randomized block ANOVA (two way).

References

    1. Pappas G, Roussos N, Falagas ME. Toxoplasmosis snapshots: global status of Toxoplasma gondii seroprevalence and implications for pregnancy and congenital toxoplasmosis. Int J. Parasitol. 2009;39:1385–1394. - PubMed
    1. Belanger F, Derouin F, Grangeot-Keros L, Meyer L. Incidence and risk factors of toxoplasmosis in a cohort of human immunodeficiency virus-infected patients: 1988-1995. HEMOCO and SEROCO Study Groups. Clin. Infect. Dis. 1999;28:575–581. - PubMed
    1. Jones JL, et al. Toxoplasma gondii infection in the United States: seroprevalence and risk factors. Am. J. Epidemiol. 2001;154:357–365. - PubMed
    1. Luft BJ, Remington JS. Toxoplasmic encephalitis in AIDS. Clin. Infect. Dis. 1992;15:211–222. - PubMed
    1. Renold C, et al. Toxoplasma encephalitis in patients with the acquired immunodeficiency syndrome. Med. (Baltim.) 1992;71:224–239. - PubMed

Publication types

MeSH terms