. 2020 Jul 23;11(1):3692.
doi: 10.1038/s41467-020-17183-8.

Bile acids drive the newborn's gut microbiota maturation

Affiliations

Bile acids drive the newborn's gut microbiota maturation

N van Best et al. Nat Commun. .

Abstract

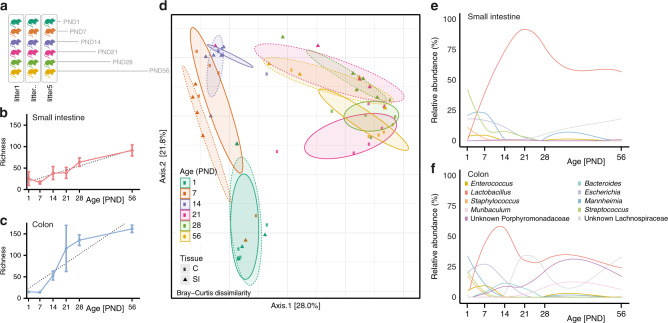
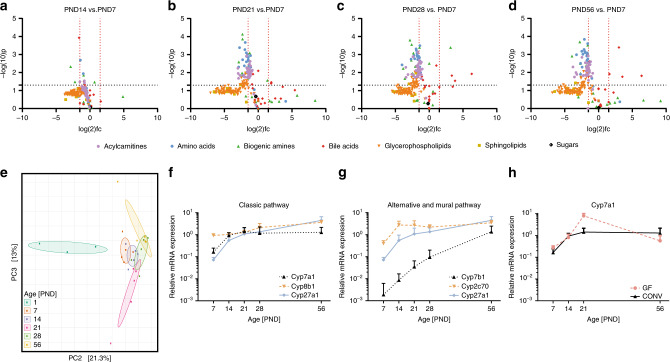
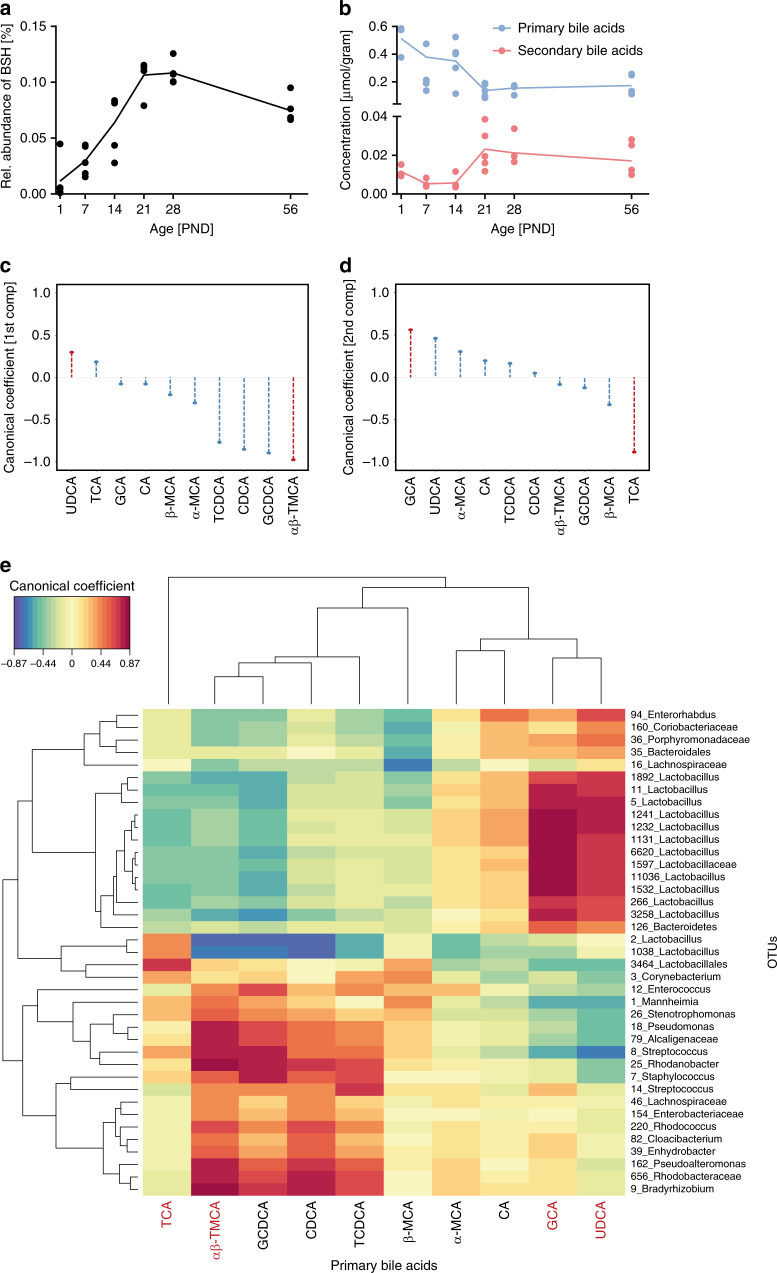
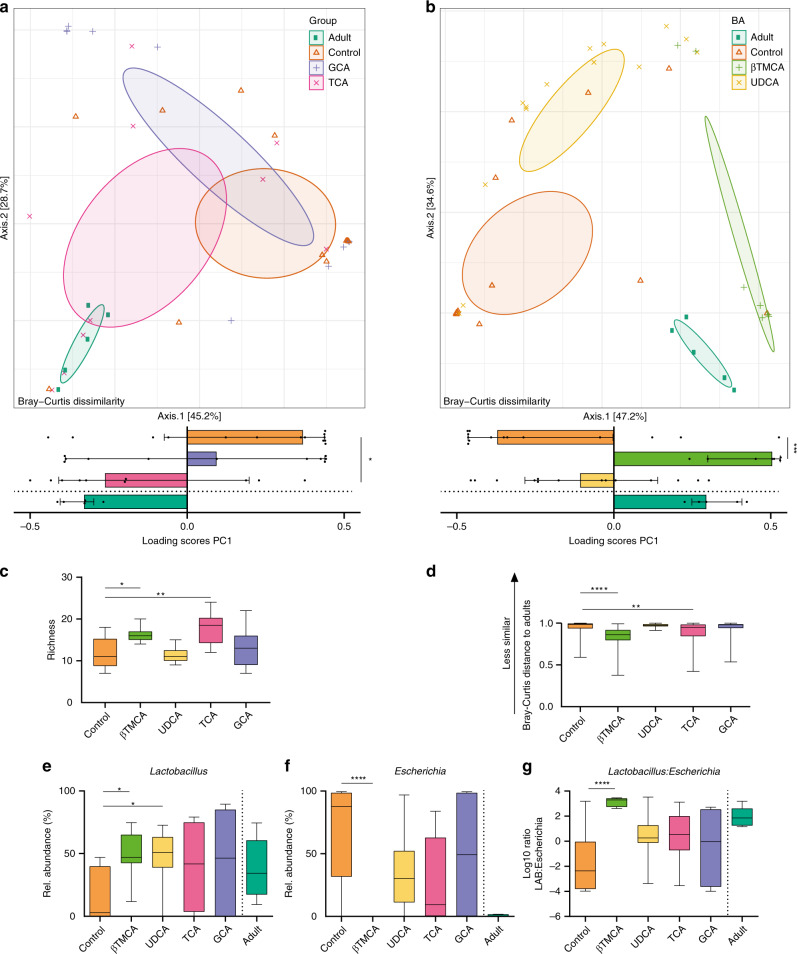
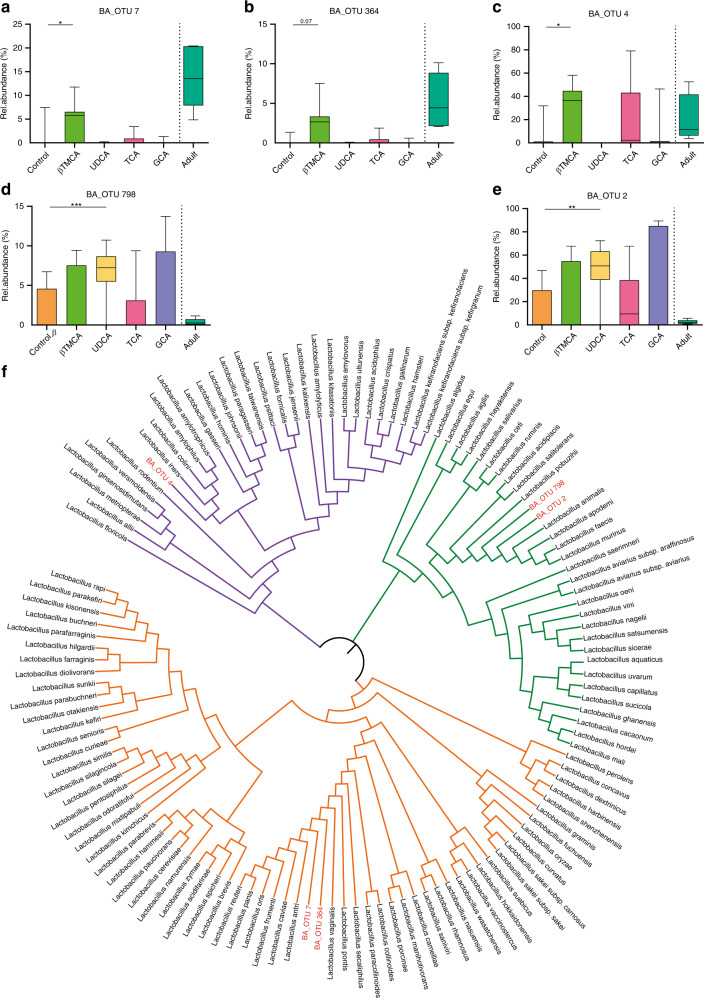
Following birth, the neonatal intestine is exposed to maternal and environmental bacteria that successively form a dense and highly dynamic intestinal microbiota. Whereas the effect of exogenous factors has been extensively investigated, endogenous, host-mediated mechanisms have remained largely unexplored. Concomitantly with microbial colonization, the liver undergoes functional transition from a hematopoietic organ to a central organ of metabolic regulation and immune surveillance. The aim of the present study was to analyze the influence of the developing hepatic function and liver metabolism on the early intestinal microbiota. Here, we report on the characterization of the colonization dynamics and liver metabolism in the murine gastrointestinal tract (n = 6-10 per age group) using metabolomic and microbial profiling in combination with multivariate analysis. We observed major age-dependent microbial and metabolic changes and identified bile acids as potent drivers of the early intestinal microbiota maturation. Consistently, oral administration of tauro-cholic acid or β-tauro-murocholic acid to newborn mice (n = 7-14 per group) accelerated postnatal microbiota maturation.


Conflict of interest statement

The authors declare no competing interests.

Figures

Fig. 1
Fig. 1. Postnatal dynamics of the intestinal microbiota composition.
a Image illustrating the study outline; one mouse from each one litter was analyzed for each individual time point (PND). b and c Richness (observed species) of the small intestinal (b) and colonic (c) microbiota exhibiting a gradual increase with age (n = 5 per PND for all subsequent analyses, mean and SD, p < 0.0001, linear regression R2 = 0.7702 and p < 0.0001, linear regression R2 = 0.7281, respectively). d Principal Coordinate Analysis (PCoA) based on Bray-Curtis dissimilarity indicating a gradual shift in microbial community structure along PC2 during the neonatal period PND1-PND14 and distinct structures for the small intestine and colon along PC2 at PND21-56 (p < 0.001, two-sided, Permanova for age and p < 0.01 two-sided, Permanova for tissue); Squares and solid line: colon (C); triangles and dashed line: small intestine (SI). e, f Relative abundances of the 10 most abundant genera listed in f between PND1-56 for the small intestine (e) and colon (f). Source data are provided as a Source Data file.
Fig. 2
Fig. 2. Metabolic changes during the postnatal period.
ad Volcano plots depicting acylcarnitines, glycerophospholipids, sphingolipids, sugars, bile acids, amino acids, and biogenic amines in liver tissue at PND14 vs. PND7 (a), PND21 vs. PND7 (b), PND28 vs. PND7 (c), and PND56 vs. PND7 (d) measured by mass spectrometry (n = 5 per group, two-tailed independent student’s t-test, fold-changes were calculated based on mean values by dividing the PNDx to PNDy concentrations and log2 the values). PND7 was selected as baseline for comparisons due to the high interindividual variation at PND1. e Principal Component Analysis (PCA) illustrating changes in the composition of the bile acid pool during the postnatal period. fg Relative hepatic expression of the key-enzymes of (f) the classical (Cyp7a1, Cyp8b1, and Cyp27a1) and (g) the alternative and murine pathway (Cyp7b1, Cyp2c70, and Cyp27a1) (n = 5 per group, mean and SD). h Relative expression of Cyp7a1 in total liver tissue of germ-free (GF) and conventionally (CONV) raised mice (n = 5 per group, mean and SD). Source data are provided as a Source Data file.
Fig. 3
Fig. 3. Enterohepatic cooperation in the maturation of the microbiota.
a Relative abundance of the predicted bacterial bile salt hydrolyses (KO1442) in the small intestinal microbiota (n = 5 per group, means connected and replicates). b Total concentration [µmol / gram] of primary (blue) and secondary (red) bile acids (n = 3 for PND1 and n = 5 for PND7-56, means connected and replicates). c, d Coefficients of the regularized canonical correlation analyses (rCCA) indicating the relationship between primary bile acids and small intestinal OTUs on the first component (c) and second component (d) (selected bile acids are highlighted in red). e Correlation heatmap based on the coefficients of the rCCA between hepatic primary bile acid concentrations and relative abundances of small intestinal OTUs indicated a strong positive effect (red) of GCA and UDCA on many Lactobacillus OTUs. Source data are provided as a Source Data file.
Fig. 4
Fig. 4. Oral administration of bile acids to neonate mice accelerates microbial maturation.
a, b PCoA (upper panels) and scores of the 1st axis (lower panels) based on Bray–Curtis dissimilarity indicating shifts in microbial community structure in the small intestine of adult mice (Adult, dark green), untreated neonate mice (Control, orange), and neonate mice after oral administration of (a) GCA (violet) or TCA (pink) and (b) βTMCA (light green) or UDCA (yellow) (Kruskal–Wallis test to controls with Dunn’s post-test and correction for multiple comparisons, median +/− interquartile range; *p = 0.0307; ***p = 0.0001, two-sided. n = 14 for UDCA and Control, n = 11 for GCA, n = 10 for TCA, n = 7 for βTMCA, n = 5 for Adult, and for subsequent analyses in this figure). c Richness (observed species) of the intestinal microbiota of untreated mice (Control) and mice after oral administration of GCA, TCA, βTMCA or UDCA (Kruskal-Wallis test to controls with Dunn’s post-test and correction for multiple comparisons, box represents IQR with median, whiskers represent minimum and maximum values; *p = 0.0319; **p = 0.0042, two-sided). d Bray-Curtis distance of untreated neonate mice (Control) and neonate mice after oral administration of GCA, TCA, βTMCA, or UDCA compared to adult animals (Kruskal–Wallis test to controls with Dunn’s post-test and correction for multiple comparisons, box represents IQR with median, whiskers represent minimum and maximum values; **p = 0.0026; ****p < 0.0001, two-sided). eg Relative abundance of the two most abundant genera Lactobacillus and Escherichia (e, f) and ratio of the abundance of Lactobacillus OTUs to Escherichia OTUs (g) in the microbiota of untreated neonate mice (Control) as compared to neonate mice after oral administration of GCA, TCA, βTMCA or UDCA (Kruskal-Wallis test to controls with Dunn’s post-test and correction for multiple comparisons, box represents IQR with median, whiskers represent minimum and maximum values; *p = 0.02; ****p < 0.0001, two-sided). The abundance of these genera (e, f) and the ratio of the abundance of Lactobaccillus OTUs to Echerichia OTUs (g) in adult mice (Adult) was added to allow visual comparison but was not included in the statistical evaluation (n = 5). Source data are provided as a Source Data file.
Fig. 5
Fig. 5. Differences in the impact of bile acids on the phylogenetic lactobacillus clusters.
ae Relative abundance of the Lactobacillus OTUs (a) BA OTU 7, (b) BA_OTU 364, (c) BA_OTU 4, (d) BA_OTU 798, and (e) BA_OTU 2 (Kruskal–Wallis test to controls with Dunn’s post-test and correction for multiple comparisons, box represents IQR with median, whiskers represent minimum and maximum values; (a)*, p = 0,0104; (c)*, p = 0,0161; **p = 0,0091; ***p = 0,0008, two-sided, n = 14 for UDCA and Control, n = 11 for GCA, n = 10 for TCA, n = 7 for βTMCA, n = 5 for Adult, and for subsequent analyses in this figure) in the small intestinal microbiota of adult mice (Adult), untreated neonate mice (Control) and neonate mice after oral administration of GCA, TCA, βTMCA, or UDCA. f Phylogenetic tree of lactobacilli (Ezbiocloud) based on the 16S rDNA gene. The three colored branches indicate the main clusters; identified OTUs are assigned to the clusters and highlighted in red (purple, BA_OTU 4; green, BA_OTU 798 and BA_OTU 2; orange, BA_OTU 7 and BA_OTU 364). The phylogentic tree was constructed by MEGA7 version 7.0.21 (MUSCLE) for alignment and iTOL v4 for the final annotations. Source data are provided as a Source Data file.

References

    1. Proctor LM, et al. The integrative human microbiome project. Nature. 2019;569:641–648. - PMC - PubMed
    1. Palmer C, Bik EM, DiGiulio DB, Relman DA, Brown PO. Development of the human infant intestinal microbiota. PLoS Biol. 2007;5:e177. - PMC - PubMed
    1. Bäckhed F, et al. Dynamics and stabilization of the human gut microbiome during the first year of life. Cell Host Microbe. 2015;17:852. - PubMed
    1. Hill CJ, et al. Evolution of gut microbiota composition from birth to 24 weeks in the INFANTMET Cohort. Microbiome. 2017;5:4. - PMC - PubMed
    1. Stewart CJ, et al. Temporal development of the gut microbiome in early childhood from the TEDDY study. Nature. 2018;562:583–588. - PMC - PubMed

Publication types

Substances

LinkOut - more resources