. 2020 Jul 23;11(1):3684.
doi: 10.1038/s41467-020-17502-z.

Microbial diversity drives carbon use efficiency in a model soil

Affiliations

Microbial diversity drives carbon use efficiency in a model soil

Luiz A Domeignoz-Horta et al. Nat Commun. .

Abstract

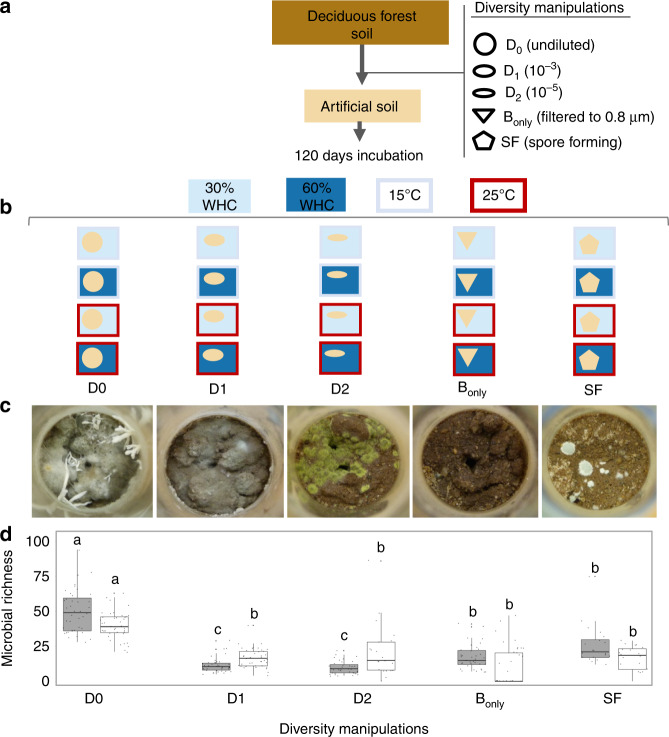
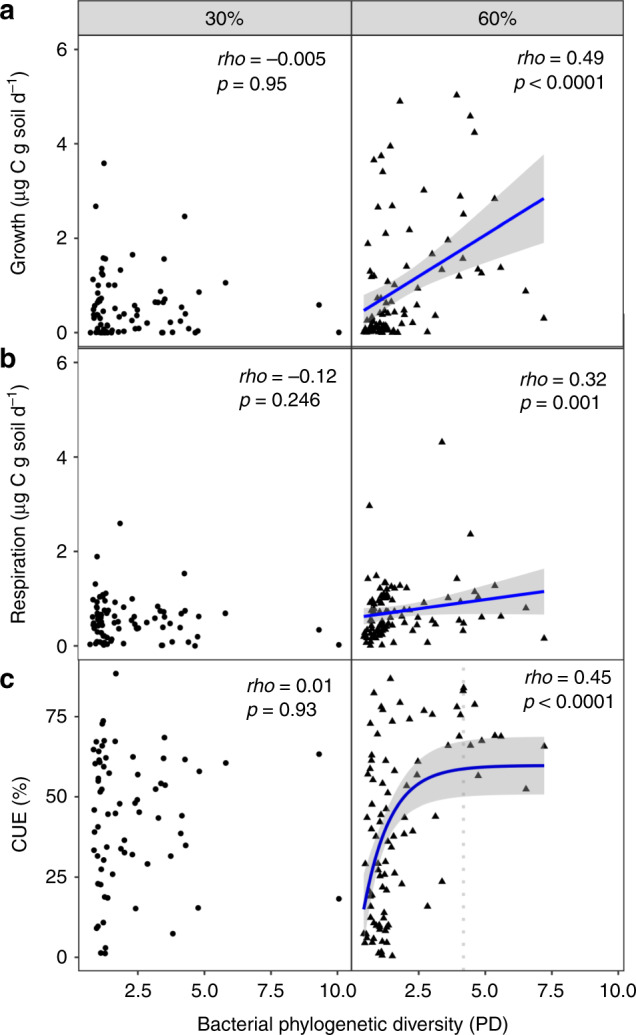
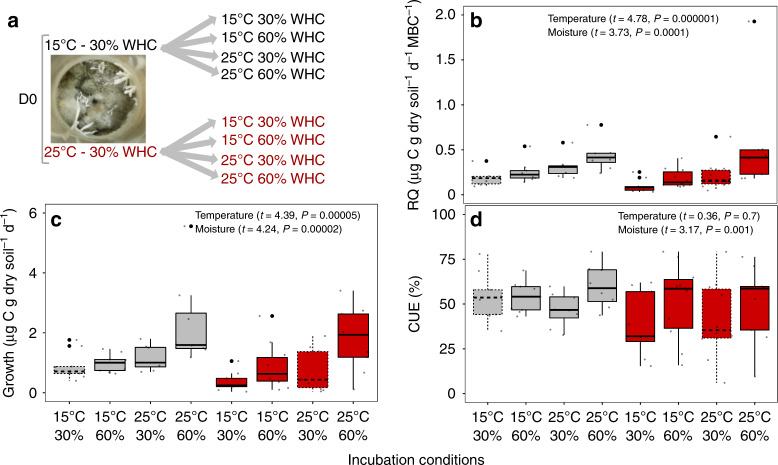
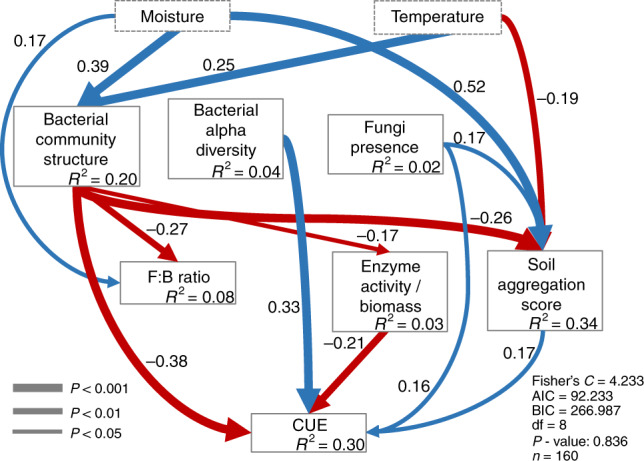
Empirical evidence for the response of soil carbon cycling to the combined effects of warming, drought and diversity loss is scarce. Microbial carbon use efficiency (CUE) plays a central role in regulating the flow of carbon through soil, yet how biotic and abiotic factors interact to drive it remains unclear. Here, we combine distinct community inocula (a biotic factor) with different temperature and moisture conditions (abiotic factors) to manipulate microbial diversity and community structure within a model soil. While community composition and diversity are the strongest predictors of CUE, abiotic factors modulated the relationship between diversity and CUE, with CUE being positively correlated with bacterial diversity only under high moisture. Altogether these results indicate that the diversity × ecosystem-function relationship can be impaired under non-favorable conditions in soils, and that to understand changes in soil C cycling we need to account for the multiple facets of global changes.


Conflict of interest statement

The authors declare no competing interests.

Figures

Fig. 1
Fig. 1. Experimental design for manipulation of microbial diversity.
The microbial diversity of a soil inoculum obtained from a temperate deciduous forest was manipulated by (1) sequential dilutions; (2) excluding fungi (“Bonly”); and (3) selecting for spore-forming microorganisms (SF) (a). These inocula were added to artificial soil incubated for 120 days under two moisture (30 and 60% water holding capacity) and two temperature (15 and 25 °C) regimes (b). Images of model soils at the end of incubation (c). Average bacterial (gray) and fungal (white) richness (operational taxonomic units) for each diversity treatment (d). Significant differences between treatments within a microbial group (bacteria or fungi) are indicated by different letters (one-way ANOVA followed by Tukey HSD test, P< 0.05, df = 171, n = 176 for bacteria and for fungi df = 156, n = 161). In the boxplots, whiskers denote the minimum value or 1.5× interquartile range (whichever is more extreme), and box denotes interquartile range. The horizontal line denotes the median. Points indicate biological replicates, n = 40 and 40 for D0 and D1, 35 and 21 for D2, 38 and 40 for Bonly and 23 and 20 for SF for bacteria and fungi, respectively.
Fig. 2
Fig. 2. Relationship between bacterial diversity and growth, respiration and CUE.
Relationship between bacterial phylogenetic diversity (PD) and growth (a), respiration (b), and CUE (c). Microcosms incubated under 30 and 60% WHC are shown on the left and right panels, respectively. Monotonic relationships between the diversity metric and growth, respiration or CUE are evaluated with Spearman correlation and when significant are indicated with a blue line. We fit linear curves for growth and respiration. Biologically, CUE cannot be >100%, thus we fit a saturating curve to the CUE data. The vertical dashed line indicates the threshold at which there is no more significant relationship between bacterial diversity (PD) and CUE. Shaded area denotes 95% confidence intervals. There were 84 and 92 replicates for 30% and 60% WHC, respectively.
Fig. 3
Fig. 3. Effect of short-term changes in temperature and moisture on respiration, growth and CUE.
Microbial communities from the less diluted treatment (D0) grown at both temperatures (15 and 25 °C) and at 30% water holding capacity (WHC) were incubated under all combinations of water content and temperatures (experimental outline; a). Influence of moisture and temperature shifts on respiratory quotient (RQ; b), growth (c), and CUE (d) in the model soils. We used linear mixed effect models to evaluate the impact of short-term changes in abiotic conditions on respiration, growth and CUE with microcosm as the random effect (n = 72, df = 51). Dashed boxplots represent the long-term soil incubation conditions. In the boxplots, whiskers denote the minimum value or 1.5× interquartile range (whichever is more extreme), and box denotes interquartile range. The horizontal line denotes the median. Points represent individual biological samples (n = 8 for each incubation condition).
Fig. 4
Fig. 4. Structural equation model showing the relative influence of soil abiotic and biotic factors on CUE.
Significant paths are shown in blue if positive or in red if negative. Path width corresponds to degree of significance as shown in the lower left. The amount of variance explained by the model (R2) is shown for each response variable, and measures of overall model fit are shown in the lower right. Bacterial community structure: axis 1 of NMDS; Bacterial alpha diversity: bacterial phylogenetic diversity index; Fungi presence: presence/absence of fungi; F:B ratio: 16S rRNA gene copy number g−1 soil: ITS gene copy number g−1 soil; Enzyme activity/Biomass: maximum activity recorded for Betaglucosidase/microbial biomass carbon. CUE: carbon use efficiency; Global goodness-of-fit: Fisher's C. Exact P values for each path coefficient are reported in Supplementary Table 1.

References

    1. Hooper DU, et al. A global synthesis reveals biodiversity loss as a major driver of ecosystem change. Nature. 2012;486:105–108. - PubMed
    1. Garcia FC, Bestion E, Warfield R, Yvon-Durocher G. Changes in temperature alter the relationship between biodiversity and ecosystem functioning. Proc. Natl Acad. Sci. USA. 2018;115:10989–10994. - PMC - PubMed
    1. IPCC. Intergovernmental panel on climate change 2013 the physical science basis: working group I. Contribution to the Fifth Assessment Report of the Intergovernmental Panel on Climate Change. (IPCC, 2014).
    1. Millennium Ecosystem Assessment. Ecosystems and Human Well-being: A Framework For Assessment (Island Press, Washington, DC, 2005).
    1. Cavicchioli R, et al. Scientists’ warning to humanity: microorganisms and climate change. Nat. Rev. Microbiol. 2019;17:569–686. - PMC - PubMed

Publication types

LinkOut - more resources