. 2020 Nov;5(11):1330-1339.
doi: 10.1038/s41564-020-0769-y. Epub 2020 Jul 23.

LY6E impairs coronavirus fusion and confers immune control of viral disease

Affiliations

LY6E impairs coronavirus fusion and confers immune control of viral disease

Stephanie Pfaender et al. Nat Microbiol. 2020 Nov.

Abstract

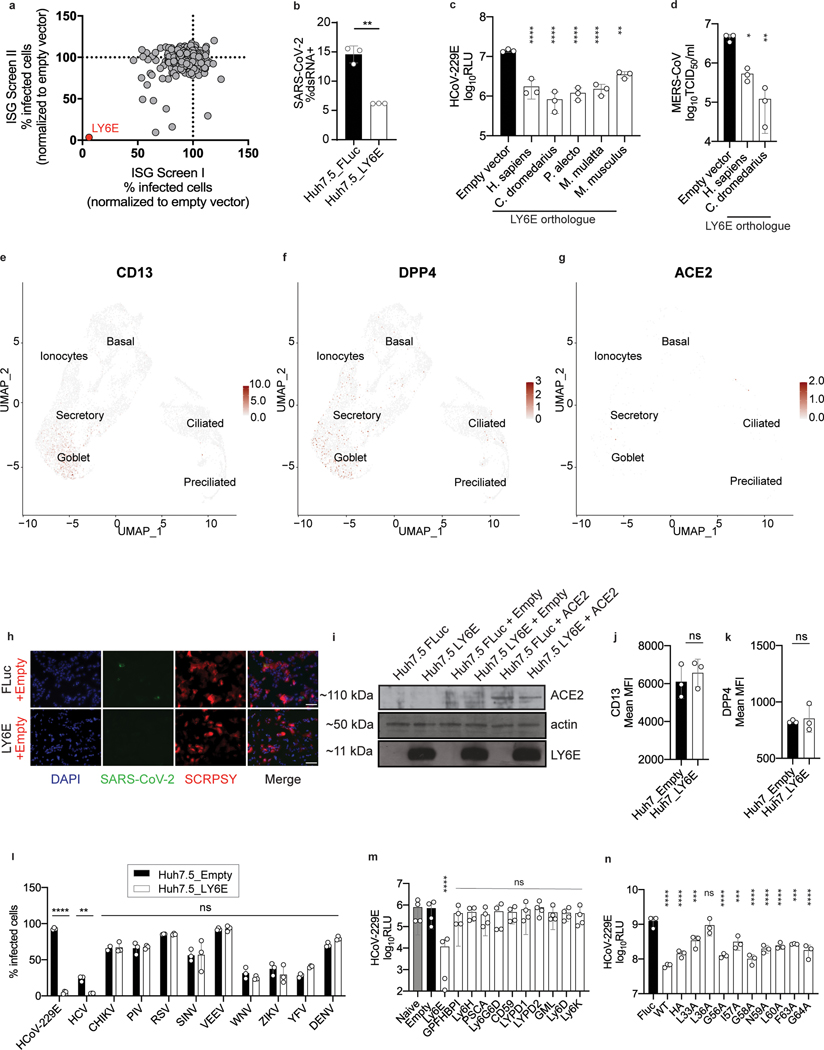
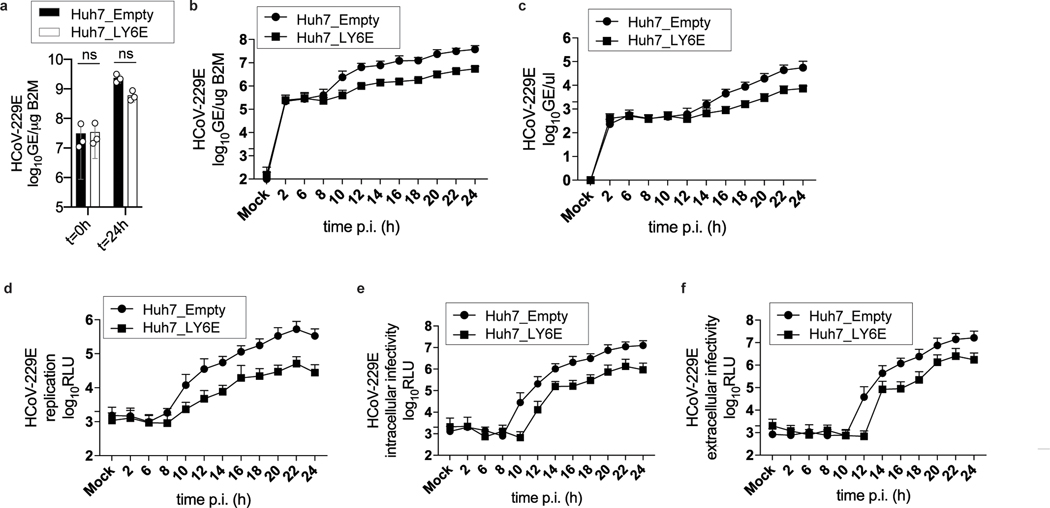
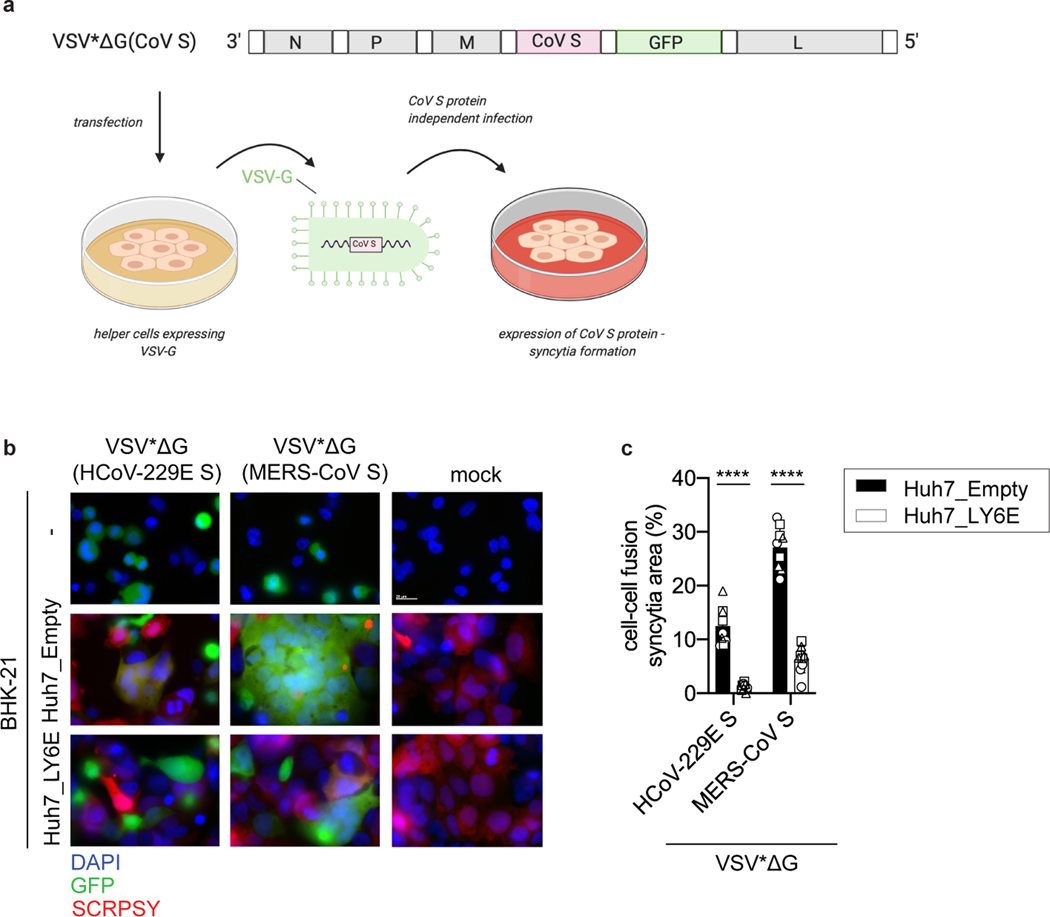
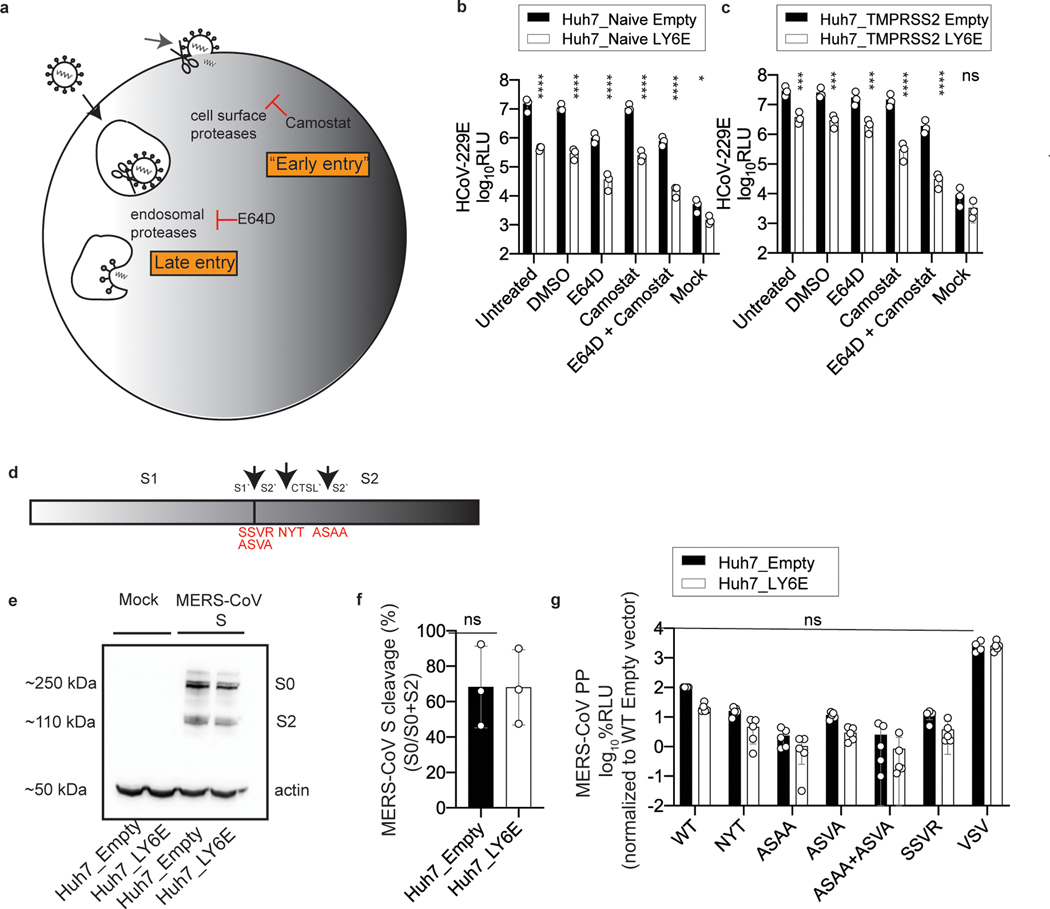
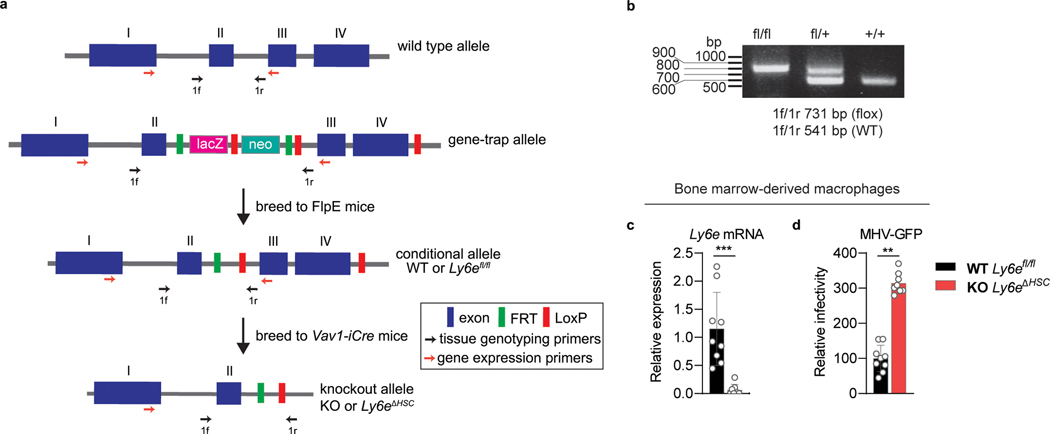
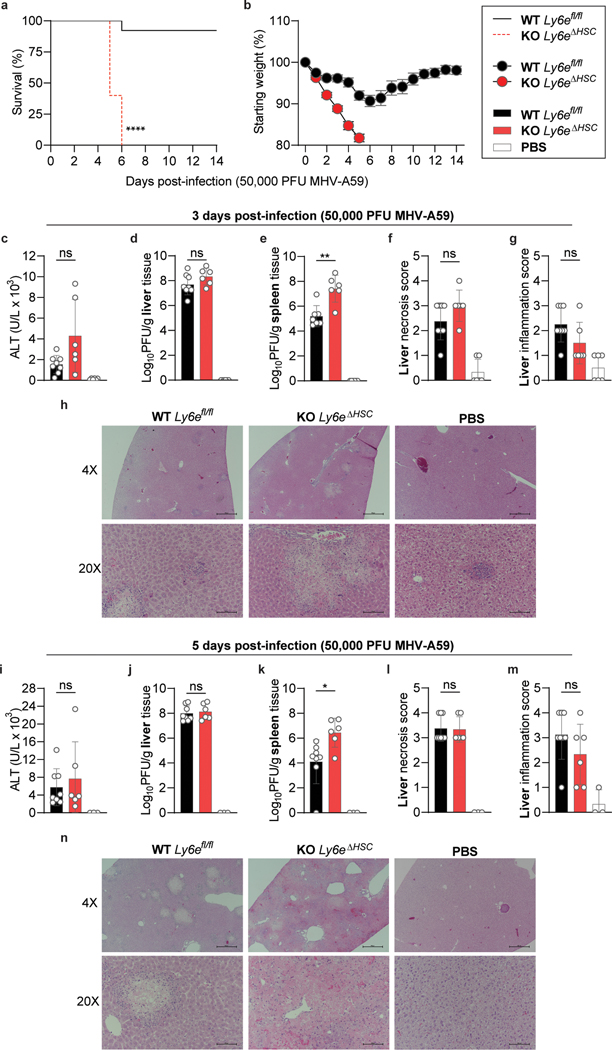
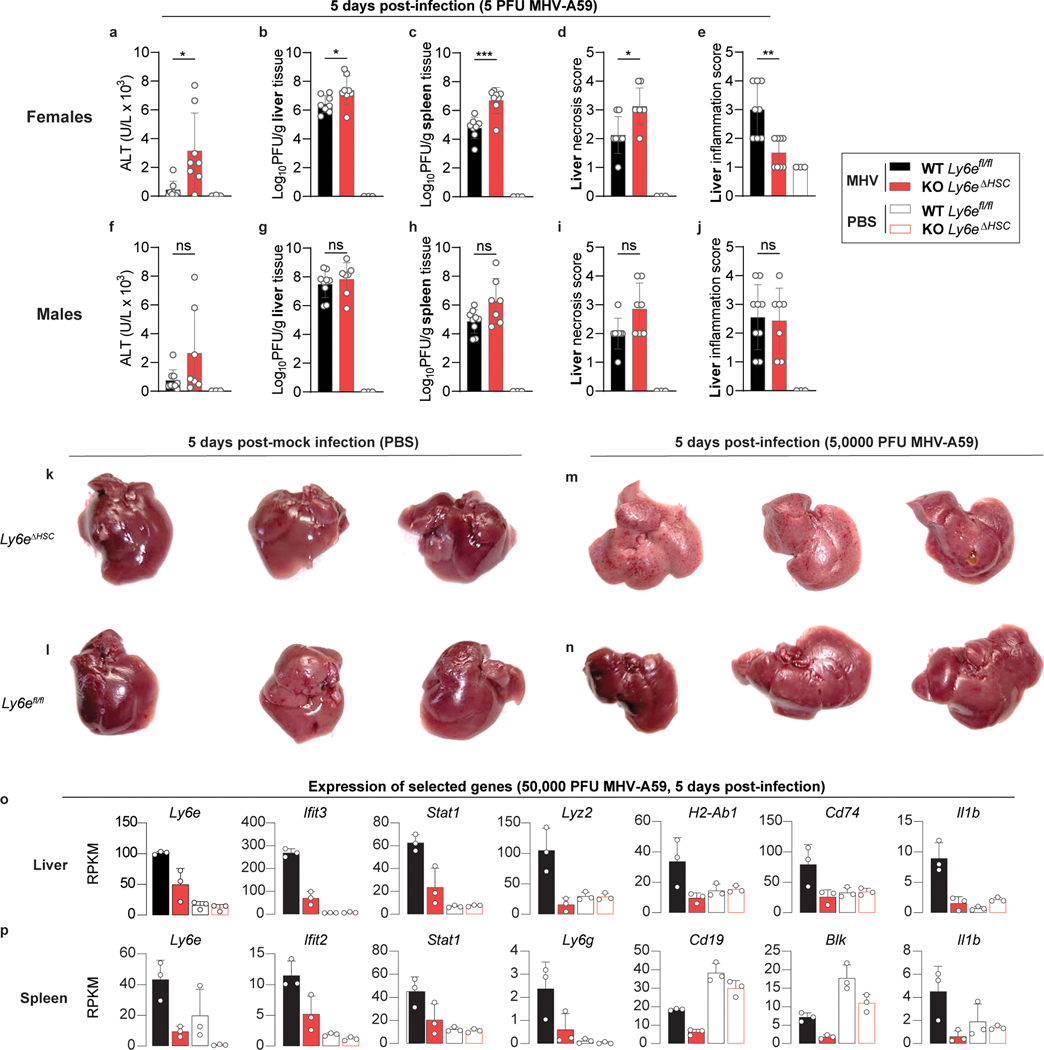
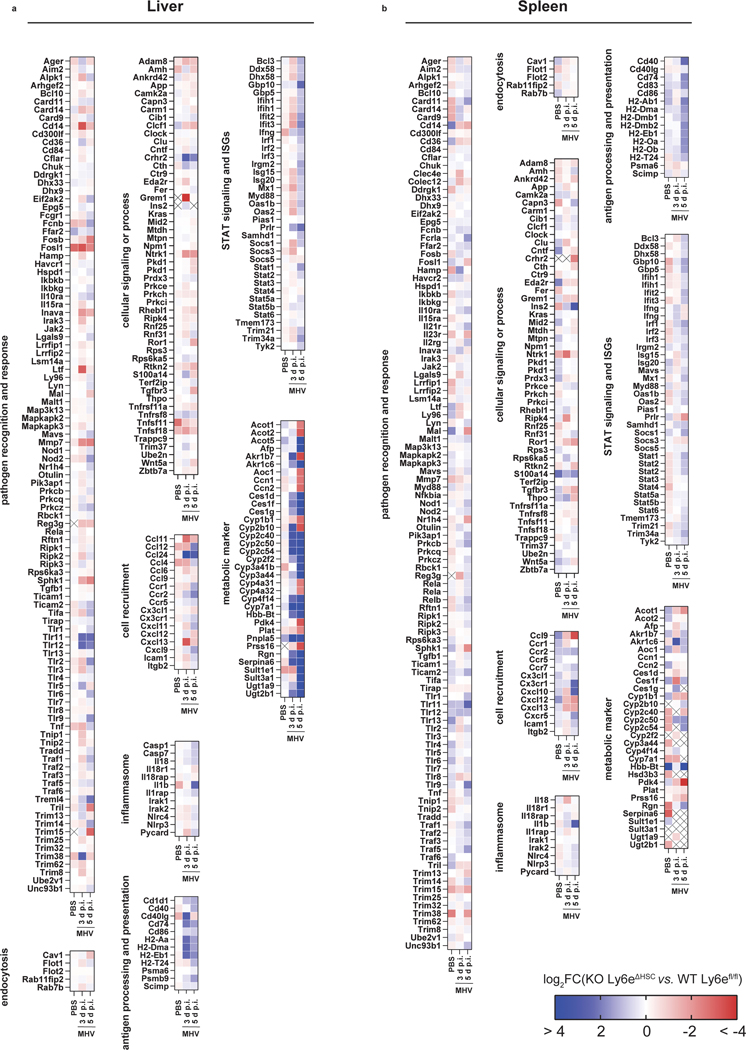
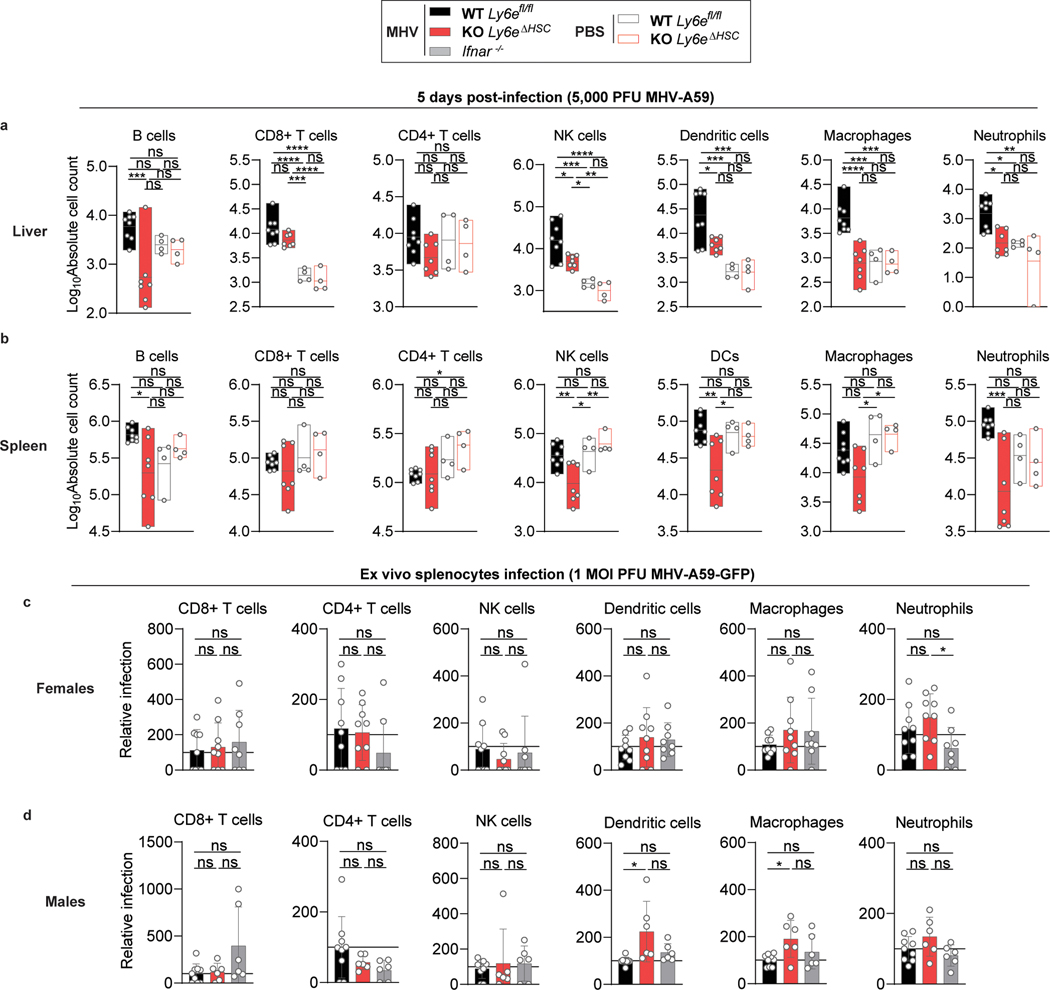
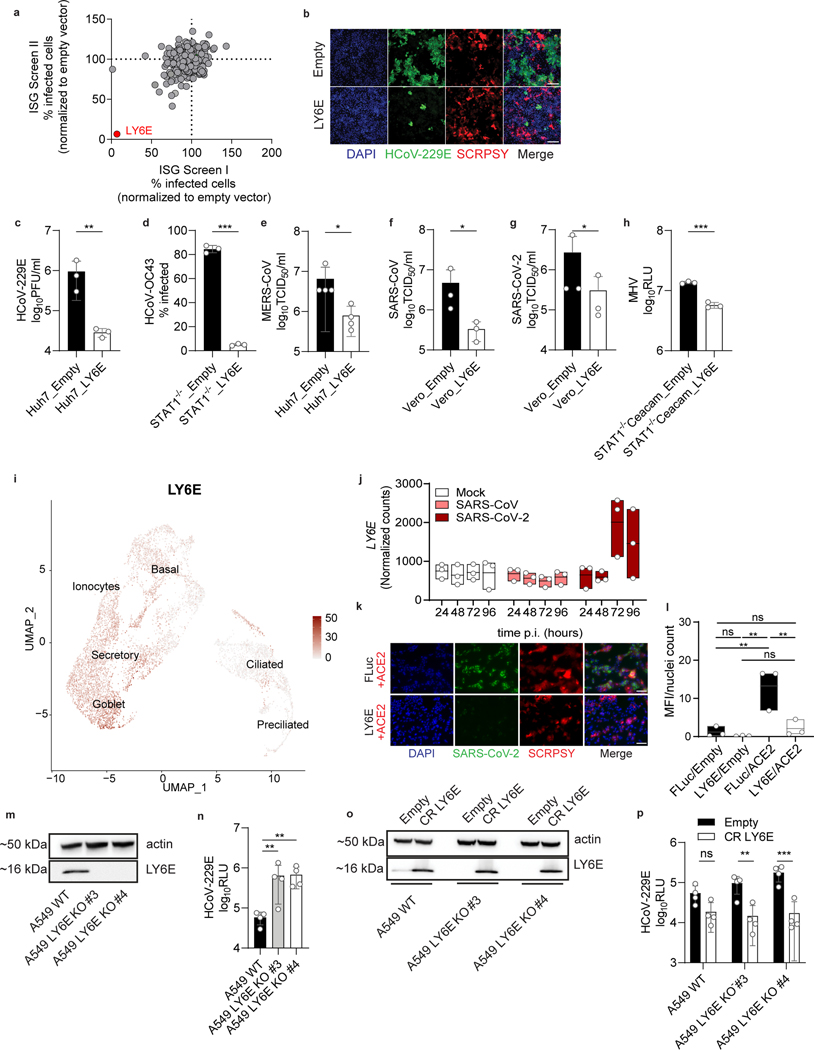
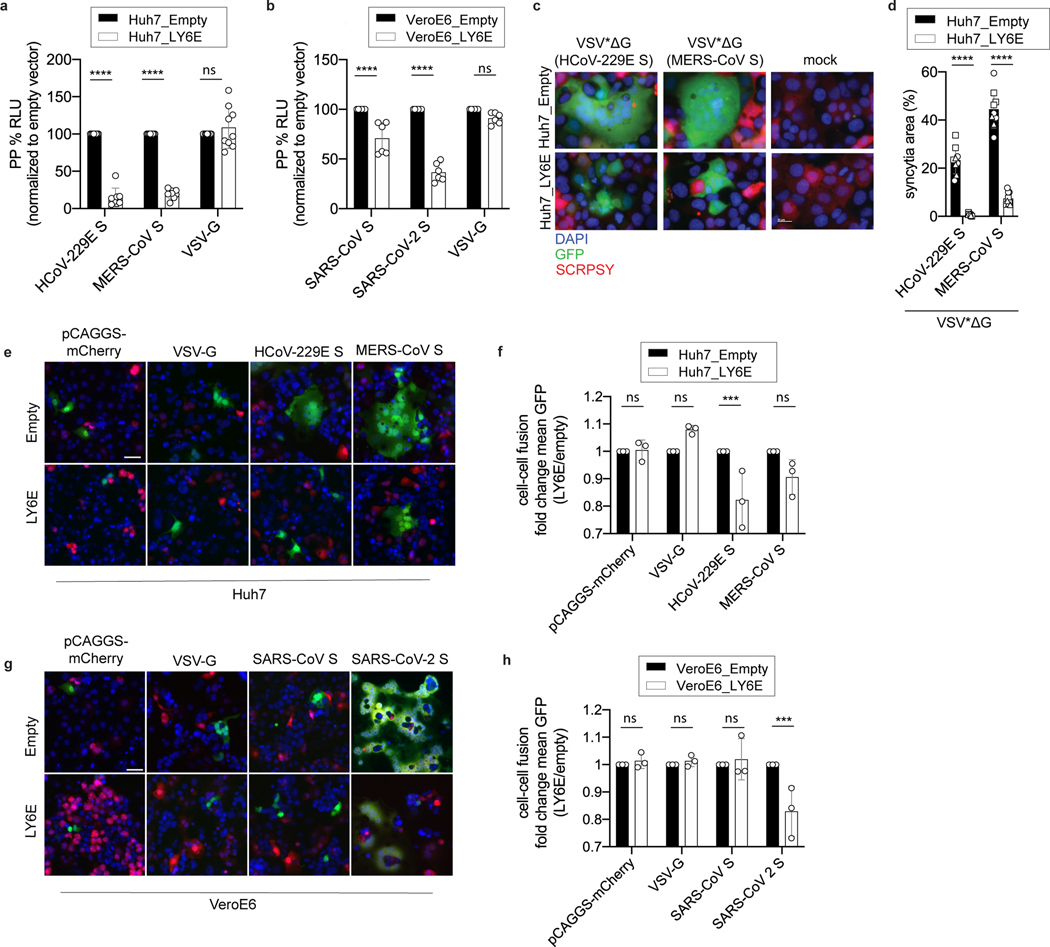
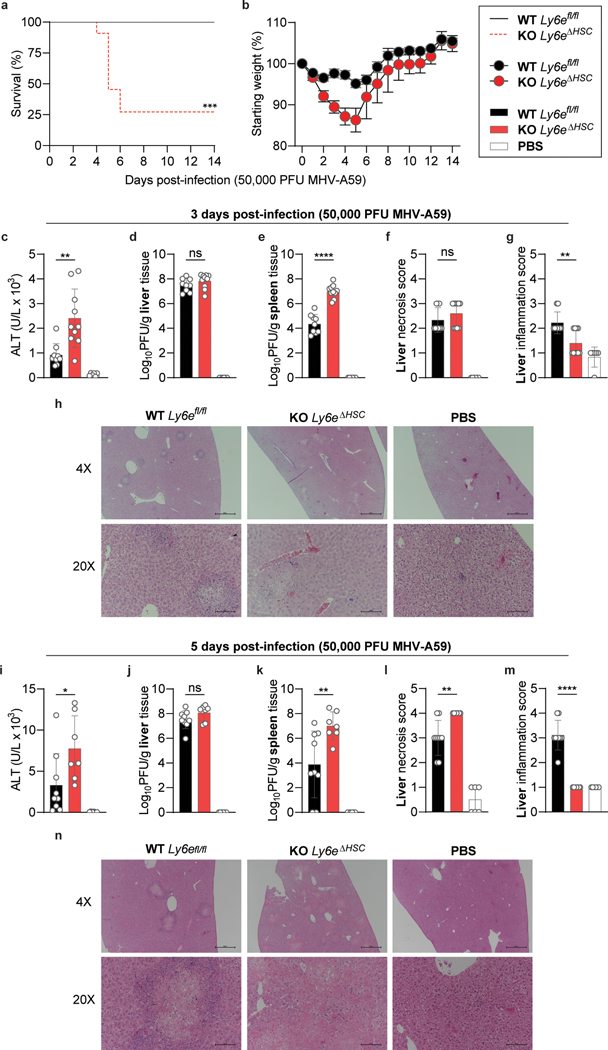
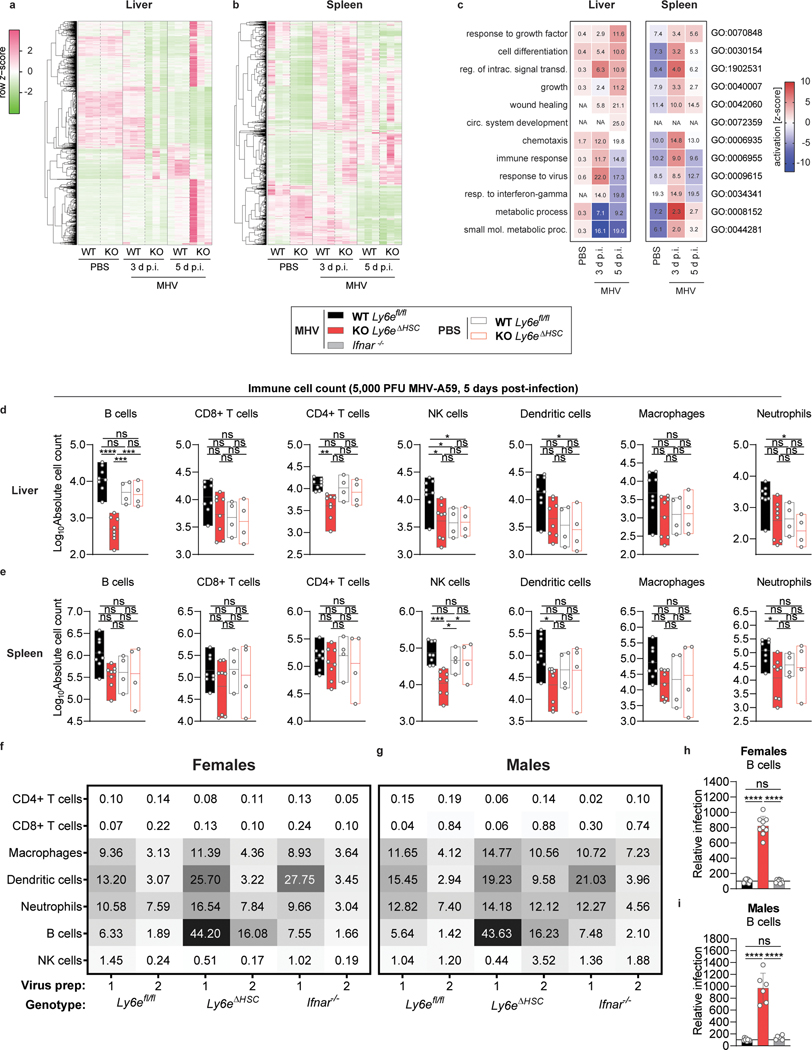
Zoonotic coronaviruses (CoVs) are substantial threats to global health, as exemplified by the emergence of two severe acute respiratory syndrome CoVs (SARS-CoV and SARS-CoV-2) and Middle East respiratory syndrome CoV (MERS-CoV) within two decades1-3. Host immune responses to CoVs are complex and regulated in part through antiviral interferons. However, interferon-stimulated gene products that inhibit CoVs are not well characterized4. Here, we show that lymphocyte antigen 6 complex, locus E (LY6E) potently restricts infection by multiple CoVs, including SARS-CoV, SARS-CoV-2 and MERS-CoV. Mechanistic studies revealed that LY6E inhibits CoV entry into cells by interfering with spike protein-mediated membrane fusion. Importantly, mice lacking Ly6e in immune cells were highly susceptible to a murine CoV-mouse hepatitis virus. Exacerbated viral pathogenesis in Ly6e knockout mice was accompanied by loss of hepatic immune cells, higher splenic viral burden and reduction in global antiviral gene pathways. Accordingly, we found that constitutive Ly6e directly protects primary B cells from murine CoV infection. Our results show that LY6E is a critical antiviral immune effector that controls CoV infection and pathogenesis. These findings advance our understanding of immune-mediated control of CoV in vitro and in vivo-knowledge that could help inform strategies to combat infection by emerging CoVs.


Figures

Extended Data Fig. 1
Extended Data Fig. 1. The antiviral activity of LY6E is conserved, independent of CoV receptors, and extends to HCV.
a, Duplicate screens depicting HCoV-229E infection (48 hours post-infection) in Huh7 cells expressing ISGs. b, SARS-CoV-2 infection of Huh7.5 cells expressing LY6E or a control (FLuc). c, HCoV-229E infection of Huh7.5 cells expressing vector control or human (H. sapiens), camel (C. dromedarius), bat (P. alecto), mouse (M. musculus), or rhesus (M. mulatta) LY6E orthologues. d, Stable LY6E or empty vector expressing Huh7.5 cells infected with MERS-CoV. e-g, UMAP visualization of CD13 (e) DPP4 (f), and ACE2 (g) expression and distribution among distinct cell types in hAEC cultures from 2 donors by scRNA-seq. h, SARS-CoV-2 infection of LY6E or control vector (FLuc) Huh7.5 cells co-expressing control vector (empty). Blue: DAPI, green: SARS-CoV-2 dsRNA, red: TagRFP encoded in SCRPSY-ACE2 vector. i, Western blot of Huh7.5 expressing LY6E or FLuc and empty vector or ACE2. j-k, Stable LY6E or empty vector expressing Huh7 cells were assessed for cell surface expression of CD13 (j) and DPP4 (k). l, Stable Huh7.5 cells expressing either LY6E or empty vector infected with HCoV-229E, HCV, CHIKV, hPIV-3, RSV, SINV, VEEV, WNV, ZIKV, YFV, and DENV. m, HCoV-229E-Rluc infection of naïve or stably transduced Huh7 cells expressing empty vector control or LY6/uPAR family members. n, HCoV-229E-Rluc infection of Huh7 cells expressing control vector (FLuc), LY6E WT, LY6E HA or specific block mutants. In h, scale bars are 100 μM. Immunofluorescence and western blot images are depicted exemplarily from n=3 (h) and n=3 (i). Data depicts mean of independent biological replicates, n=3 (b-d,j-n). Statistical significance was determined by two-tailed unpaired student’s t-test with Welch’s correction (b,j-k), ordinary one-way ANOVA with Dunnett`s correction for multiple comparison (c-d, m-n), two-way ANOVA followed by Sidak’s multiple comparisons test (l). Error bars: SD (b-d,j-n). P values (left-to-right): b, ** p=0.0098; c, **** p=<0.0001, ** p=0.0030; d, * p=0.0118, ** p=0.0013; l, **** p=>0.0001, ** p=0.0095; m, **** p=<0.0001; n, **** p=<0.0001, <0.0001, *** p=0.0005, **** p=<0.0001, *** p=0.0003, **** p=<0.0001, <0.0001, <0.0001, *** p=0.0001, **** p=<0.0001.
Extended Data Fig. 2
Extended Data Fig. 2. LY6E does not affect CoV binding, replication, translation, assembly, or release.
a, Stable LY6E expressing or empty control Huh7 cells were incubated with HCoV-229E and binding analyzed immediately (t=0 h) or after incubation for 24 hours (t=24 h) by RT-qPCR. b-f, Stable LY6E expressing or control Huh7 cells were mock-infected or infected with HCoV-229E-Rluc. Cell lysates were harvested at the indicated time points and intracellular viral RNA was extracted, and viral replication detected via qRT-PCR (b). Cell supernatant was harvested, extracellular viral RNA was extracted, and viral replication detected via qRT-PCR (c). Cell lysates were harvested, and intracellular Renilla luciferase activity was detected upon cell lysis (d). Cells were subjected to 3 rounds of freeze/thaw cycles. Cell debris was removed, and the supernatant titrated on naïve Huh7 cells. Intracellular infectivity was determined (e). Supernatant was harvested and titrated on naïve Huh7 cells to determine extracellular infectivity (f). Data represent mean of independent biological replicates, n=3 (a-f). Statistical significance was determined by two-way ANOVA followed by Sidak’s multiple comparisons test (a). Error bars: SD (a-f).
Extended Data Fig. 3
Extended Data Fig. 3. Generation of recombinant VSV vector driving CoV S protein expression (VSV*ΔG(CoV)) and heterologous cell-cell fusion assay.
a, Schematic depiction of the generation of recombinant VSV*ΔG(CoV S) expressing both CoV S protein and GFP reporter protein. The respective CoV S genes were inserted into the genomic VSV*ΔG cDNA and recombinant virus was generated in BHK-G43 cells expressing the VSV G protein. The recombinant virus produced in this way harbored the VSV G protein in the envelope allowing CoV S protein-independent infection of cells. Infection of cells with VSV*ΔG(CoV S) led to the expression of CoV S protein and consequent syncytia formation. b, Heterologous syncytia formation assay. BHK-21 cells were infected with VSV G protein trans-complemented VSV*ΔG(CoV S) viruses or were mock-infected, followed by co-culture with LY6E or empty control Huh7 cells. Syncytia formation was determined. Blue: DAPI, green: GFP, red: TagRFP encoded in SCRPSY vector. c, Quantification of VSV*ΔG(CoV S) induced syncytia depicted as percentage syncytia area. Three independent areas were analyzed per biological replicate (circle, square, triangle). Data represent mean of independent biological replicates, n=3 (c). In b, scale bar is 20 μM. Statistical significance was determined by two-way ANOVA followed by Sidak’s multiple comparisons test (c). Error bars: SD. P values: c (left-to-right), **** p=6.0 × 10⁻⁹, **** p=1.1 × 10⁻¹⁵.
Extended Data Fig. 4
Extended Data Fig. 4. The antiviral effect of LY6E is independent of proteolytic cleavage of CoV spike protein.
a, Schematic depiction of cell entry routes of CoVs and intervention by selected compounds. b-c, LY6E or empty control-expressing Huh7 cells naïve for (b) or ectopically overexpressing TMPRSS2 (c) were pre-treated with the indicated compounds before infection with HCoV-229E-Rluc. d, Schematic depiction of the CoV spike (S) protein containing the subunits S1 and S2. Arrows indicate the S1/S2’ cleavage site, a proposed cleavage site for cathepsin L (CTSL’) and the S2’ cleavage site. Amino acid exchanges disrupting the respective cleavage sites are depicted in red. e, Western blot of S cleavage in LY6E or empty control-expressing Huh7 cells transfected with a plasmid encoding for MERS-CoV S protein (S0= uncleaved, S2= S2 subunit). f, MERS CoV S cleavage was analyzed by quantification of S0 and S2 bands. g, LY6E or empty control-expressing Huh7 cells inoculated with CoV-pseudoparticles (pp) harboring MERS-CoV S WT or MERS-CoV S proteins containing various cleavage site mutations. Data represent mean of independent biological replicates, n=3 (b), n=3 (c), n=3 (e), n=3 (f), n=5 (g). Statistical significance was determined by two-way ANOVA followed by Sidak’s multiple comparisons (b-c, g) or two-tailed unpaired student’s t-test with Welch’s correction (f). Error bars: SD. P values (left-to-right): b, **** p=4.4 × 10⁻⁹, p=1.6 × 10⁻⁹, p=6.2 × 10⁻⁹, p=7.5 × 10⁻¹⁰, p=3.0 × 10⁻¹⁰, * p=0.0179; c, *** p=0.0007, p=0.0005, p=0.0006, **** p=4.8 × 10⁻⁸, p=1.8 × 10⁻⁸.
Extended Data Fig. 5
Extended Data Fig. 5. Generation of hematopoietic Ly6e conditional knockout mouse.
a, Strategy used to generate Ly6eΔHSC mice. Hematopoietic-tissue specific ablation of Ly6e was achieved by crossing Ly6efl/fl mice with transgenic Vav1-iCre mice to remove the LoxP-flanked exon III and IV, resulting in a 17 amino acid truncated variant of the 130 amino acid full-length protein. Primers used for tissue genotyping and gene expression are also depicted as arrows. b, Gel electrophoresis of tissue genotyping PCR, representing Ly6efl/fl, Ly6efl/+, and Ly6e+/+ mice. c, Ly6e gene expression in bone marrow-derived macrophages (BMDM). d, Infection of BMDM. For c-d, n=9 (Ly6efl/fl) or n=8 (Ly6eΔHSC) mice from three pooled experiments. The gel shown in b is representative of all genotyping performed to identify Ly6efl/fl mice. Data for c-d is shown normalized to Ly6efl/fl values. Statistical significance was determined by using two-tailed unpaired student’s t-test with Welch’s correction (c) or two-tailed ratio-paired t-test (d). Data are presented as mean values ± SD (c-d). P values: c, *** p=0.0010. d, ** p=0.0021.
Extended Data Fig. 6
Extended Data Fig. 6. Ly6eΔHSC mice are susceptible to mouse hepatitis virus.
a-b, Male Ly6efl/fl and Ly6eΔHSC mice injected with PBS or MHV and monitored for survival (a) and weight loss (b). c-n, Mice were euthanized at 3- (c-h) or 5- (i-n) days post-infection for determination of serum ALT (c,i), viral titers in liver (d,j) and spleen (e,k), and liver necrosis and inflammation (f-h, l-n). For a-b, n=15 for days 0–6, n=14 for days 6–14, (Ly6efl/fl), n=10 for days 0–5, n=4 for days 5–6, n=0 for days 6–14 (Ly6eΔHSC) from three pooled experiments. For c-g, n=8 (Ly6efl/fl,), n=6 (Ly6eΔHSC), or n=6 (PBS) from two pooled experiments; images shown in h are representative of the same cohorts. For i-m, n=8 (Ly6efl/fl,), n=6 (Ly6eΔHSC), or n=3 (PBS) from two pooled experiments; images shown in n are representative of the same cohorts. In h,n, scale bars are 500 μM (4x) and 100 μM (20x). Significance for was tested by two-sided Mantel-Cox test (a), two-tailed unpaired student’s t-test with Welch’s correction (c-e, i-k), two-tailed Mann-Whitney U test (f-g, l-m). Data are presented as mean values ± SEM (b) or SD (c-g, i-m). P value: a, **** p=3.946 × 10⁻⁶; e, ** p=0.0026; k, * p=0.0119.
Extended Data Fig. 7
Extended Data Fig. 7. Ly6eΔHSC mice have enhanced sensitivity to mouse hepatitis virus and a differential gene expression profile.
a-j, Female (a-e) and male (f-g) Ly6efl/fl and Ly6eΔHSC mice injected with PBS or MHV and assessed for serum ALT (a,f), viral titers in liver (b,g) and spleen (c,h), and liver necrosis and inflammation (d-e, i-j). k-n, Female Ly6efl/fl and Ly6eΔHSC mice injected with PBS or MHV and whole livers were imaged. Mock-infected (PBS) Ly6eΔHSC mice (k), mock-infected Ly6efl/fl mice (l), MHV-infected Ly6eΔHSC mice (m), MHV-infected Ly6efl/fl mice (n). o-p, Representative genes from transcriptomic analysis of liver (o) and spleen (p) from MHV-infected and PBS-injected female Ly6efl/fl and Ly6eΔHSC mice. For a-e, n=8 (Ly6efl/fl,), n=8 (Ly6eΔHSC), or n=3 (PBS) from two pooled experiments per sex. For f-j, n=9 (Ly6efl/fl,), n=7 (Ly6eΔHSC), or n=3 (PBS) two pooled experiments. For k-p, n=3. Statistical significance was determined by two-tailed unpaired student’s t-test with Welch’s correction (a-c, f-h), two-tailed Mann-Whitney U test (d-e, i-j). Data are presented as mean values ± SD (a-j; o-p). P value: a, * p=0.0234; b, * p=0.0428; c, *** p=0.0004; d, * p=0.0210; e, ** p=0.0054.
Extended Data Fig. 8
Extended Data Fig. 8. Dynamic transcriptional changes in liver and spleen of Ly6eΔHSC vs Ly6efl/fl mice.
Depicted are fold changes in liver and spleen gene expression from Ly6eΔHSC mice compared to Ly6efl/fl mice. RPKM values from RNA-seq data for liver (a) and spleen (b) were used to calculate fold changes. Crossed out genes were not detected in either KO or WT mice at respective conditions.
Extended Data Fig. 9
Extended Data Fig. 9. Gating strategy for intrahepatic and splenic immune cell identification.
Antibody-stained suspensions of isolated intrahepatic immune cells or splenic immune cells were first analyzed by forward scatter/side scatter to remove debris events, then gated for exclusion of a viability dye (Ghost Dye Violet 450), and finally for selection of single cell events. A dump-gate strategy was used to identify immune cell populations as indicated in the diagram. FITC-conjugated fluorophores were used for immunophenotyping experiments and PE-conjugated fluorophores were used for ex vivo infections.
Extended Data Fig. 10
Extended Data Fig. 10. Ly6e protects immune cells from mouse hepatitis virus infection.
a-b, Immune cell counts from liver (a) and spleen (b) of MHV-infected or PBS-injected male mice. c-d, Infection of cultured splenocytes from females (c) and males (d) normalized to average (line at 100) of Ly6efl/fl mice. For a-b, n=8 (infected Ly6efl/fl), n=7 (infected Ly6eΔHSC), n=4 PBS-injected from two pooled experiments. For c, n=9 (Ly6efl/fl and Ly6eΔHSC) and n=8 (Ifnar−/−) from four pooled experiments. For d, n=9 (Ly6efl/fl), n=6 (Ly6eΔHSC), or n=6 (Ifnar−/−) mice from four pooled experiments. Statistical significance was determined by one-way ANOVA with Tukey’s multiple comparisons test (a-d). For box plots, center line indicates mean and upper and lower bounds respectively indicate maximum and minimum replicate values (a-b). Data are presented as mean values ± SD (a-d). P values (top-bottom, then left-right): a, *** p=0.0008; **** p=5.6844 × 10⁻⁷, **** p=3.1123 × 10⁻⁶, **** p=2.337 × 10⁻⁵, *** p=0.0002; **** p=1.7135 × 10⁻⁵, *** p=0.0001, * p=0.0216, ** p =0.0075, * p=0.0494; *** p=0.0002, *** p=0.0002, ns p=0.9999, * p=0.0182; *** p=0.0004, *** p=0.0008, **** p=7.354 × 10⁻⁵; ** p=0.0011, * p=0.0421, * p=0.0160, b, * p=0.0215; * p=0.0449; ** p=0.0081, ** p=0.0022, * p=0.0131; ** p=0.0044, * p=0.0299; * p=0.0179, * p=0.0194; *** p=0.0007. c, * p=0.0288; d, * p=0.0104; * p=0.0240.
Figure 1.
Figure 1.. ISG screen identifies LY6E as a potent coronavirus restriction factor.
a, Duplicate screens depicting HCoV-229E infection (24 hours post-infection) in Huh7 cells ectopically expressing ISGs. b, HCoV-229E infection of Huh7 cells expressing LY6E or control vector (Empty). Blue: DAPI, green: HCoV-229E N protein, red: TagRFP encoded in SCRPSY vector. c-h, Effect of stable LY6E expression on diverse coronaviruses. Cells were infected with HCoV-229E (c), HCoV-OC43 (d), MERS-CoV (e), SARS-CoV (f), SARS-CoV-2 (g), MHV-Gluc (h). i, UMAP visualization of LY6E expression and distribution in primary hAEC cultures from 2 donors by scRNA-seq. j, Induction of LY6E in mock or infected hAEC from 3 donors by RNA-seq. k, SARS-CoV-2 infection of LY6E or control vector (FLuc) Huh7.5 cells co-expressing human ACE2. Blue: DAPI, green: SARS-CoV-2 dsRNA, red: TagRFP encoded in SCRPSY-ACE2 vector. l, Quantification of overall dsRNA fluorescence intensity normalized by number of nuclei in the image. m, Western blot of WT A549 or two LY6E KO clones (#3, #4). n, HCoV-229E infection of WT or LY6E KO A549. o, Western blot of WT or LY6E KO A549 reconstituted with CRISPR-resistant LY6E (CR LY6E) or control vector (Empty). p, HCoV-229E infection of CR LY6E-reconstituted WT or LY6E KO A549. Data represent mean of independent biological replicates, n=3 (c-d,f-h,j,l), n=4 (e,n,p). Immunofluorescence images are depicted exemplarily from n=2 (b) and n=3 (k). In l, seven images per condition were acquired and processed. In b, scale bars are 200 μM and in k, scale bars are 100 μM. Statistical significance was determined by two-tailed unpaired student’s t-test with Welch’s correction (c-d,f,h), one-tailed Mann-Whitney U test (e), two-tailed ratio paired student’s t-test (g), one-way ANOVA followed by Tukey’s multiple comparisons test (l), or two-way ANOVA followed by Sidak’s or Dunnett’s multiple comparison test (n,p). For box plots, center line indicates mean and upper and lower bounds respectively indicate maximum and minimum replicate values (j,l). Error bars: SD. P values: c, ** p=0.0088; d, *** p=0.0001; e, * p=0.0143; f, * p=0.0286; g, * p=0.0101; h, *** p=0.0010; l, ** p=0.0035, ** p=0.0091, **p=0.0057; n, ** p=0.0073, ** p=0.0033; p, ** p=0.0013, *** p=0.0001.
Figure 2.
Figure 2.. LY6E inhibits viral membrane fusion and syncytia formation.
a-b, VSV pseudoparticles (pp) harboring spike proteins from (a) HCoV-229E, MERS-CoV and G protein from VSV or (b) SARS-CoV, SARS-CoV-2 and G protein from VSV were inoculated on LY6E- or empty vector-expressing cells. Virus entry efficiency was quantified by measuring virus-encoded luciferase reporter activity. c, VSV pp expressing VSV G protein on their surface and encoding CoV S protein and GFP (VSV*ΔG(CoV S)) were inoculated with LY6E- or empty vector-expressing Huh7. Syncytia formation was analyzed by immunofluorescence microscopy. Blue: DAPI, green: GFP, red: TagRFP inserted in SCRPSY vector. d, Quantification of VSV*ΔG(CoV S)-induced syncytia depicted as percentage syncytia area. Three independent areas were analyzed per biological replicate (circle, square, triangle). e-h, Cell-cell fusion was analyzed by co-incubating cells transfected with plasmids encoding mCherry, VSV-G protein, or CoV S proteins and a split-luciferase/split-GFP construct together with CoV permissive LY6E-expressing or control cells transfected with the complementary fragment of split-luciferase/split-GFP. In e, g, GFP complementation was analyzed via immunofluorescence microscopy of GFP-positive syncytia. In f,h, four images per condition were acquired and processed. Data were normalized to empty control and are depicted as fold change mean GFP. Data represent mean of independent biological replicates, n=8 (HCoV-229E S, MERS-CoV-S) n=9 (VSV-G) (a), n=6 (b), n=3 (d), n=3 (f,h). Statistical significance was determined by two-way ANOVA followed by Sidak’s multiple comparison test (a-h). In c, scale bar is 20 μM, in e, g, scale bar is 50 μM. Error bars: SD (a-b, d, f, h). P values: a, **** p=3.3 × 10⁻¹⁶, **** p=3.6 × 10⁻¹⁵; b, **** p=1.363 × 10⁻⁶; **** p=4.200 × 10⁻¹⁴; d, **** p=6.0 × 10⁻⁹, p=<1.1 × 10⁻¹⁵; f, *** p=0.0008; h, *** p=0.0008.
Figure 3.
Figure 3.. Ly6eΔHSC mice are more susceptible to mouse hepatitis virus.
a-b, Female Ly6efl/fl and Ly6eΔHSC mice were injected with PBS or MHV and monitored for survival (a) and weight loss (b). c-n, Mice were assessed at 3 (c-h) or 5 (i-n) days post-infection for serum ALT (c,i), viral titers in liver (d,j) and spleen (e,k), and liver necrosis and inflammation (f-h, l-n). For a-b, n=13 for days 0–14 (Ly6efl/fl), n=11 for day 0–3, n= 10 for days 4–5, n=5 for days 5–6, n=3 for days 6–14 (Ly6eΔHSC) from three pooled experiments. For c-g, data represents mean value of n=9 (Ly6efl/fl), n=10 (Ly6eΔHSC), n=6 (PBS) from two pooled experiments; images in h are representative of the same cohorts. For i-m, data represents mean value of n=9 (Ly6efl/fl,), n=7 (Ly6eΔHSC), n=6 (PBS) from two pooled experiments; images in n are representative of the same cohorts. In h,n, scale bars are 500 μM (4x) and 100 μM (20x). Statistical significance was determined by two-sided Mantel-Cox test (a), two-tailed unpaired student’s t-test with Welch’s correction (c-e, i-k), two-tailed Mann-Whitney U test (f-g, l-m). Data are presented as mean values ± SEM (b) or SD (c-g, i-m). P values: a, *** p=0.0002; c, ** p=0.0031; e, **** p=5.759 × 10⁻⁷; g, ** p=0.0054; i, * p=0.0430; k, ** p=0.0094; l, ** p=0.0072; m, **** p=8.741 × 10⁻⁵.
Figure 4.
Figure 4.. Hematopoietic Ly6e protects against mouse hepatitis virus-induced alterations in liver and spleen.
a-c, Transcriptomic analyses from female Ly6efl/fl (WT) and Ly6eΔHSC (KO) mice. a-b, Heat maps displaying significant changes (mean RPKM > 0.5; fold change > 2; FDR ≤ 0.05) in liver (a) and spleen (b). Dendrograms are normalized read data (row z-score) clustered with complete linkage method employing Spearman Rank correlation distance measurement. c, Pathway analysis of KO versus WT. Up- (red) or down-regulated (blue) pathways indicated by activation z-score. Numbers show significantly dysregulated genes as percentage of total gene number included in pathway. d-e, Immune cell counts from liver (d) and spleen (e) of female mice. f-g, Heatmap of average MHV-GFP infectivity of cultured splenocytes from female (f) and male (g) mice with two independent viral preparations. h-i, MHV-GFP infection of splenic B cells from females (h) and males (i) normalized to average (line at 100) of Ly6efl/fl mice. For a-c, n=3. For d-e, n=8 MHV-injected, n=4 PBS-injected from two pooled experiments. For f,h, n=9 (Ly6efl/fl and Ly6eΔHSC) and n=8 (Ifnar−/−) from four pooled experiments. For g,i, n=9 (Ly6efl/fl), n=6 (Ly6eΔHSC), and n=6 (Ifnar−/−). Significance for d-e, h-i was determined by one-way ANOVA with Tukey’s multiple comparisons test. For box plots, center line indicates mean and upper and lower bounds respectively indicate maximum and minimum replicate values (d-e). Error bars: SD (h-i). P values (top-bottom, then left-right): d, **** p=4.242 × 10⁻⁷, *** p=8.902 × 10⁻⁴, *** p=4.581 × 10⁻⁴; ** p=0.0030; * p=0.0436, * p=0.0381, * p=0.0148; * p=0.237; * p=0.0173; e,*** p=8.395 × 10⁻⁴, * p=0.0414, * p=0.0439; * p=0.0233; * p=0.0295; h, **** p=1.1 × 10⁻¹⁴, **** p=1.2 × 10⁻¹⁴. i, **** p=1.1416 × 10⁻⁹, **** p=1.0469 × 10⁻⁸.

Update of

References

    1. Zhu N. et al. A Novel Coronavirus from Patients with Pneumonia in China, 2019. N Engl J Med, doi: 10.1056/NEJMoa2001017 (2020). - DOI - PMC - PubMed
    1. Drosten C. et al. Identification of a novel coronavirus in patients with severe acute respiratory syndrome. N Engl J Med 348, 1967–1976, doi: 10.1056/NEJMoa030747 (2003). - DOI - PubMed
    1. Zaki AM, van Boheemen S, Bestebroer TM, Osterhaus AD & Fouchier RA Isolation of a novel coronavirus from a man with pneumonia in Saudi Arabia. N Engl J Med 367, 1814–1820, doi: 10.1056/NEJMoa1211721 (2012). - DOI - PubMed
    1. Kindler E, Thiel V & Weber F Interaction of SARS and MERS Coronaviruses with the Antiviral Interferon Response. Adv Virus Res 96, 219–243, doi: 10.1016/bs.aivir.2016.08.006 (2016). - DOI - PMC - PubMed
    1. Corman VM, Muth D, Niemeyer D & Drosten C Hosts and Sources of Endemic Human Coronaviruses. Adv Virus Res 100, 163–188, doi: 10.1016/bs.aivir.2018.01.001 (2018). - DOI - PMC - PubMed

Publication types

MeSH terms

Grants and funding