. 2017 Dec 1;1(4):570-584.
doi: 10.2527/tas2017.0063. eCollection 2017 Dec.

National Beef Quality Audit-2016: Transportation, mobility, live cattle, and carcass assessments of targeted producer-related characteristics that affect value of market cows and bulls, their carcasses, and associated by-products

Affiliations

National Beef Quality Audit-2016: Transportation, mobility, live cattle, and carcass assessments of targeted producer-related characteristics that affect value of market cows and bulls, their carcasses, and associated by-products

M K Harris et al. Transl Anim Sci. .

Abstract

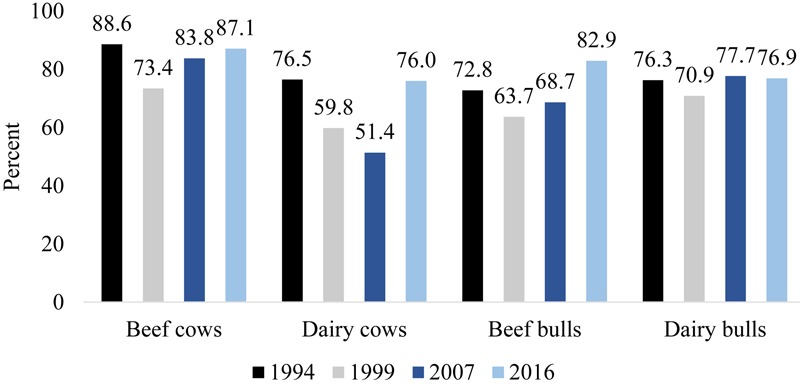
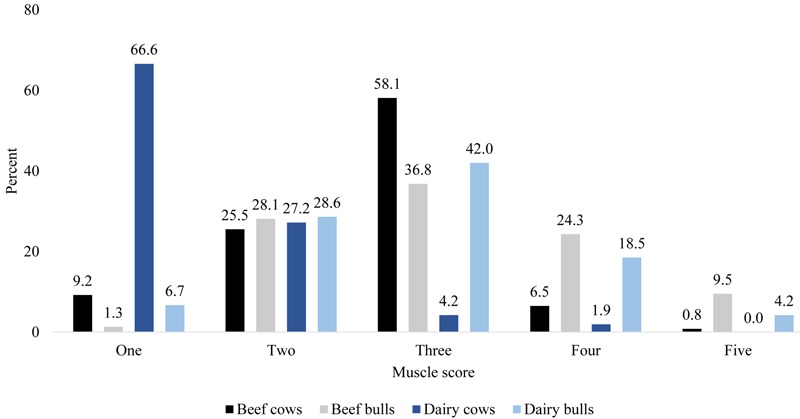
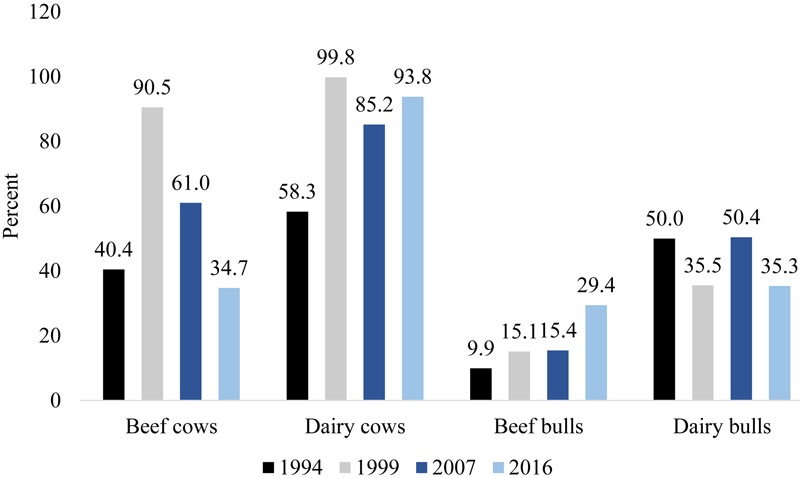
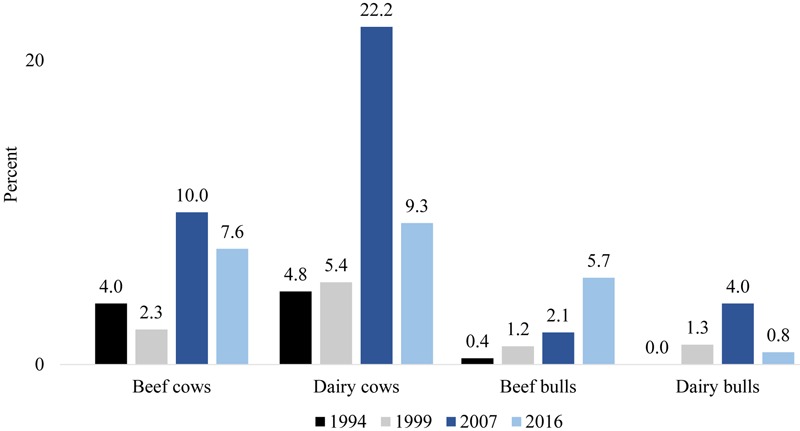
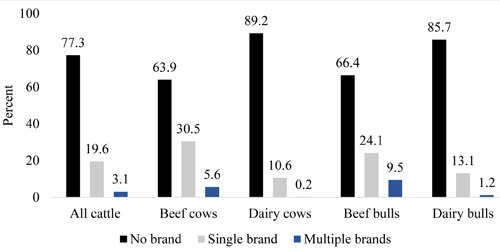
The National Beef Quality Audit-2016 marks the fourth iteration in a series assessing the quality of live beef and dairy cows and bulls and their carcass counterparts. The objective was to determine the incidence of producer-related defects, and report cattle and carcass traits associated with producer management. Conducted from March through December of 2016, trailers (n = 154), live animals (n = 5,470), hide-on carcasses (n = 5,278), and hide-off hot carcasses (n = 5,510) were surveyed in 18 commercial packing facilities throughout the United States. Cattle were allowed 2.3 m2 of trailer space on average during transit indicating some haulers are adhering to industry handling guidelines for trailer space requirements. Of the mixed gender loads arriving at processing facilities, cows and bulls were not segregated on 64.4% of the trailers surveyed. When assessed for mobility, the greatest majority of cattle surveyed were sound. Since the inception of the quality audit series, beef cows have shown substantial improvements in muscle. Today over 90.0% of dairy cows are too light muscled. The mean body condition score for beef animals was 4.7 and for dairy cows and bulls was 2.6 and 3.3, respectively. Dairy cattle were lighter muscled, yet fatter than the dairy cattle surveyed in 2007. Of cattle surveyed, most did not have horns, nor any visible live animal defects. Unbranded hides were observed on 77.3% of cattle. Carcass bruising was seen on 64.1% of cow carcasses and 42.9% of bull carcasses. However, over half of all bruises were identified to only be minor in severity. Nearly all cattle (98.4%) were free of visible injection-site lesions. Current results suggest improvements have been made in cattle and meat quality in the cow and bull sector. Furthermore, the results provide guidance for continued educational and research efforts for improving market cow and bull beef quality.

Keywords: audit; beef quality; bull; cow; dairy.


Figures

Figure 1.
Figure 1.
National Beef Quality Audit (NBQA): Percentage of sound (normal mobility) cattle observed in each of the National Market Cow and Bull Beef Quality Audits. Total number of observations were National Non-Fed Beef Quality Audit-1994: beef cows (n = 1,548), dairy cows (n = 1,013), beef bulls (n = 254), dairy bulls (n = 38); National Market Cow and Bull Beef Quality Audit-1999: beef cows (n = 2,237), dairy cows (n = 1,108), beef bulls (n = 419), dairy bulls (n = 79); NMCBBQA-2007: beef cows (n = 2,807), dairy cows (n = 2,112), beef bulls (n = 431), dairy bulls (n = 130); NBQA–2016: beef cows (n = 1,557), dairy cows (n = 1,743), beef bulls (n = 321), dairy bulls (n = 52; Smith et al., 1994; Roeber et al., 2000; Nicholson, 2008).
Figure 2.
Figure 2.
National Beef Quality Audit (NBQA): Frequency of muscle scores observed in surveyed animals. Muscle score was determined based on a 5-point scale: 1 = extremely light muscled, 3 = average muscled, 5 = extremely heavy muscled. Total number of observations were beef cows (n = 1,860), dairy cows (n = 2,809), beef bulls (n = 399), dairy bulls (n = 119).
Figure 3.
Figure 3.
National Beef Quality Audit (NBQA): A comparison between the percentage of cattle that were inadequately muscled (assigned a muscle score 1 (extremely light muscled) and 2 (light muscled) on a 5-point scale) in 1994, 1999, 2007, and 2016. Total number of observations were National Non-fed Beef Quality Audit–1994: beef cows (n = 1,548), dairy cows (n = 1,013), beef bulls (n = 254), dairy bulls (n = 38); National Market Cow and Bull Beef Quality Audit–1999: beef cows (n = 2,237), dairy cows (n = 1,108), beef bulls (n = 419), dairy bulls (n = 79); NMCBBQA–2007: beef cows (n = 2,501), dairy cows (n = 1,954), beef bulls (n = 385), dairy bulls (n = 127); NBQA–2016: beef cows (n = 1,860), dairy cows (n = 2,809), beef bulls (n = 399), dairy bulls (n = 119; Smith et al., 1994; Roeber et al., 2000; Nicholson, 2008).
Figure 4.
Figure 4.
National Beef Quality Audit (NBQA): A comparison between the percentage of cattle that were assigned “too low” of a body condition score (beef score 1 and 2 (extremely thin) on a 9-point scale; dairy score 1.0 and 1.5 (extremely thin) on a 5-pt scale) in 1994, 1999, 2007, and 2016. Total number of observations were National Non-fed Beef Quality Audit–1994: beef cows (n = 1,548), dairy cows (n = 1,013), beef bulls (n = 254), dairy bulls (n = 38); National Market Cow and Bull Beef Quality Audit–1999: beef cows (n = 2,237), dairy cows (n = 1,108), beef bulls (n = 419), dairy bulls (n = 79); NMCBBQA–2007: beef cows (n = 2,800), dairy cows (n = 2,103), beef bulls (n = 431), dairy bulls (n = 124); NBQA–2016: beef cows (n = 1911), dairy cows (n = 2,878), beef bulls (n = 406), dairy bulls (n = 121; Smith et al., 1994; Roeber et al., 2000; Nicholson, 2008). Dairy cattle in 1994 and 1999 were condition scored based on the same 9-point scale as beef cattle.
Figure 5.
Figure 5.
National Beef Quality Audit (NBQA): A comparison between the percentage of cattle that were over-conditioned [beef score 8 and 9 (extremely fat) on a 9-point scale; dairy score 4.5 and 5.0 (extremely fat) on a 5-pt scale] in 1994, 1999, 2007, and 2016. Total number of observations were National Non-fed Beef Quality Audit–1994: beef cows (n = 1,548), dairy cows (n = 1,013), beef bulls (n = 254), dairy bulls (n = 38); National Market Cow and Bull Beef Quality Audit–1999: beef cows (n = 2,237), dairy cows (n = 1,108), beef bulls (n = 419), dairy bulls (n = 79); NMCBBQA–2007: beef cows (n = 2,800), dairy cows (n = 2,103), beef bulls (n = 431), dairy bulls (n = 124); NBQA–2016: beef cows (n = 1,911), dairy cows (n = 2,878), beef bulls (n = 406), dairy bulls (n = 121; Smith et al., 1994; Roeber et al., 2000; Nicholson, 2008). Dairy cattle in 1994 and 1999 were condition-scored based on the same 9-point scale as beef cattle.
Figure 6.
Figure 6.
National Beef Quality Audit (NBQA): Distribution of defects observed on cattle surveyed. Total number of observations were beef cows (n = 1,912), dairy cows (n = 2,855), beef bulls (n = 402), dairy bulls (n = 120). Defects included: bottle teats, broken penis, failed suspensory ligament, foot abnormality, full bag, lumpy jaw, mastitis, multiple udder problems, retained placenta, swollen joints, and warts.
Figure 7.
Figure 7.
National Beef Quality Audit (NBQA): Distribution of live animal defects pertinent to all surveyed cattle. Total number of observations were beef cows (n = 1,913), dairy cows (n = 2,856), beef bulls (n = 402), dairy bulls (n = 120).
Figure 8.
Figure 8.
National Beef Quality Audit (NBQA): Distribution of defects associated with reproductive soundness in cows. Total number of observations were beef cows (n = 1,913) and dairy cows (n = 2,856).
Figure 9.
Figure 9.
National Beef Quality Audit (NBQA): Percentage of cattle with no brands, single brands and multiple brands. Total number of observations were all cattle (n = 5,262), beef cows (n = 2,106), dairy cows (n = 2,618), beef bulls (n = 403), dairy bulls (n = 84).

References

    1. Beef Quality Assurance Advisory Board. n.d Beef quality assurance national manual. Centennial, Colorado: http://www.bqa.org/Media/BQA/Docs/nationalmanual.pdf (accessed 28 February 2017).
    1. Boleman S. L., Boleman S. J., Morgan W. W., Hale D. S., Griffin D. B., Savell J. W., Ames R. P., Smith M. T., Tatum J. D., Field T. G., Smith G. C., Gardner B. A., Morgan J. B., Northcutt S. L., Dolezal H. G., Gill D. R., Ray F. K. 1998. National Beef Quality Audit-1995: Survey of producer-related defects and carcass quality and quantity attributes. J. Anim. Sci. 76:96–103. doi:10.2527/1998.76196x - DOI - PubMed
    1. Cook N. B., Nordlund K. V. 2009. The influence of the environment on dairy cow behavior, claw health and herd lameness dynamics. Vet. J. 179:360–369. doi:10.1016/j.tvjl.2007.09.016 - DOI - PubMed
    1. Elanco Animal Health 2009. The 5-point body condition scoring system. https://www.elanco.us/pdfs/ai10752-body-condition-score-insert.pdf (accessed 2 January 2017).
    1. Eversole D. E., Browne M. F., Hall J. B., Dietz R. E. 2009. Body condition scoring beef cows. https://www.pubs.ext.vt.edu/400/400-795/400-795.html (accessed 19 April 2017).

LinkOut - more resources