

Potential risk factors related to pig body weight variability from birth to slaughter in commercial conditions
- PMID: 32704721
- PMCID: PMC7200415
- DOI: 10.1093/tas/txy082
Potential risk factors related to pig body weight variability from birth to slaughter in commercial conditions
Abstract
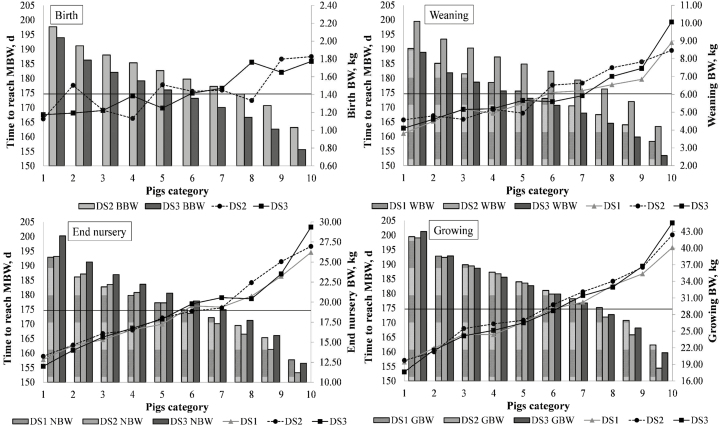
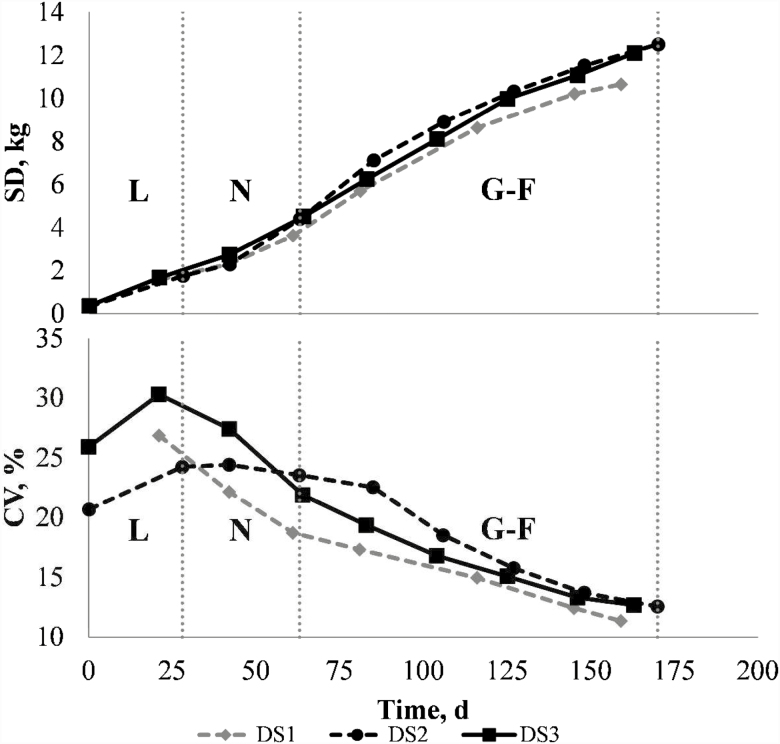
The aim of this observational study is to identify risk factors associated with body weight (BW) variability in three data sets (DS) in commercial conditions. A total of 1,009 (DS1), 460 (DS2), and 1304 (DS3) male and female crossbreed pigs (Pietrain × [Landrace × Large White]), respectively, were included in each trial. Pigs were periodically weighed until slaughter. Then, variables such as length of gestation, length of lactation, parity, litter size, sex, birth BW, and ADG were considered. Pigs remaining on the farm after two loads to the slaughterhouse were defined as last group of animals sent to slaughterhouse (LGS). Descriptive statistics of variability were calculated, and a risk analysis approach was used to look for the factors related to LGS. A multiple logistic regression was performed to identify all variables that were significant (P < 0.05). The risk ratio (RR), odds ratio (OR), and population attributable risk (PAR) were calculated for all of the significant variables after transforming all of them into binary factors using the 25th percentile as the cut-off point. Results showed that the major part of the variability (as CV) comes from birth (20% to 25%) and increased only a little during lactation and 14-d post weaning. From this point onwards, CV tended to decrease, as pigs got closer to the marketing weight (down 11.5% to 12.7%). Regarding the indicators selected, RR, OR, and PAR presented similar trends in the three DS studied. Therefore, for the variables finally included, these indicators had their minimum values at the start of the cycle and then gradually increased at the end. Those results, based on an epidemiological approach, suggest that the closer to the end of the cycle the greater the probability for a light piglet of being/becoming LGS. It might be explained by the shorter available time to efficiently implement preventive measures aimed to improve the performance of delayed pigs and, thus, reducing variability.Those results, based on an epidemiological approach, make sense as the probability for a light piglet to be a LGS increases the closer to the end of the cycle, due to the short time to implement preventive measures and increase the performance of delayed pigs and reduce variability. The differential PAR associated with both, the nursery and the growing period, was 1.7% and 1.5% for DS1, 5.1% and 3.1% for DS2, and 3.7% and 2.8% for DS3. For the lactation period, the results were 4.3% for DS2 and 4.5% for DS3. Results suggest that the most critical periods, in relation to retardation of growth in swine, are lactation and nursery. Implementing measures that maintain risk factors under or above thresholds, especially in the initial phases of growth, will reduce the percentage of LGS pigs and positively affect the overall homogeneity of the batch.
Keywords: coefficient of variation; correlation; growth curves; pigs; risk factors; variability.
© The Author(s) 2018. Published by Oxford University Press on behalf of the American Society of Animal Science.
Figures
References
-
- Backstrom L., and Bremer H.. 1976. Disease recording of pigs at slaughter as a method of preventive medicine in the swine production. Svensk Veterinärtidning Tidningen 28:312–336.
-
- Banco de datos de referencia del porcino español (BdPorc).. 2016. [accessed February, 2018]. http://www.bdporc.irta.es/informes/PartPublica/Datos%20publicos%20Anyo%2....
-
- Baxter E. M., Rutherford K. M. D., D’Eath R. B., Arnott G., Turner S. P., Sandøe P., Moustsen V. A., Thorup F., Edwards S. A., and Lawrence A. B.. 2013. The welfare implications of large litter size in the domestic pig II: management factors. Anim. Welf. 22:219–238. doi:10.7120/09627286.22.2.219 - DOI
-
- Beaulieu A. D., Aalhus J. L., Williams N. H., and Patience J. F.. 2010. Impact of piglet birth weight, birth order, and litter size on subsequent growth performance, carcass quality, muscle composition, and eating quality of pork. J. Anim. Sci. 88:2767–2778. doi:10.2527/jas.2009-2222. - DOI - PubMed
-
- Blavi L., Solà-Oriol D., and Pérez J. F.. 2015. Effect of supplementary feeding strategies during the suckling period to improve weanling performance. In: Proceedings of the 13th Digestive Physiology of the Pig Symposium;Kliczków, Poland p. 49.
LinkOut - more resources
Full Text Sources