. 2020 Jul 24:9:e57458.
doi: 10.7554/eLife.57458.

Dynamics of gaze control during prey capture in freely moving mice

Affiliations

Dynamics of gaze control during prey capture in freely moving mice

Angie M Michaiel et al. Elife. .

Abstract

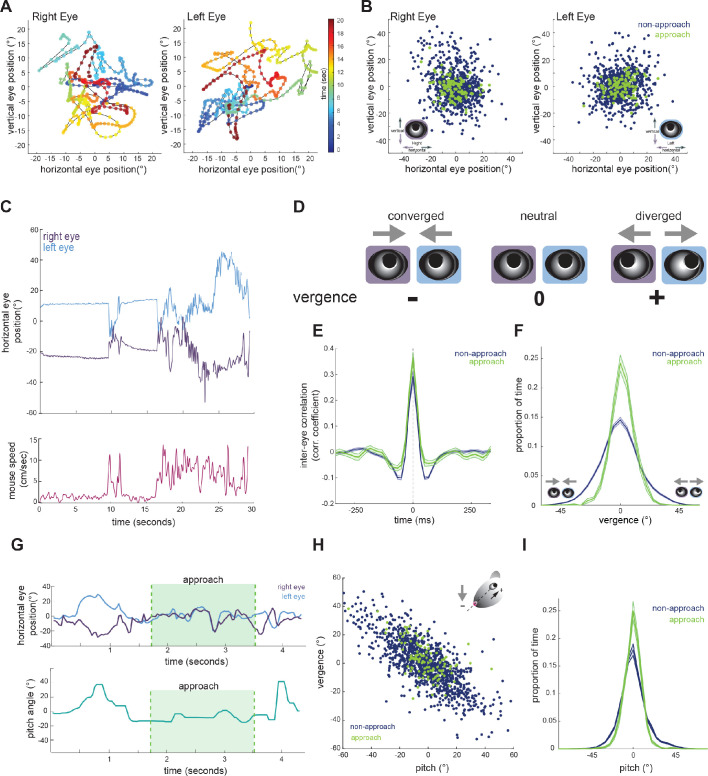
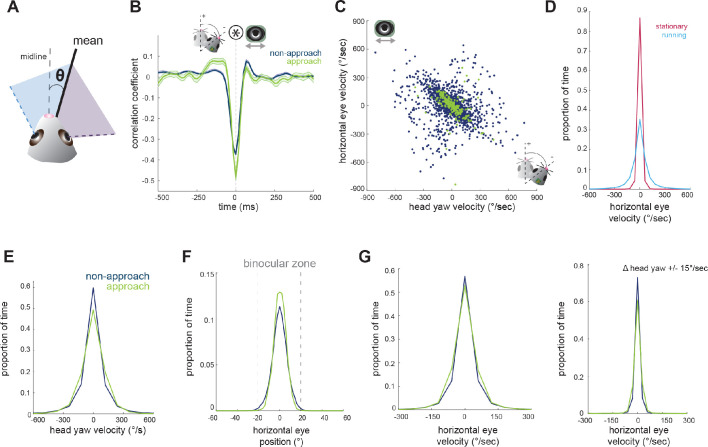
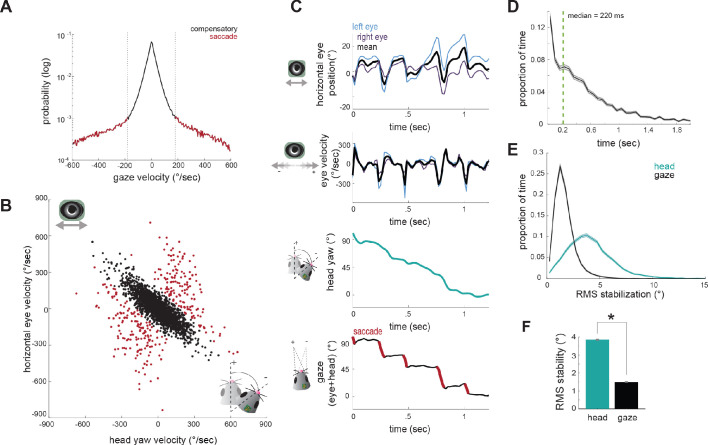
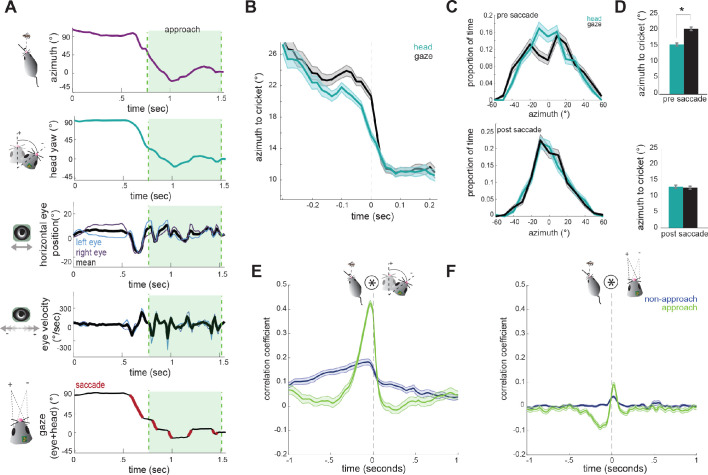
Many studies of visual processing are conducted in constrained conditions such as head- and gaze-fixation, and therefore less is known about how animals actively acquire visual information in natural contexts. To determine how mice target their gaze during natural behavior, we measured head and bilateral eye movements in mice performing prey capture, an ethological behavior that engages vision. We found that the majority of eye movements are compensatory for head movements, thereby serving to stabilize the visual scene. During movement, however, periods of stabilization are interspersed with non-compensatory saccades that abruptly shift gaze position. Notably, these saccades do not preferentially target the prey location. Rather, orienting movements are driven by the head, with the eyes following in coordination to sequentially stabilize and recenter the gaze. These findings relate eye movements in the mouse to other species, and provide a foundation for studying active vision during ethological behaviors in the mouse.

Keywords: active sensing; ethology; eye movements; mouse; neuroscience; vision.

Plain language summary

As you read this sentence, your eyes will move automatically from one word to the next, while your head remains still. Moving your eyes enables you to view each word using your central – as opposed to peripheral – vision. Central vision allows you to see objects in fine detail. It relies on a specialized area of the retina called the fovea. When you move your eyes across a page, you keep the images of the words you are currently reading on the fovea. This provides the detailed vision required for reading. The same process works for tracking moving objects. When watching a bird fly across the sky, you can track its progress by moving your eyes to keep the bird in the center of your visual field, over the fovea. But the majority of mammals do not have a fovea, and yet are still able to track moving targets. Think of a lion hunting a gazelle, for instance, or a cat stalking a mouse. Even mice themselves can track and capture insect prey such as crickets, despite not having a fovea. And yet, exactly how they do this is unknown. This is particularly surprising given that mice have long been used to study the neural basis of vision. By fitting mice with miniature head-mounted cameras, Michaiel et al. now reveal how the rodents track and capture moving crickets. It turns out that unlike animals with a fovea, mice do not use eye movements to track moving objects. Instead, when a mouse wants to look at something new, it moves its head to point at the target. The eyes then follow and ‘land’ on the target. In essence, head movements lead the way and the eyes catch up afterwards. These findings are consistent with the idea that mammals with large heads evolved eye movements to overcome the energy costs of turning the head whenever they want to look at something new. For small animals, moving the head is less energetically expensive. As a result, being able to move the eyes independent of the head is unnecessary. Future work could use a combination of behavioral experiments and brain recordings to reveal how visual areas of the brain process what an animal is seeing in real time.


Conflict of interest statement

AM, EA, CN No competing interests declared

Figures

Figure 1.
Figure 1.. Tracking eye and head movements during prey capture.
(A) Unrestrained mice hunted live crickets in a rectangular plexiglass arena (45 × 38 × 30 cm). Using an overhead camera, we tracked the movement of the mouse and cricket. Example image with overlaid tracks of the mouse (cyan). (B) 3D printed holders house a miniature camera, collimating lens, an IR LED, and an IMU, and are reversibly attached to implants on the mouse’s head, with one camera aimed at each eye. (C) Synchronized recordings of measurements related to bilateral eye position and velocity, mouse position relative to cricket (distance and azimuth, as measured relative to the center of the head), mouse speed, and head rotation in multiple dimensions (analysis here focuses on yaw and pitch). (D) Average mouse locomotor speed did not differ across experimental and control experiments (no camera and IMU) for both non-approach and approach periods. Individual dots represent the average velocity per trial. (E) Average number of captures per 10 min session did not differ between experimental and control sessions (control N = 7 animals, 210 trials; cameras N = 7 animals, 105 trials; two-sample t-test, p=0.075).
Figure 2.
Figure 2.. Eye position is more aligned across the two eyes during approach periods.
(A) Example eye movement trajectory for right and left eyes for a 20 s segment, with points color-coded for time. (B) Horizontal and vertical position for right and left eyes during approach and non-approach times. N = 7 animals, 105 trials, 792 time pts (non-approach), 110 time pts (approach), representing a random sample of 0.22% of non-approach and 0.52% of approach time points. (C) Example trace of horizontal eye positions (top) and running speed (bottom) for a 30 s segment. (D) Schematic demonstrating vergence eye movements. (E) Cross correlation of horizontal eye position across the two eyes for non-approach and approach periods. (F) Histogram of vergence during non-approach and approach. (G) Example trace of horizontal eye position (top) and head pitch (bottom) before, during, and after an approach. (H) Scatter plot of head pitch and eye vergence. As head pitch tilts downwards, the eyes move temporally to compensate (as in schematic). N = 7 animals, 105 trials, 1240 time points (non-approach), 132 time points (approach), representing a sample of 0.35% of non-approach and 0.63% of approach time points. (I) Histogram of head pitch during approach and non-approach periods, across all experiments.
Figure 3.
Figure 3.. Horizontal eye movements are mostly compensatory for yaw head rotations.
(A) To remove the effect of non-conjugate changes in eye position (i.e. vergence shifts), we compute the average angular position of the two eyes. (B) Cross-correlation of change in head yaw and horizontal eye position. (C) Scatter plot of horizontal rotational head velocity and horizontal eye velocity. N = 7 animals, 105 trials, 3565 (non-approach) and 211 (approach) timepoints, representing 1% of non-approach and 1% of approach timepoints. (D) Distribution of horizontal eye position during stationary and running periods (defined as times when mouse speed is greater than 1 cm/sec; Kolmogorov-Smirnov test, p=0.032). (E) Distribution of head angle velocity (paired t-test, p=0.938). (F) Distribution of mean absolute eye position (paired t-test, p=0.156). (G) Distribution of horizontal eye velocity (paired t-test, p=0.155) and distribution of eye velocity when head yaw is not changing (change in head yaw between ±15 deg/sec; paired t-test, p=0.229; N = 7 animals, 105 trials).
Figure 4.
Figure 4.. Compensatory and non-compensatory eye movements generate a saccade-and-fixate gaze pattern during head turns.
(A) Distribution of gaze velocity (N = 377459 time points) showing segregation of non-compensatory and compensatory movements with thresholds at ±180°/sec. (B) Joint distributions of head yaw and horizontal eye velocity colored by their type as defined in A. Black points represent compensatory movements and red represent non-compensatory saccadic movements. Points shown are a random sample of 2105 approach timepoints, 10% of total approach time points. (C) Example traces of horizontal eye position, head yaw, and gaze demonstrate a saccade-and-fixate pattern in gaze. (D) Histogram of fixation duration; fixations N = 9730, 105 trials. (E) Root Mean Squared (RMS) stabilization histograms for head yaw and gaze. (F) Bar graphs are medians of RMS stabilization distributions (median head = 3.87 deg; median gaze = 1.5 deg; paired t-test, p=0).
Figure 5.
Figure 5.. Head angle tracks cricket position more accurately than gaze position.
(A) Example traces of horizontal eye position, azimuth to cricket, head yaw, and gaze demonstrate a saccade-and-fixate pattern in gaze before and during an approach period. The head is pointed directly at the cricket when azimuth is 0°. Note the rapid decrease in azimuth, head yaw, and mean horizontal eye position creating a saccade immediately preceding the start of approach. (B) Average head yaw and gaze around the time of saccade as a function of azimuth to the cricket. Time = 0 is the saccade onset. (C) Histograms of head yaw and gaze position before and after saccades occur. (D) Medians of yaw and gaze distributions from C (paired t-test, ppre saccade=8.48x10⁻⁹; ppost saccade=0.979). (E) Cross correlation of azimuth and change in head yaw for non-approach and approach periods. (F) Cross correlation of azimuth and change in gaze for non-approach and approach periods. N = 105 trials, 7 animals.

References

    1. Andersson R, Larsson L, Holmqvist K, Stridh M, Nyström M. One algorithm to rule them all? an evaluation and discussion of ten eye movement event-detection algorithms. Behavior Research Methods. 2017;49:616–637. doi: 10.3758/s13428-016-0738-9. - DOI - PubMed
    1. Bailey V, Sperry C. Life history and habits of grasshopper mice. [March 25, 2020];Genus Onychomys. 1929 https://ageconsearch.umn.edu/record/157954?ln=en
    1. Bianco IH, Kampff AR, Engert F. Prey capture behavior evoked by simple visual stimuli in larval zebrafish. Frontiers in Systems Neuroscience. 2011;5:101. doi: 10.3389/fnsys.2011.00101. - DOI - PMC - PubMed
    1. Bleckert A, Schwartz GW, Turner MH, Rieke F, Wong RO. Visual space is represented by nonmatching topographies of distinct mouse retinal ganglion cell types. Current Biology. 2014;24:310–315. doi: 10.1016/j.cub.2013.12.020. - DOI - PMC - PubMed
    1. Cartmill M. Rethinking primate origins. Science. 1974;184:436–443. doi: 10.1126/science.184.4135.436. - DOI - PubMed

Publication types