

Prediction models for clear cell renal cell carcinoma ISUP/WHO grade: comparison between CT radiomics and conventional contrast-enhanced CT
- PMID: 32706977
- PMCID: PMC7548376
- DOI: 10.1259/bjr.20200131
Prediction models for clear cell renal cell carcinoma ISUP/WHO grade: comparison between CT radiomics and conventional contrast-enhanced CT
Abstract
Objective: Comparing the prediction models for the ISUP/WHO grade of clear cell renal cell carcinoma (ccRCC) based on CT radiomics and conventional contrast-enhanced CT (CECT).
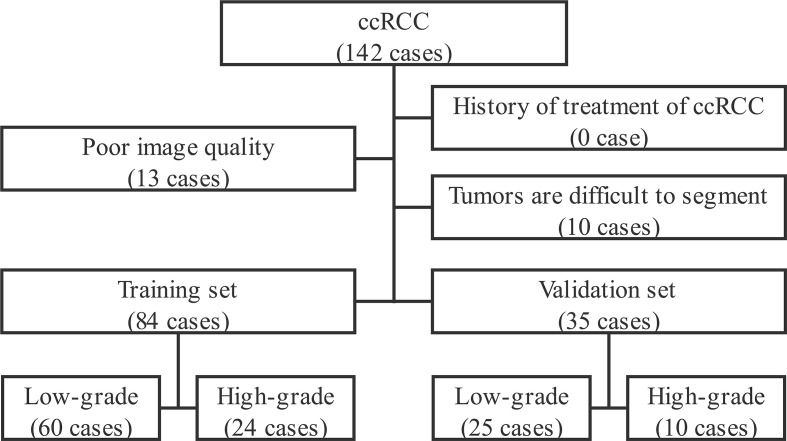
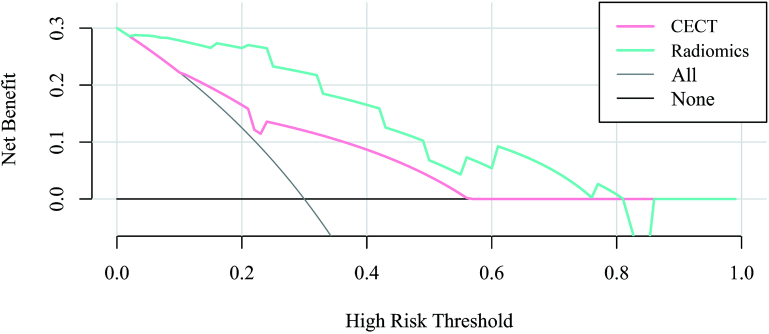
Methods: The corticomedullary phase images of 119 cases of low-grade (I and II) and high-grade (III and IV) ccRCC based on 2016 ISUP/WHO pathological grading criteria were analyzed retrospectively. The patients were randomly divided into training and validation set by stratified sampling according to 7:3 ratio. Prediction models of ccRCC differentiation were constructed using CT radiomics and conventional CECT findings in the training setandwere validated using validation set. The discrimination, calibration, net reclassification index (NRI) and integrated discrimination improvement index (IDI) of the two prediction models were further compared. The decision curve was used to analyze the net benefit of patients under different probability thresholds of the two models.
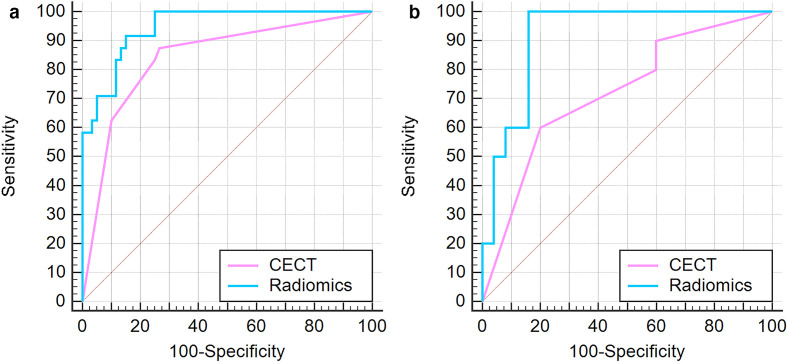
Results: In the training set, the C-statistics of radiomics prediction model was statistically higher than that of CECT (p < 0.05), with NRI of 9.52% and IDI of 21.6%, both with statistical significance (p < 0.01).In the validation set, the C-statistics of radiomics prediction model was also higher but did not show statistical significance (p = 0.07). The NRI and IDI was 14.29 and 33.7%, respectively, both statistically significant (p < 0.01). Validation set decision curve analysis showed the net benefit improvement of CT radiomics prediction model in the range of 3-81% over CECT.
Conclusion: The prediction model using CT radiomics in corticomedullary phase is more effective for ccRCC ISUP/WHO grade than conventional CECT.
Advances in knowledge: As a non-invasive analysis method, radiomics can predict the ISUP/WHO grade of ccRCC more effectively than traditional enhanced CT.
Figures
Similar articles
-
A predictive model for WHO/ISUP pathologic grading of renal clear cell carcinoma based on CT radiomics: a multicenter study.BMC Nephrol. 2025 Jul 1;26(1):296. doi: 10.1186/s12882-025-04268-z. BMC Nephrol. 2025. PMID: 40597030 Free PMC article.
-
[Establishment of nuclear grade prediction model for T1 clear cell renal cell carcinoma based on CT features and radiomics].Zhonghua Zhong Liu Za Zhi. 2025 Feb 23;47(2):168-174. doi: 10.3760/cma.j.cn112152-20240615-00257. Zhonghua Zhong Liu Za Zhi. 2025. PMID: 39939018 Chinese.
-
CT-based radiomics model using stability selection for predicting the World Health Organization/International Society of Urological Pathology grade of clear cell renal cell carcinoma.Br J Radiol. 2024 May 29;97(1158):1169-1179. doi: 10.1093/bjr/tqae078. Br J Radiol. 2024. PMID: 38688660 Free PMC article.
-
Diagnostic value of contrast-enhanced CT in clear cell renal cell carcinoma: a systematic review and meta-analysis.BMC Urol. 2024 Sep 2;24(1):189. doi: 10.1186/s12894-024-01574-w. BMC Urol. 2024. PMID: 39218886 Free PMC article.
-
Accuracy of CT-Based Radiomics Models for Preoperative Grading of Clear Cell Renal Cell Carcinoma: A Systematic Review and Meta-analysis.Acad Radiol. 2025 Jun 16:S1076-6332(25)00526-4. doi: 10.1016/j.acra.2025.05.049. Online ahead of print. Acad Radiol. 2025. PMID: 40527677 Review.
Cited by
-
Non-invasive prediction of nuclear grade in renal cell carcinoma using CT-Based radiomics: a systematic review and meta-analysis.Abdom Radiol (NY). 2025 Jun 11. doi: 10.1007/s00261-025-05056-x. Online ahead of print. Abdom Radiol (NY). 2025. PMID: 40495027 Review.
-
Development and Validation of a Radiomic Nomogram for Predicting the Prognosis of Kidney Renal Clear Cell Carcinoma.Front Oncol. 2021 Jul 6;11:613668. doi: 10.3389/fonc.2021.613668. eCollection 2021. Front Oncol. 2021. PMID: 34295804 Free PMC article.
-
Development and validation of a CT algorithm based on intratumoral necrosis and tumor morphology to predict the nuclear grade of small (2-4 cm) solid clear cell renal cell carcinoma.BMC Med Imaging. 2025 Jun 5;25(1):207. doi: 10.1186/s12880-025-01741-x. BMC Med Imaging. 2025. PMID: 40474054 Free PMC article.
-
Circ_000829 Plays an Anticancer Role in Renal Cell Carcinoma by Suppressing SRSF1-Mediated Alternative Splicing of SLC39A14.Oxid Med Cell Longev. 2022 Aug 26;2022:8645830. doi: 10.1155/2022/8645830. eCollection 2022. Oxid Med Cell Longev. 2022. PMID: 36062189 Free PMC article.
-
Performance of CT radiomics in predicting the overall survival of patients with stage III clear cell renal carcinoma after radical nephrectomy.Radiol Med. 2022 Aug;127(8):837-847. doi: 10.1007/s11547-022-01526-0. Epub 2022 Jul 14. Radiol Med. 2022. PMID: 35834111
References
-
- Capitanio U, Cloutier V, Zini L, Isbarn H, Jeldres C, Shariat SF, et al. . A critical assessment of the prognostic value of clear cell, papillary and chromophobe histological subtypes in renal cell carcinoma: a population-based study. BJU Int 2009; 103: 1496–500. doi: 10.1111/j.1464-410X.2008.08259.x - DOI - PubMed
Publication types
MeSH terms
Substances
LinkOut - more resources
Full Text Sources
Medical
Research Materials
