. 2020 Aug 6;79(3):504-520.e9.
doi: 10.1016/j.molcel.2020.07.001. Epub 2020 Jul 23.

Kinase Interaction Network Expands Functional and Disease Roles of Human Kinases

Affiliations

Kinase Interaction Network Expands Functional and Disease Roles of Human Kinases

Marija Buljan et al. Mol Cell. .

Abstract

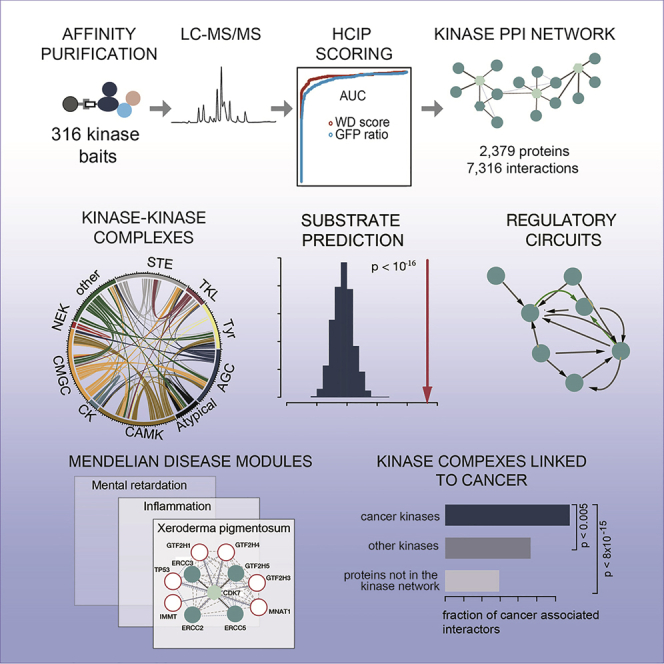
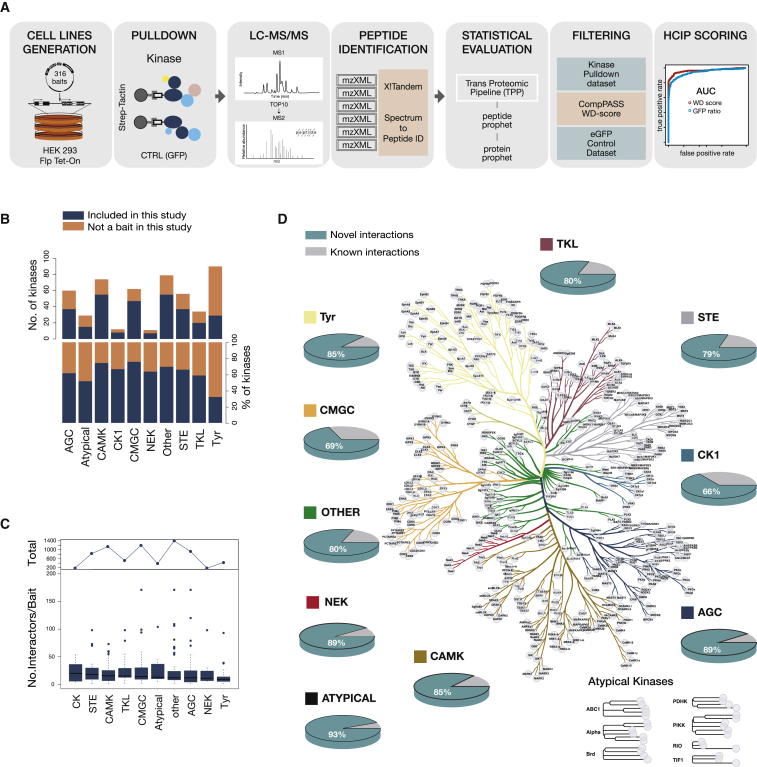
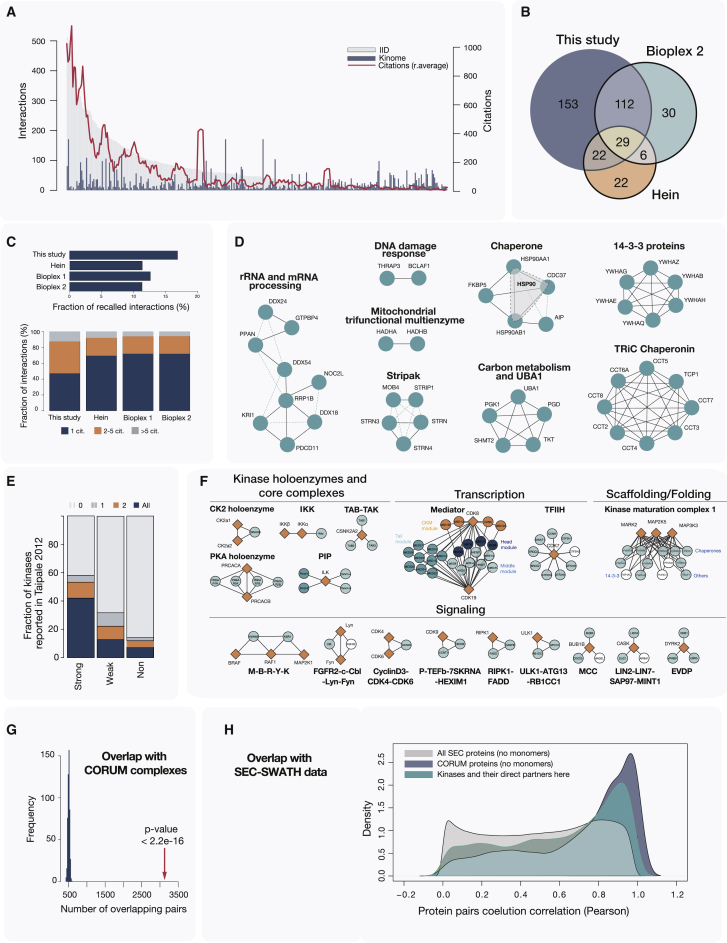
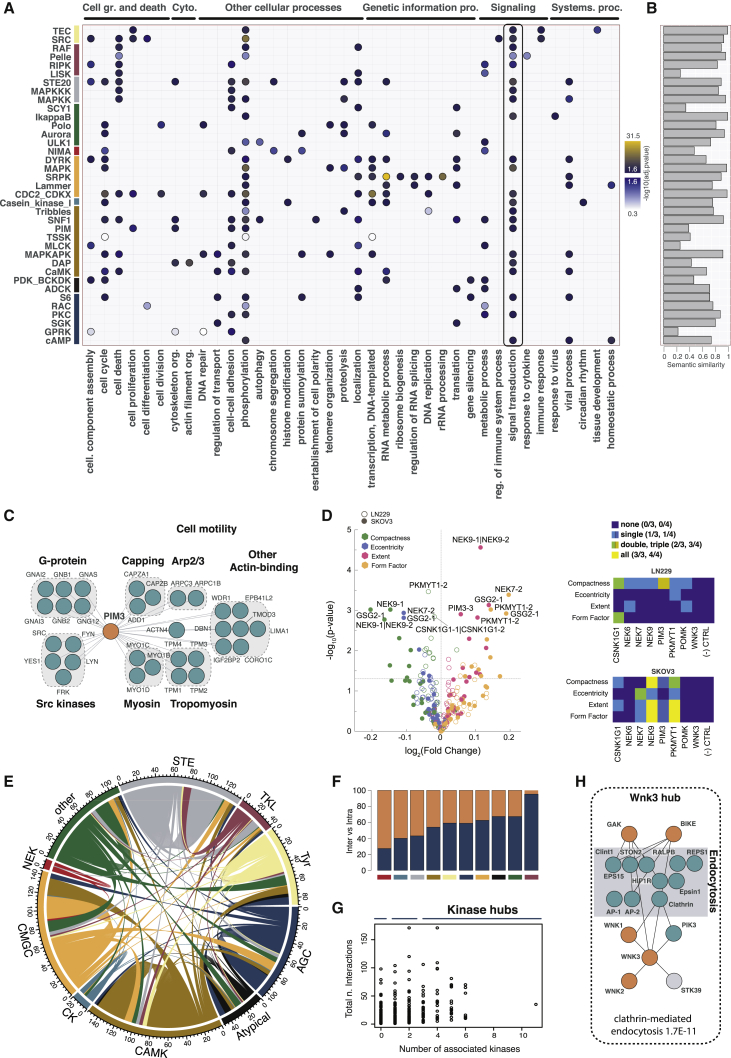
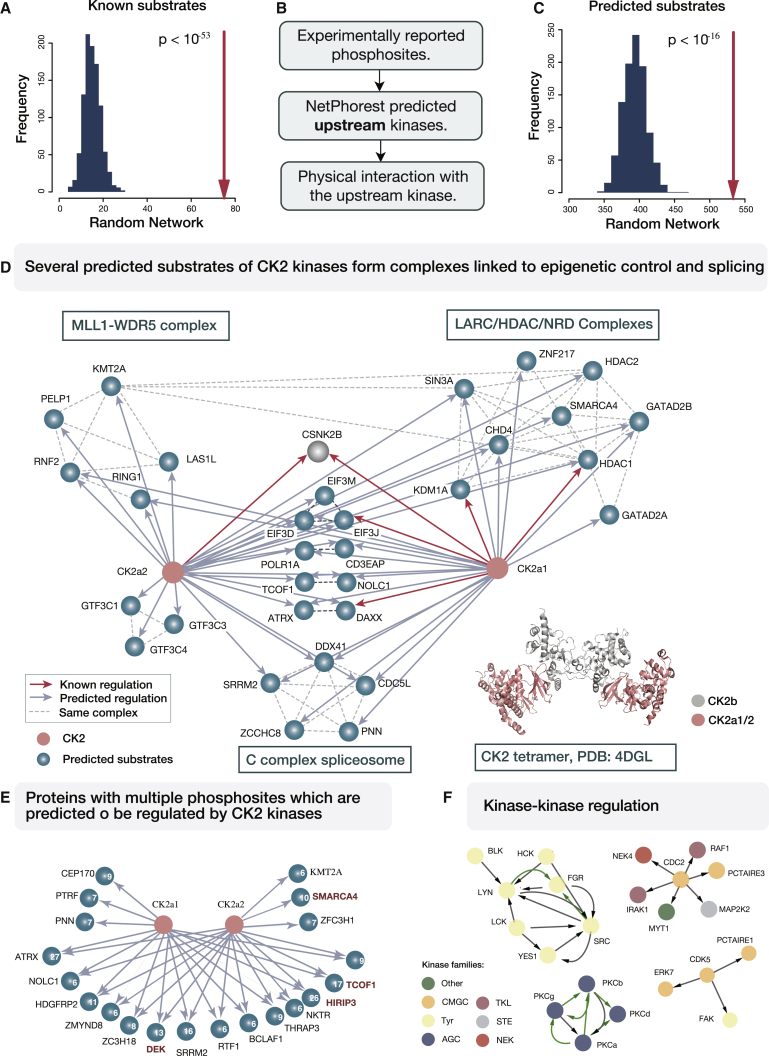
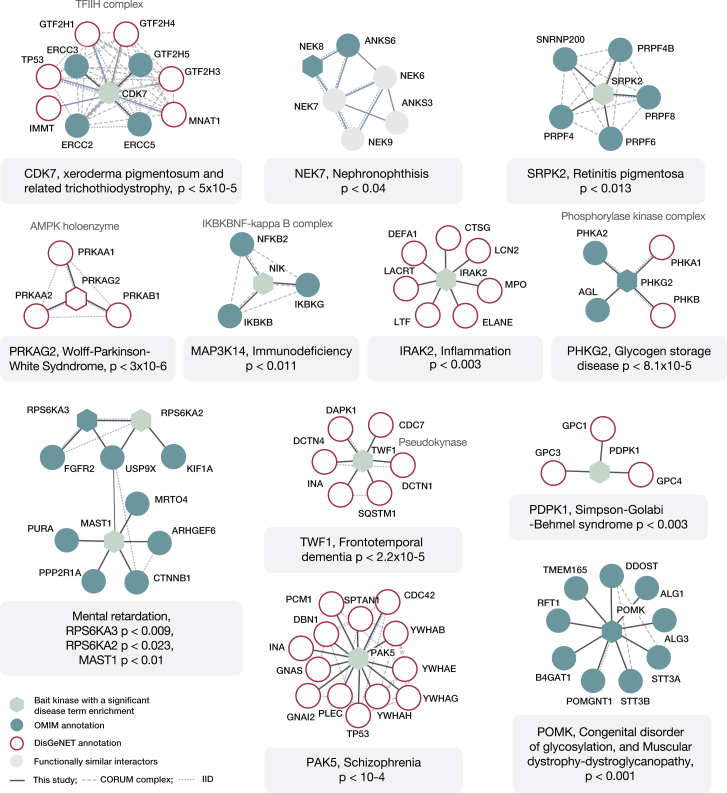
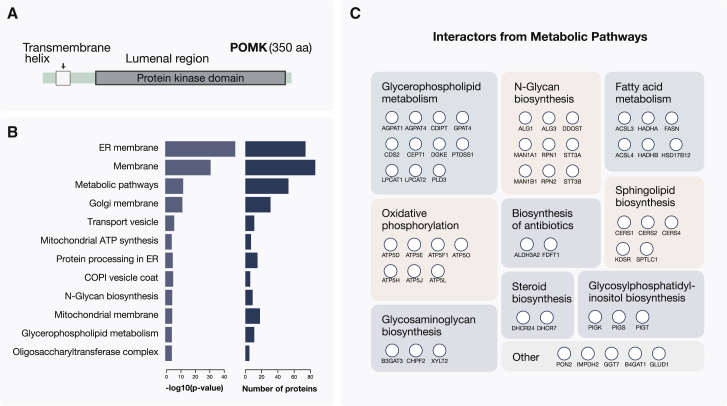
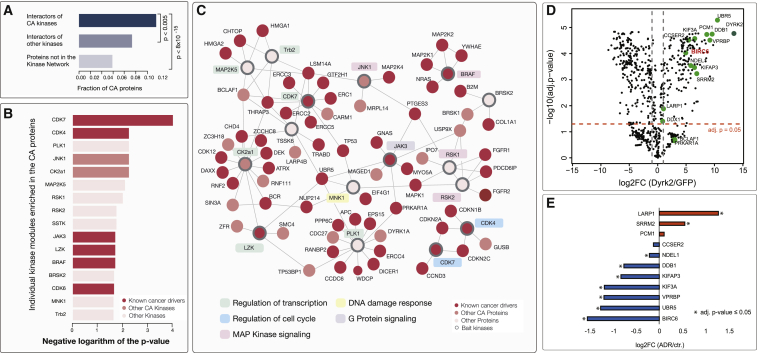
Protein kinases are essential for signal transduction and control of most cellular processes, including metabolism, membrane transport, motility, and cell cycle. Despite the critical role of kinases in cells and their strong association with diseases, good coverage of their interactions is available for only a fraction of the 535 human kinases. Here, we present a comprehensive mass-spectrometry-based analysis of a human kinase interaction network covering more than 300 kinases. The interaction dataset is a high-quality resource with more than 5,000 previously unreported interactions. We extensively characterized the obtained network and were able to identify previously described, as well as predict new, kinase functional associations, including those of the less well-studied kinases PIM3 and protein O-mannose kinase (POMK). Importantly, the presented interaction map is a valuable resource for assisting biomedical studies. We uncover dozens of kinase-disease associations spanning from genetic disorders to complex diseases, including cancer.

Keywords: cancer; disease module; interaction network; kinome; protein complexes; protein kinases; proteomics; signaling regulation; systems biology.


Conflict of interest statement

Declaration of Interests The authors declare no competing interests.

Figures

None
Graphical abstract
Figure 1
Figure 1
Systematic Mapping of Kinase Interactions by AP-MS (A) Workflow used to generate the kinase interaction network. This includes generation of more than 300 cell lines stably expressing doxycycline-inducible kinases, single-step pull-downs, duplicate runs on a hybrid linear ion trap-Orbitrap mass spectrometer, peptide identification with X!Tandem, and statistical evaluation. (B) Coverage of kinases across different families. Dark blue represents included and orange not included kinases. (C) Distribution of the number of identified interactors per kinase. (D) Novel versus known interactions for each kinase family are plotted against the kinome evolutionary tree. Each kinase family is represented with a different color, and the same coloring scheme is used in all figures.
Figure 2
Figure 2
Assessment of the Network Scope and Data Quality (A) Barplot depicting the number of interactions per kinase found in public databases (http://dcv.uhnres.utoronto.ca/iid/; gray bars) and in the presented study (blue bars). A running average of the number of citations per kinase is shown as a red line. Bars are ordered by the decreasing number of interactions based on IID. (B) Venn diagram shows an overlap between kinase baits used in our study and baits used in two previous large-scale AP-MS studies: Hein et al. (2015) and BioPlex 2 (Huttlin et al., 2017). (C) Fraction of all protein interactions detected in different AP-MS studies that were also reported by additional studies deposited in the BioGRID database (top). The number of citations associated with the recapitulated interactions is also shown (bottom). (D) Protein pairs that were almost exclusively purified together with different kinase baits (p value < 10−10) are shown. (E) Stacked barplots show the fraction of the HSP90 chaperone complex members found here as interactors of kinases that were previously classified as its strong or weak clients or were not identified as HSP90 clients (Taipale et al., 2012). (F) Representative kinase-containing CORUM complexes that were recapitulated in the generated network. Conditions for this were more than two subunits and more than 75% of complex subunits covered. (G) Contacts between CORUM protein pairs in the kinase network are enriched in a comparison to 500 reshuffled networks of the same composition and topology. (H) Distribution of co-elution correlation values for all protein pairs measured in HEK293 SEC analysis (Heusel et al., 2019) (gray area). Average correlation values for protein pairs found in the same CORUM complex (dark blue area) or here in the kinase network (dark green area) were higher than those for other protein pairs.
Figure 3
Figure 3
Functional Landscape of the Kinase Interaction Network (A) Dotplot of the most significant terms associated with kinase subgroups covered in this study. (B) Semantic similarity between the top GO terms based on the interactions from this study and interaction partners deposited in the IID. (C) Main associations in the PIM3 interaction network include the actin cytoskeletal and G proteins and SRC modules. (D) Cellular phenotyping after gene silencing. Volcano plot depicts siRNA gene targets that displayed the strongest changes in the representative cell area and shape phenotypes relative to the negative siRNA control. Targets that had a −log10 (p value) greater than 2.5 are labeled with their gene names. Colors represent different features measured, as defined by the CellProfiler software tool. Different siRNAs for the same gene are indicated with −1 or −2, and combinations of siRNAs are denoted by the symbol “|”. Heatmaps summarize the information on how many siRNA and siRNA combinations per gene were observed as significant. (E) Circos plot of all kinase-kinase interactions. Coloring scheme is the same as in Figure 1. (F) Ratio between intra-family and inter-family connections. (G) Number of kinases versus total number of interactors per kinase bait. (H) WNK3 kinase hub with its interactors and known associations with the endocytosis proteins.
Figure 4
Figure 4
Kinase Interaction Network Assists Assignments of Regulatory Interactions (A) In the generated kinase network, 75 interactions (red arrow) were known kinase-substrate pairs, which corresponds to a significant enrichment compared to random networks (shown as a histogram on the left). (B) Criteria for the prediction of novel kinase-substrate relationships. (C) In total, 534 interactions in the kinase network were predicted as possible kinase-substrate interaction (depicted with red arrow). This is higher than the average number of predicted pairs in random networks (histogram on the left). (D) Several substrate proteins predicted to be regulated by casein kinase 2 form stable protein complexes. Known and predicted regulatory interactions are depicted with red and gray arrows, respectively. Dashed lines indicate connections between proteins from the same CORUM complex (Ruepp et al., 2010). CK2 holoenzyme is a tetramer with two CK2b regulatory subunits and CK2a1 and CK2a2 catalytically active subunits. (E) CK2 predicted substrates with more than five CK2 phosphomotifs are shown. Number of predicted phosphomotifs is shown for each protein. Proteins that were reported as CK2 substrates in previous studies are indicated in dark red. (F) Kinase-kinase regulatory interactions occur within and across kinase families. The full set of predicted regulatory events is shown in Figure S3B. Arrows colored in green represent activation loop phosphorylation. Kinase families are colored according to the scheme in Figure 1.
Figure 5
Figure 5
Kinase Modules Associated with Genetic Diseases Kinase interaction modules in which interactors with the same disease term were present at a statistically significant frequency are shown. Shapes colored in light green (significant baits) or gray (other bait and prey proteins) indicate that the protein lacked the respective annotation. p values indicate enrichment significance.
Figure 6
Figure 6
POMK Kinase Frequently Interacts with Proteins Involved in Glycan Metabolism (A) Protein sequence of the POMK kinase is depicted. The kinase is embedded in the ER membrane with the largest fraction of the protein residing within the ER lumen. (B) Functional GO terms and KEGG pathway annotations overrepresented in the set of POMK interaction proteins are shown. (C) Interaction partners of the POMK kinase that according to KEGG annotations are members of metabolic pathways (53 proteins in total) are grouped based on the KEGG pathway assignments. In the instances where the same protein belonged to several pathways, it was assigned to the larger one.
Figure 7
Figure 7
Kinase Network Associated with Cancer (A) Interactors of CA kinases are often themselves associated with cancer. (B) Individual kinases whose direct protein interaction neighborhoods were strongly enriched in CA proteins (p value < 0.025) are listed together with their respective p values. (C) Interaction network represents kinases from (B) together with their associated proteins that are annotated as CA. Coloring scheme is the same as in (B). Significant bait kinases are highlighted with bold edges. When several of the interaction partners share the same GO term, this is indicated with the colored background around the kinase name (most common terms are shown). (D) Volcano plot indicates the enrichment of Dyrk2 interaction partners identified by BioID-MS compared to the GFP control (BirA-tagged GFP). Proteins enriched with a log2FC (Dyrk2/GFP) ≥ 1 (adjusted p value ≤ 0.05) were considered as high-confidence interactors (thresholds are indicated with dashed lines). Interactors identified by both BioID-MS and AP-MS measurements are presented as green dots (11 were detected with a high confidence). (E) Quantitative changes in the Dyrk2 interactions after the treatment with Adriamycin (ADR) are shown. Only interaction partners identified with both AP-MS and BioID are shown. Significant changes (log2FC (ADR/ctr) ≥ 1 and adjusted p value ≤ 0.05) are indicated with an asterisk.

References

    1. Arcas A., Fernández-Capetillo O., Cases I., Rojas A.M. Emergence and evolutionary analysis of the human DDR network: implications in comparative genomics and downstream analyses. Mol. Biol. Evol. 2014;31:940–961. - PMC - PubMed
    1. Assrir N., Filhol O., Galisson F., Lipinski M. HIRIP3 is a nuclear phosphoprotein interacting with and phosphorylated by the serine-threonine kinase CK2. Biol. Chem. 2007;388:391–398. - PubMed
    1. Bai L., Kovach A., You Q., Kenny A., Li H. Structure of the eukaryotic protein O-mannosyltransferase Pmt1-Pmt2 complex. Nat. Struct. Mol. Biol. 2019;26:704–711. - PMC - PubMed
    1. Bensimon A., Aebersold R., Shiloh Y. Beyond ATM: the protein kinase landscape of the DNA damage response. FEBS Lett. 2011;585:1625–1639. - PubMed
    1. Breitkreutz A., Choi H., Sharom J.R., Boucher L., Neduva V., Larsen B., Lin Z.-Y., Breitkreutz B.-J., Stark C., Liu G. A global protein kinase and phosphatase interaction network in yeast. Science. 2010;328:1043–1046. - PMC - PubMed

Publication types

MeSH terms