. 2020 Aug 11;15(2):307-316.
doi: 10.1016/j.stemcr.2020.06.020. Epub 2020 Jul 23.

Increased Expression of Interleukin-1 Receptor Characterizes Anti-estrogen-Resistant ALDH+ Breast Cancer Stem Cells

Affiliations

Increased Expression of Interleukin-1 Receptor Characterizes Anti-estrogen-Resistant ALDH+ Breast Cancer Stem Cells

Aida Sarmiento-Castro et al. Stem Cell Reports. .

Abstract

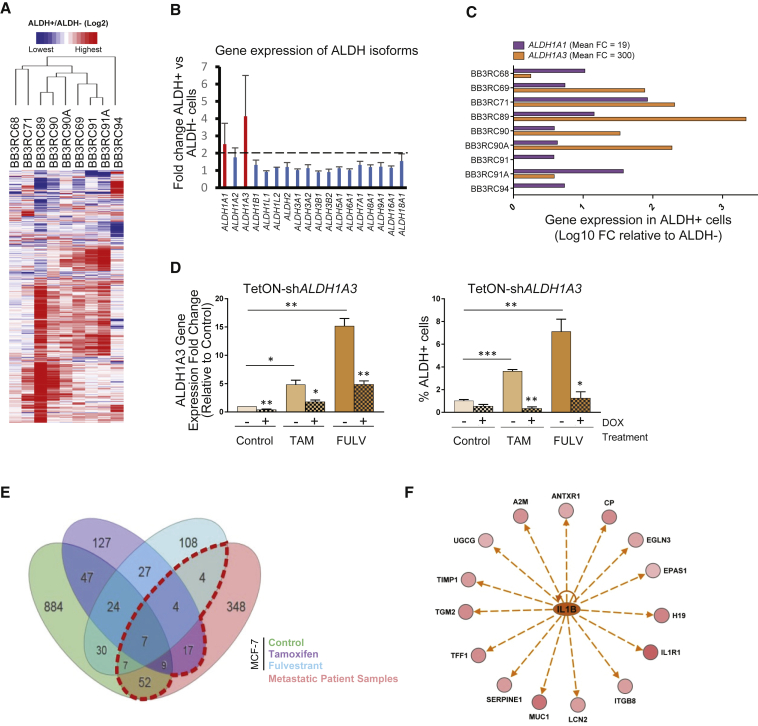
Estrogen-receptor-positive breast tumors are treated with anti-estrogen (AE) therapies but frequently develop resistance. Cancer stem cells (CSCs) with high aldehyde dehydrogenase activity (ALDH+ cells) are enriched following AE treatment. Here, we show that the interleukin-1β (IL-1β) signaling pathway is activated in ALDH+ cells, and data from single cells reveals that AE treatment selects for IL-1 receptor (IL1R1)-expressing ALDH+ cells. Importantly, CSC activity is reduced by an IL1R1 inhibitor in AE-resistant models. Moreover, IL1R1 expression is increased in the tumors of patients treated with AE therapy and predicts treatment failure. Single-cell gene expression analysis revealed that at least two subpopulations exist within the ALDH+ population, one proliferative and one quiescent. Following AE therapy the quiescent population is expanded, which suggests CSC dormancy as an adaptive strategy that facilitates treatment resistance. Targeting of ALDH+IL1R1+ cells merits testing as a strategy to combat AE resistance in patients with residual disease.

Keywords: ALDH(+) cells; IL1R1; anti-estrogens; breast cancer stem cells; dormancy.


Figures

Figure 1
Figure 1
AE-Treated ALDH+ Cells from ER+ BC Cells Have Greater BCSC Activity Than ALDH Cells In Vitro and In Vivo (A) Representative fluorescence activated cell sorting (FACS) plot showing the ALDH+ population identified through the Aldefluor assay for an individual patient sample. ALDH+ cells (red gate) were discriminated from ALDH cells using the diethylaminobenzaldehyde (DEAB) control. (B) Bar chart shows mammosphere-forming efficiency (MFE) percentage of ALDH+ cells (red) and ALDH cells (blue) from ER+ metastatic BCs undergoing AE therapies. (C) Bar chart illustrates fold change in MFE percentage between ALDH+ and ALDH cells across eight different patient samples. (D) Schematic overview of the in vivo transplantation assay to test tumor formation capacity between ALDH+ and ALDH MCF-7 cells. MCF-7 cells were pre-treated in vitro for 6 days with control (ethanol), tamoxifen (1 μM) or fulvestrant (0.1 μM) followed by the Aldefluor assay. ALDH+ and ALDH cells were FACS sorted, counted using trypan blue, and engrafted into the left and right flank, respectively, of the same NSG mice. (E) Averaged tumor growth from control (pink; left panel), tamoxifen (green; middle panel), or fulvestrant-treated (blue; right panel) cells. 1,000 ALDH+ (hollow circles) and 1,000 ALDH (filled circles) cells are represented. p ≤ 0.05 (two-tail, two-sample equal-variance t test). Number of mice per condition = 4 (vehicle-treated mice, n = 3). Data shown as mean ± SEM. (F) Table shows extreme limiting dilution analysis from in vivo injections of ALDH+ and ALDH cells (10,000; 1,000; 100 cells) to assess tumor-initiating cell frequency. Tumor growth was assessed at week 20 and is represented as mice positive for growth/mice tested for each cell number. See also Figure S1.
Figure 2
Figure 2
ALDH+ Cells from ER+ Metastatic Samples Show a Distinct Gene Expression Pattern Compared with ALDH Cells (A) Heatmap illustrating the 599 differentially expressed genes (447 up, 152 down) between ALDH+ and ALDH cells (red color shows gene upregulation, green shows downregulation in ALDH+ relative to ALDH cells identified by pairwise rank products with a threshold probability of false positives <0.05) from metastatic ER+ patient BCs. (B) Gene expression fold change (FC) between ALDH+ and ALDH cells of 18 ALDH isoforms detected in the Affymetrix array data. Mean FC for all metastatic samples (n = 9) is represented for each isoform. Red bar indicates isoforms with FC higher than 2. (C) qPCR analysis of ALDH1A1 and ALDH1A3 gene expression in the nine patient metastatic samples that were used in the Affymetrix array. Data are shown as log10 FC between ALDH+ and ALDH cells. Mean linear FC of the two ALDH isoforms for all samples is shown. (D) A stably transduced inducible shALDH1A3 MCF-7 cell line was treated with control, tamoxifen (TAM), or fulvestrant (FULV) for 6 days concomitantly with (filled pattern) or without (solid bars) doxycycline (DOX). ALDH1A3 mRNA levels were examined by qPCR (left) and percentage of ALDH+ cells was assessed using the Aldefluor assay (right). Data of at least three independent experiments are shown (p < 0.05, ∗∗p < 0.01, ∗∗∗p < 0.001). (E) Venn diagram illustrates meta-analysis of the MCF-7 cell line (control, tamoxifen, fulvestrant-treated ALDH+ versus ALDH cells) and the patient Affymetrix data (ALDH+ versus ALDH cells). iPathway guide software tool (AdvaitaBio) was used to plot the diagrams. The red dashed-line box indicates the 100 genes that are commonly differentially expressed in ALDH+ cells of patient samples and MCF-7 cell line. The log2 FC cutoff applied to the ALDH+ versus ALDH cells obtained from the meta-analysis data was 0.6. (F) Ingenuity Pathway Analysis diagram showing that IL-1β signaling is predicted to be activated (orange color) in the ALDH+ cell population. Straight arrows indicate network of 15 genes, predicted to be regulated by IL-1β, that were upregulated (in red) in ALDH+ cells. See also Figure S2.
Figure 3
Figure 3
Single ALDH+ Cell Gene Expression in the MCF-7 Cell Line Identifies IL1R1 Overexpression Following AE Treatment (A) Heatmap of the relative expression across single ALDH+ cells (columns) for ALDH1A3 and IL1R1 genes (rows). Cells are ordered by treatment, i.e., control (left), tamoxifen (middle), and fulvestrant (right). Colors represent expression levels from highest (red) to lowest (blue). (B) Density plots of gene expression in all single ALDH+ cells analyzed from the two different AE treatments and control. (C) Box plots and scatterplots show ALDH1A3 and IL1R1 relative gene expression from MCF-7 parental/unselected clonal sublines (n = 7) compared with tamoxifen-resistant (TAMR, n = 4) and fulvestrant-resistant (FULVR, n = 4) clonal sublines (GEO: GSE14986 dataset). Data from sublines grown without drugs (MCF-7 parental and TAMR) or with fulvestrant (FULVR). p value for at least four biological replicates calculated with Wilcoxon test, ∗∗p < 0.01. (D) MCF-7 parental, tamoxifen-resistant (TAMR), and fulvestrant-resistant (FULVR) cells were pre-treated in adherence with 10 μg/mL anakinra or vehicle control in the presence of 10 ng/mL IL-1β for 72 h. MFE was assessed after pre-treatments. Data are presented as mean ± SEM of three experiments with at least three technical replicates each. ∗∗p < 0.01. (E) Box plot and scatterplot show IL1R1 expression from ER+ BC after pre-surgical 4-week treatment with fulvestrant (low-dose, 250 mg or high-dose, 500 mg) compared with IL1R1 expression before treatment (Patani et al., 2014). Data are presented as log2 FC. Each patient sample is displayed as a blue (downregulation) or red (upregulation) circle. p value calculated with paired Wilcoxon test. (F) Box plot and scatterplot show IL1R1 log2 FC gene expression in three different patient cohorts in response to 2 weeks (2w) or 3 months (3m) of letrozole (Let, Edinburgh dataset), anastrozole (Ana, Royal Marsden dataset), and AI (Baylor dataset) treatment compared with pre-treatment levels. Each patient sample is displayed as a blue (downregulation) or red (upregulation) circle. p value calculated with paired Wilcoxon test. (G) Kaplan-Meier curves represent BC specific-survival (BCS) for IL1R1-high and IL1R1-low of a cohort of 54 ER+ BC patients (Edinburgh) who received 2 weeks of AI treatment. p value is based on a log-rank test. See also Figure S3.
Figure 4
Figure 4
Single-Cell Gene Expression Data Reveal a Dormant ALDH+ Population (A) Scatterplot of the two first linear discriminants from discriminant analysis of DAPC analysis for 377 single ALDH+ MCF-7 cells using as classifier the clusters identified through Mclust. The scatterplot shows the cluster of individual ALDH+ cells (rhomboids: control group; circle: tamoxifen group; triangles: fulvestrant group). Control-treated ALDH+ cells (gray) clustered within two groups (clusters 1 and 2), Tamoxifen-treated ALDH+ cells (blue) also clustered within two groups (clusters 3 and 4), and fulvestrant-treated ALDH+ cells (green) clustered within three groups (clusters 5, 6, and 7). Pooled data of three independent experiments are shown. (B) Ward hierarchical clustering of cell clusters using Euclidean distance of all the genes. Boxes represent clusters with an unbiased p value of >0.90 indicating that these clusters are robust, thus identifying three groups of cells: two major ones, renamed as population A (blue box) and population B (pink box) and a smaller one corresponding to Fulvestrant-7 (green box). (C) Scatterplot of the DAPC analysis for single ALDH+ MCF-7 cells after treatment using as classifier the clusters identified in (B). Linear discriminant 1 accounts for most of the differences between population B and the other two. (D) Distribution of the gene importance to build linear discriminants 1 and 2. Genes above threshold 0.05 of linear discriminant 1 are labeled. (E) Heatmap of relative gene expression across the three ALDH+ populations identified (A, B, fulvestrant 7 [fulv-7]) for the eight most important genes in the separation between population B and the others. Colors represent expression levels from highest (red) to lowest (blue). (F) Bar charts show the percentage contribution of each ALDH+ subpopulation within the ALDH+ cells treated with control, tamoxifen, or fulvestrant. (G) Box plots and scatterplots show ALDH1A1 and ALDH1A3 expression from ER+ dormant and acquired resistant tumors after 4 months of neoadjuvant treatment with letrozole compared with expression before treatment (Selli et al., 2019). Data are presented as log2 FC. Each patient sample is displayed as a blue (downregulation) or red (upregulation) circle. p value calculated with paired Wilcoxon test. (H) Diagram showing that AE therapies do not target ALDH+ cells and enrich for a dormant IL1R1+ALDH+ cell population. See also Figure S4.

References

    1. Akrap N., Andersson D., Bom E., Gregersson P., Stahlberg A., Landberg G. Identification of distinct breast cancer stem cell populations based on single-cell analyses of functionally enriched stem and progenitor pools. Stem Cell Reports. 2016;6:121–136. - PMC - PubMed
    1. Brooks M.D., Burness M.L., Wicha M.S. Therapeutic implications of cellular heterogeneity and plasticity in breast cancer. Cell Stem Cell. 2015;17:260–271. - PMC - PubMed
    1. Colacino J.A., Azizi E., Brooks M.D., Harouaka R., Fouladdel S., McDermott S.P., Lee M., Hill D., Madden J., Boerner J. Heterogeneity of human breast stem and progenitor cells as revealed by transcriptional profiling. Stem Cell Reports. 2018;10:1596–1609. - PMC - PubMed
    1. Coser K.R., Wittner B.S., Rosenthal N.F., Collins S.C., Melas A., Smith S.L., Mahoney C.J., Shioda K., Isselbacher K.J., Ramaswamy S., Shioda T. Antiestrogen-resistant subclones of MCF-7 human breast cancer cells are derived from a common monoclonal drug-resistant progenitor. Proc. Natl. Acad. Sci. U S A. 2009;106:14536–14541. - PMC - PubMed
    1. Dunbier A.K., Ghazoui Z., Anderson H., Salter J., Nerurkar A., Osin P., A'Hern R., Miller W.R., Smith I.E., Dowsett M. Molecular profiling of aromatase inhibitor-treated postmenopausal breast tumors identifies immune-related correlates of resistance. Clin. Cancer Res. 2013;19:2775–2786. - PubMed

Publication types

MeSH terms

Substances