. 2020 Aug 10;38(2):229-246.e13.
doi: 10.1016/j.ccell.2020.06.012. Epub 2020 Jul 23.

Emergence of a High-Plasticity Cell State during Lung Cancer Evolution

Affiliations

Emergence of a High-Plasticity Cell State during Lung Cancer Evolution

Nemanja Despot Marjanovic et al. Cancer Cell. .

Abstract

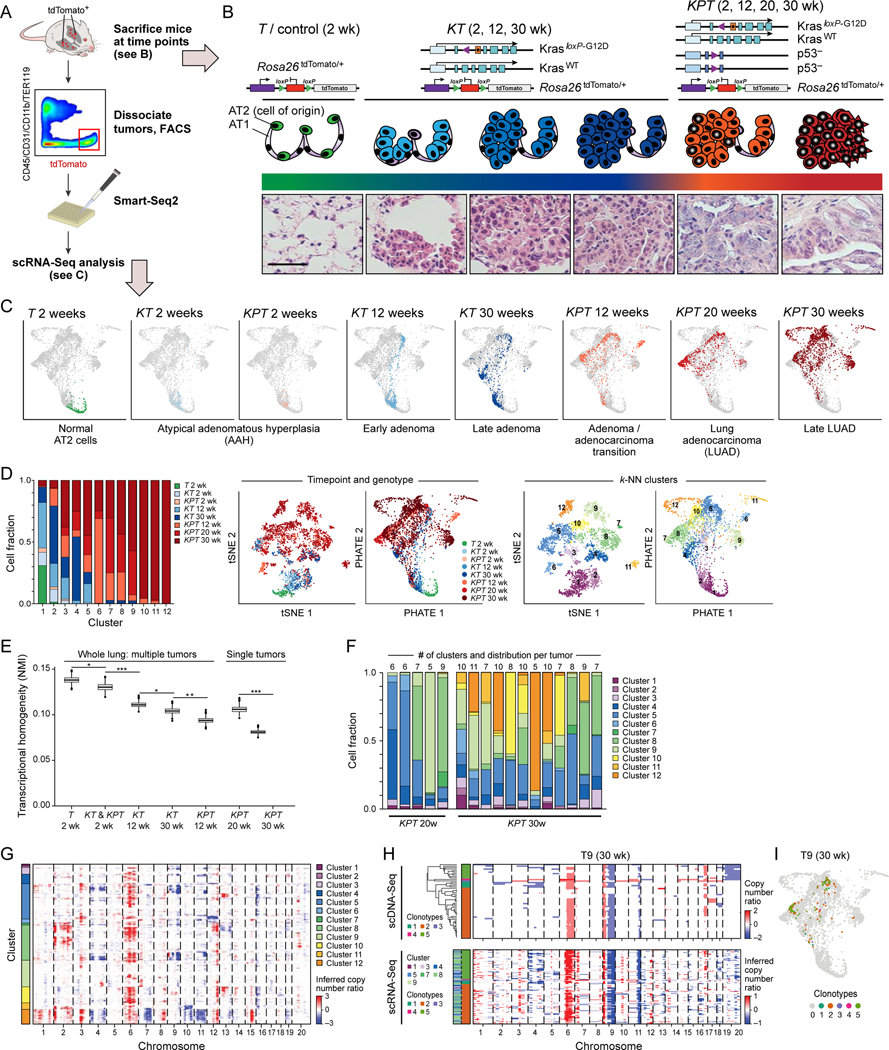
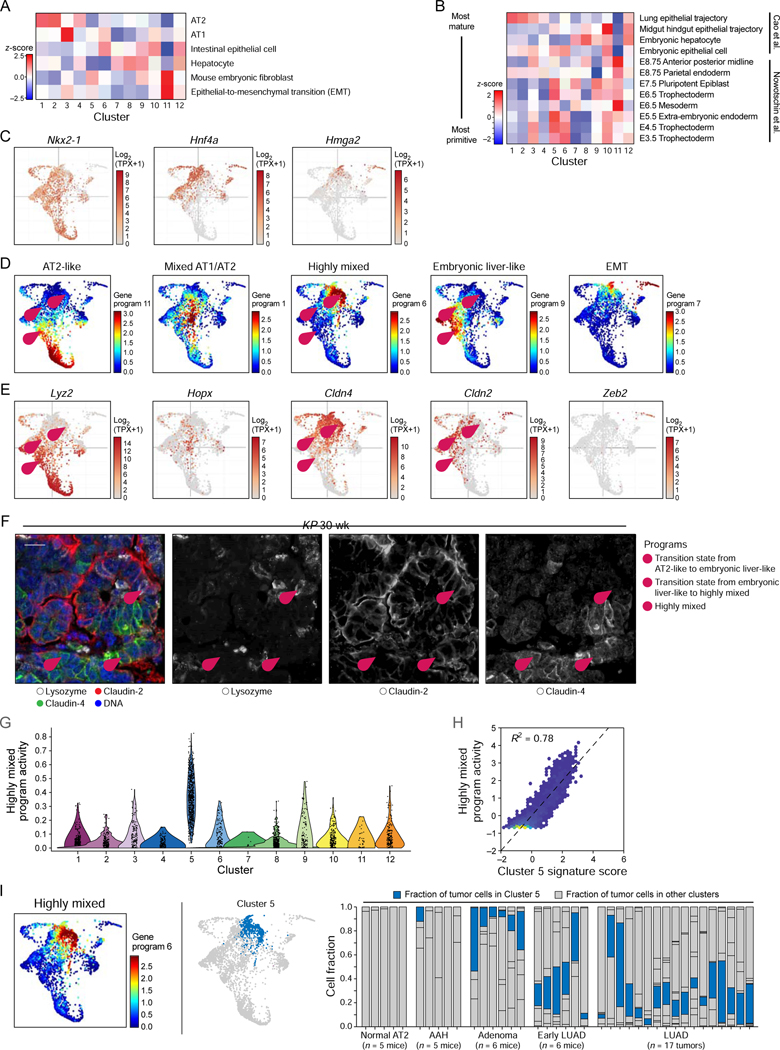
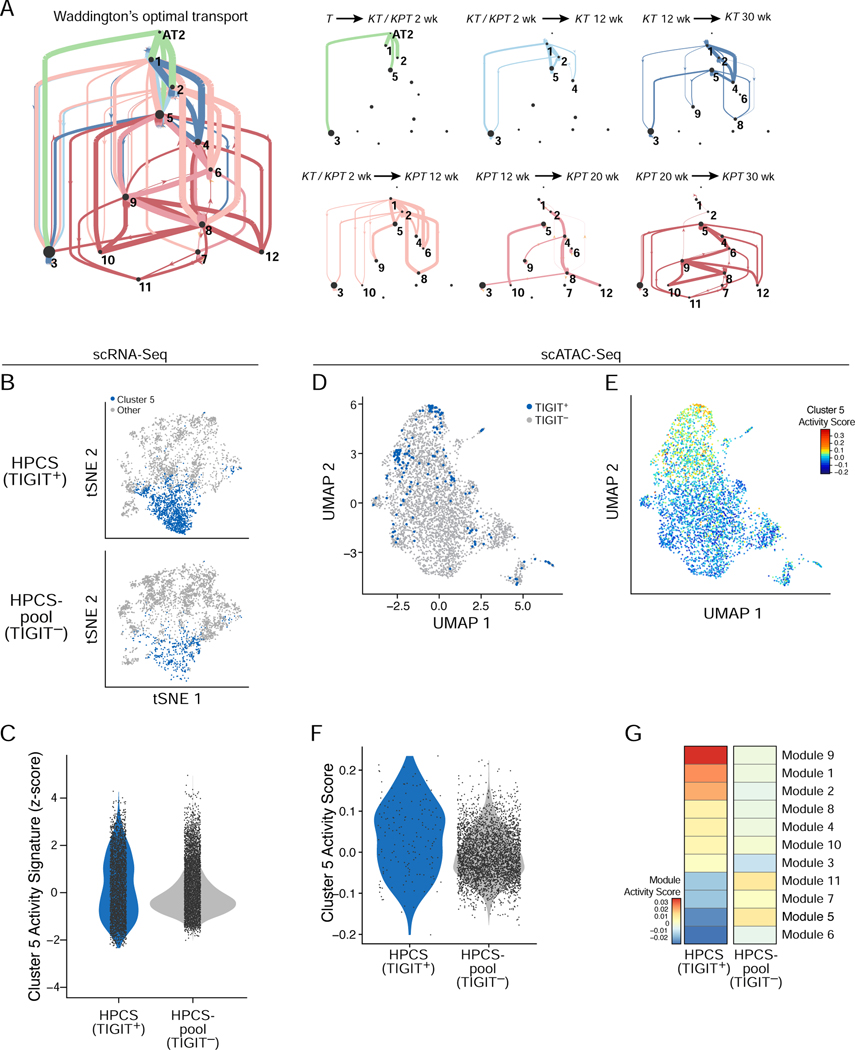
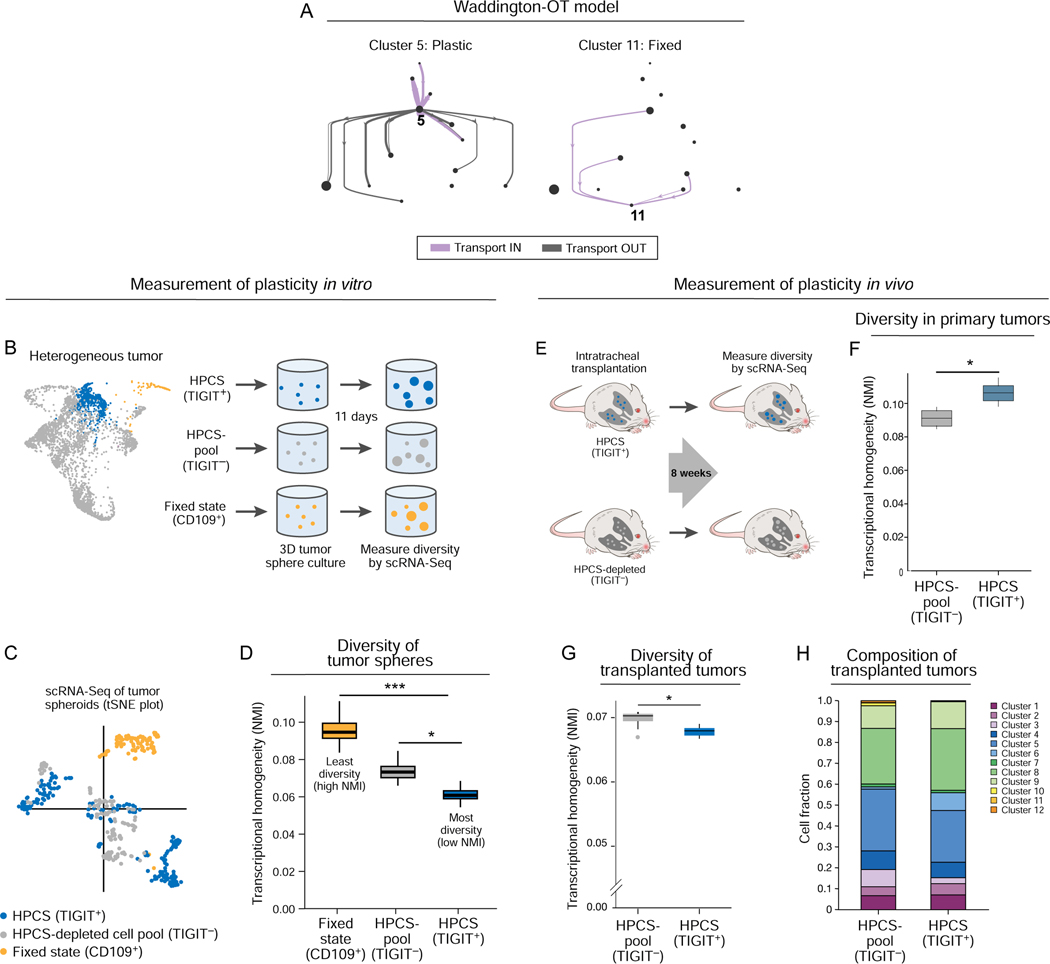
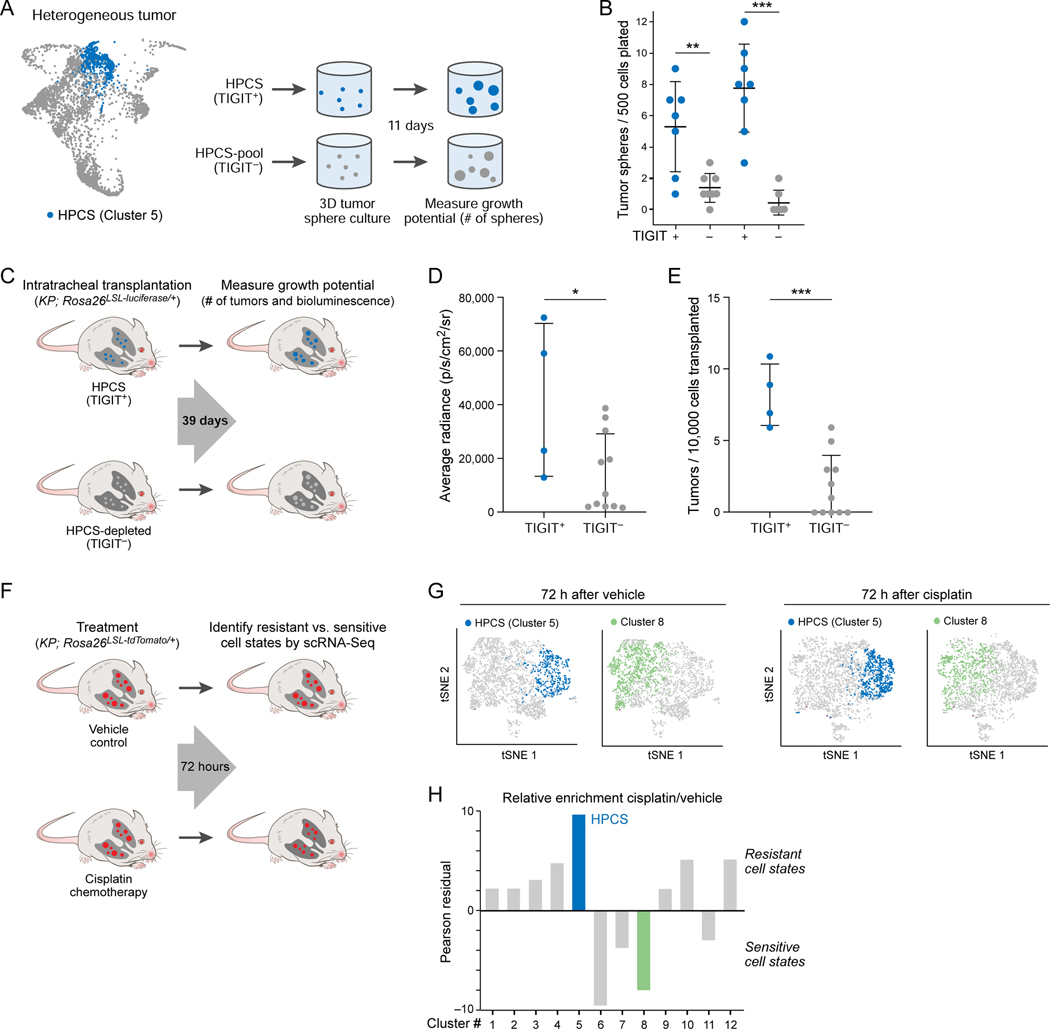
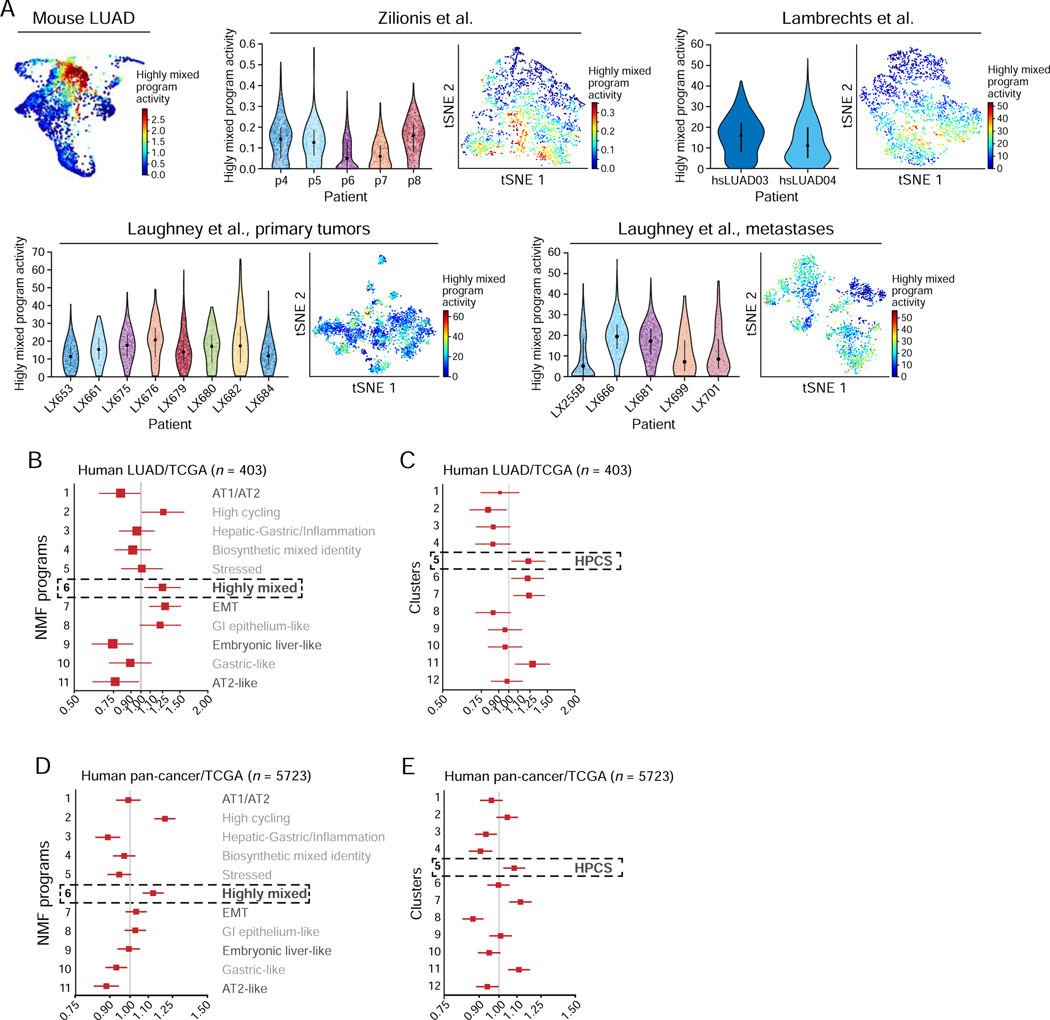
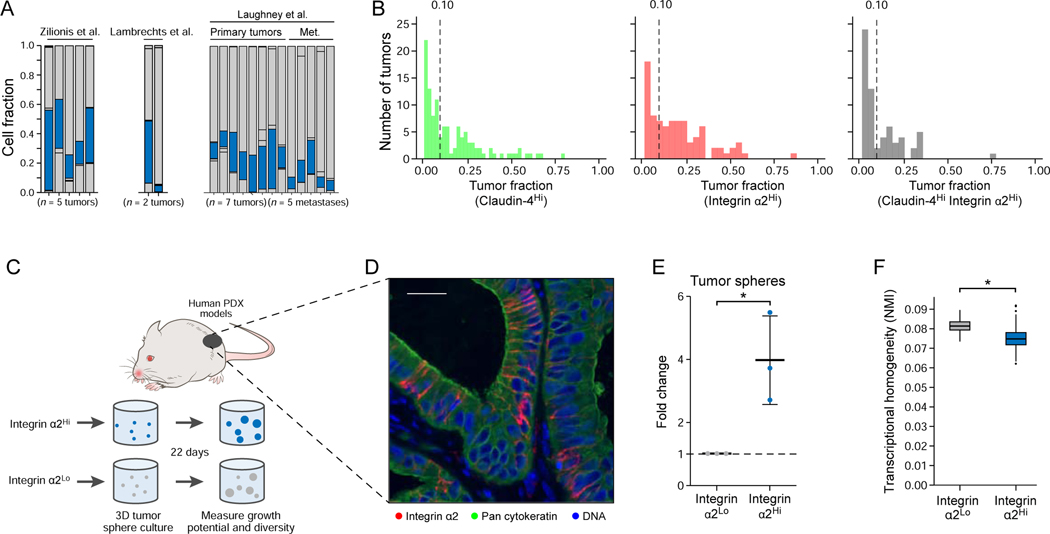
Tumor evolution from a single cell into a malignant, heterogeneous tissue remains poorly understood. Here, we profile single-cell transcriptomes of genetically engineered mouse lung tumors at seven stages, from pre-neoplastic hyperplasia to adenocarcinoma. The diversity of transcriptional states increases over time and is reproducible across tumors and mice. Cancer cells progressively adopt alternate lineage identities, computationally predicted to be mediated through a common transitional, high-plasticity cell state (HPCS). Accordingly, HPCS cells prospectively isolated from mouse tumors and human patient-derived xenografts display high capacity for differentiation and proliferation. The HPCS program is associated with poor survival across human cancers and demonstrates chemoresistance in mice. Our study reveals a central principle underpinning intra-tumoral heterogeneity and motivates therapeutic targeting of the HPCS.

Keywords: cell state transition; chromatin state; differentiation; drug resistance; lung cancer; plasticity; single-cell transcriptomics; tumor evolution; tumor heterogeneity; tumor progression.


Conflict of interest statement

Declaration of Interests T.J. is a member of the Board of Directors of Amgen and Thermo Fisher Scientific, and a co-Founder of Dragonfly Therapeutics and T2 Biosystems. T.J. serves on the Scientific Advisory Board of Dragonfly Therapeutics, SQZ Biotech, and Skyhawk Therapeutics. T.J. also received funding from Calico and currently receives funding from Johnson & Johnson, but this funding did not support the research described in this manuscript. A.R. is a co-founder and equity holder in Celsius Therapeutics and a SAB member for Thermo Fisher, Asimov, Neogene Therapeutics, and Syros Pharmaceuticals, and an equity holder of Immunitas Therapeutics. C.M.R. serves on the SAB of Bridge Medicines and Harpoon Therapeutics, and has consulted regarding oncology drug development with AbbVie, Amgen, Ascentage, Bicycle, Celgene, Daiichi Sankyo, Genentech, Ipsen, Loxo, Pharmamar, and Vavotek. None of the affiliations listed above represent a conflict of interest with the design or execution of this study or interpretation of data presented in this manuscript. Other authors have nothing to disclose.

Figures

Figure 1.
Figure 1.. Increased transcriptional heterogeneity in mouse lung adenocarcinoma (LUAD) evolution is reproducible across individual tumors and mice, but cannot fully be explained by gene copy number variation (CNV).
(A) Experimental pipeline. (B) Tumor evolution in a LUAD GEMM. Top: genetic constructs of three mouse models profiled by scRNA-Seq at different time points. Middle and bottom: schematic (middle) and hematoxylin & eosin staining of tissue sections (bottom) at different phases of tumor progression. AT1: normal alveolar type 1 (AT1) cells; AT2: normal alveolar type 2 (AT2) cells, AAH: atypical adenomatous hyperplasia. Scale bar: 100 μm. (C) PHATE map embedding (STAR Methods) of scRNA-Seq profiles (dots) collected from the models and time points in (B) (labels, top). Colored dots: Cells collected from the indicated sample; grey dots: all other cells. (D) Increased diversity of cell clusters with progression. Left: The fraction of cells (y axis) in each cluster (x axis) that are derived from each sample type (genotype and time point; colored as in (C)). Middle and Right: matched t-stochastic neighbor embedding (tSNE, left plot, STAR Methods) and PHATE map embedding (right plot, as in (C)) colored by either sample type (middle pair) or cluster number (STAR Methods) (right pair). (E) Reduced transcriptional homogeneity within time point with progression. Transcriptional heterogeneity is inversely proportional to the Normalized Mutual Information (NMI, y axis) between cells within in each sample type (genotype/time point combination, x axis), for either whole lung samples or microdissected single tumors. Box plots: upper, median, and lower quartile of 1,000 bootstrap samples, of 50 cells each, from the indicated time point; whiskers: 1.5 interquartile range. * p < 0.05, ** p < 0.01, *** p < 0.001 (STAR Methods). (F) Fraction of cells (y axis) in sample (x axis) that are members of each cluster (color code, as in D, right). The number of clusters observed in each individually plucked tumor is indicated at the top of the bars. (G) CNVs (red: amplifications, blue: deletions) across the chromosomes (columns) inferred from the scRNA-Seq of each cell (rows) from 12 KP tumors at the 30-week time point (STAR Methods). Color: the cluster membership of each cell. (H) Congruence between CNV profiles inferred from scDNA-Seq and scRNA-Seq. CNVs shown as in (G) for single cells (rows) of one individually microdissected KPT tumor at 30 weeks profiled by scDNA-Seq (top-left) or scRNA-Seq (bottom-left). Left color bar: Predominant clonotypes identified from scDNA-Seq (top-left) and assigned to scRNA-Seq cells (bottom-left). Far left color bar in scRNA-Seq panels: cell cluster membership as in (G). (I) A single clonotype matches multiple transcriptional states. PHATE map as in Figure 1D, colored by clonotype. See also related Figure S1.
Figure 2.
Figure 2.. Loss of lung lineage fidelity in LUAD progression and emergence of a highly mixed identity program.
(A, B) Signature score (color bar, STAR Methods) of either adult [(Han et al., 2018; Zhang et al., 2019); (A), z-score)] or embryonic [(Cao et al., 2019; Nowotschin et al., 2019); (B), z-score)] mouse cell signatures in the cells of each cluster (columns). In (B), signatures (rows) are ordered from most differentiated (top) to most primitive (bottom) cells. (C) PHATE maps (as in Figure 1D), with cells (dots) colored by expression (Log2(TPX+1), color bar) of Nkx2–1, Hnf4a, and Hmga2. (D, E) Five key gene programs highlight alternative cell type programs, two key transition states and an EMT-like state. PHATE map (as in Figure 1D), with cells (dots) colored either by the activity of each program (D, NMF loading, color bar, see Figure S2C for additional programs, STAR Methods) or by the expression level (E, Log2(TPX+1), color bar) of a selected marker from the corresponding program. (F) Immunofluorescence for Lysozyme (AT2-like program), Claudin-2 (hepatocyte-like program), and Claudin-4 (highly mixed program). Pink numbered arrowheads indicate cell states or transitions in (D-F): 1 - AT2-like (lysozyme) to Embryonic liver-like (Claudin-2) transition; 2 – Embryonic liver-like (Claudin-2) to Highly mixed (Claudin-4) transition; 3 - Highly mixed program (Claudin-4). Scale bar: 20 μm. (G) Cells from cluster 5 show significantly elevated activity of the Highly mixed NMF program (t-test, p < 1×10 −16). (H) Cell scores for Highly mixed program (y axis) and a cluster 5 signature (x axis). Pearson R2 = 0.78. Lighter dot color indicates higher cell density. (I) PHATE map embedding as in Figure 1D, with cells (dots) colored by score of the highly mixed program (left) or by cluster 5 membership (blue, middle). Right: Proportion of cells (y axis) from cluster 5 (blue) in each sample (mouse or tumor; x axis), ordered by tumor progression. See also related Figure S2 and Table S2.
Figure 3.
Figure 3.. Identification of a highly plastic cell state with a distinct chromatin accessibility profile.
(A) Probability of cell state transitions as predicted by an optimal transport model. Two cell clusters (nodes, proportional to ‘pagerank’ score – proportion of time spent at node on a random walk) A and B are connected by a directed edge from A to B, if the cells in cluster A at time point t (color code, as in Figure 1B,C) are predicted by the optimal transport model to be ancestors of cells in cluster B at the next time point in that model. Edge thickness is proportional to the probability of the transition predicted by the model (low probability edges < 0.1, are excluded for graphical clarity). Right: Sub-graphs showing only edges between clusters for selected time couplings (labels, top) are on the right. Line width is proportional to the probability of transition ranges from <0.01 for the thinnest line to 0.65 for the thickest line. Dot size is proportional to the pagerank importance of each node, i.e. the amount of “time” spent in a random walk on the graph in any given node. (B) tSNE of cell profiles from primary tumor cells sorted as TIGIT+ (top) and TIGIT (bottom) sampled to the same cell numbers, colored by membership in cluster 5 (blue). Cells sorted from n = 12 mice. (C) Distribution of cluster 5/HPCS signature score (y axis) in TIGIT+ and TIGIT cells (p = 3.08 × 10⁻²⁵; Mann-Whitney U test). (D) UMAP embedding of scATAC-Seq profiles from 164 TIGIT+ (blue) and 3,787 TIGIT (grey) cells from dissociated primary tumors of n = 5 mice (E) UMAP as in (D) but with cells colored by cluster 5/HPCS gene activity signature scores. (F) Distribution of cluster 5/HPCS gene activity signature score (y axis) in scATAC-Seq profiles of TIGIT+ and TIGIT cells from n = 5 mice (p = 1.8×10⁻⁶, Wilcoxon rank-sum test). (G) Activity scores (color bar) of chromatin state modules (rows, from LaFave et al.) in TIGIT+ and TIGIT sorted cells (columns) from n = 5 mice. See also related Figure S3 and Table S3.
Figure 4.
Figure 4.. Prospectively isolated HPCS cells display high differentiation potential in vitro and in vivo.
(A) Prediction of plastic and static cell states by the optimal transport model. Graph as in Figure 3A, but showing all transitions (aggregate across all time points) to and from cluster 5 (left) or 11 (right) cells. (B) Experimental design. TIGIT+ HPCS/cluster 5 cells (blue), CD109+(cluster 11) cells (gold), and all non-HPCS TIGIT cells (grey) were sorted from 17–22 week old LUAD tumors, and grown as tumor spheres for 11 days, followed by scRNA-Seq. (C) tSNE of scRNA-Seq profiles of cells from tumor spheres arising from TIGIT+ (blue), CD109+ (gold) and TIGIT (grey) KP or KPT LUAD cells at 11 days after cell plating (n = 7 mice). (D) Transcriptional homogeneity. Normalized Mutual Information (NMI, y axis) between each of the three populations. Box plots: upper, median, lower quartile of 1,000 bootstrap samples, of 50 cells each, from the indicated time point; whiskers: 1.5 interquartile range. * p < 0.05, *** p < 0.001 (STAR Methods). (E) Experimental design. TIGIT+ HPCS/cluster 5 cells (blue) and all non-HPCS TIGIT cells (grey) were sorted from 18–21 week LUAD tumors, and orthotopically transplanted to lungs of NSG mice. (F) Normalized Mutual Information (NMI, y axis) within TIGIT+ and TIGIT populations. Box plots: upper, median, lower quartile of 1,000 bootstrap samples, of 100 cells each, from the indicated time point; whiskers: 1.5 interquartile range. * p < 0.05 (n = 2 biological replicates, STAR Methods) (n = 6 mice). (G) NMI (y axis) between each population. Box plots: upper, median, lower quartile of 1,000 bootstrap samples, of 50 cells each, from the indicated time point; whiskers: 1.5 interquartile range. * p < 0.05. (H) Relative proportion of cells from TIGIT+ and TIGIT transplanted primary tumor cells in each cluster (n = 5 TIGIT vs 3 TIGIT+ allotransplant mice).
Figure 5.
Figure 5.. LUAD cells in the HPCS show high growth potential in vitro and in vivo, and are chemoresistant in vivo.
(A) Experimental design. TIGIT+ HPCS/cluster 5 cells (blue) and all non-HPSC TIGIT cells (grey) were sorted from 17–22 week LUAD tumors, and grown as tumor spheres for 11 days, as in Figure 4B. (B) Number of tumor spheres per 500 cells plated (y axis) arising in individual tumor spheres (dots) from TIGIT+ vs. TIGIT KPT LUAD cells after 11 days in 3D culture (x axis). Data plotted as mean ± S.D. Two independent biological replicates are shown. ** p < 0.01; *** p < 0.001 (unpaired t-test). (C) Experimental design. TIGIT+ HPCS/cluster 5 cells (blue) and all non-HPCS TIGIT LUAD cells (grey) expressing firefly luciferase were sorted from 18–21-week tumors and orthotopically allotransplanted into immunodeficient NSG mice. Bioluminescence imaging and tumor harvest were performed at 39 days post-transplantation. (D) Average radiance (y axis) in allotransplanted tumors derived from TIGIT+ and TIGIT sorted cells. Data plotted as mean ± S.D. * p < 0.05 (t-test; n = 4 TIGIT+ vs 11 TIGIT allotransplants). (E) Number of surface tumors per 10,000 transplanted cells (y axis) for TIGIT+ or TIGIT cells in lungs of recipient mice. Data plotted as mean ± S.D. *** p < 0.001 (t-test). (F) Experimental design. Mice with 20-week LUAD tumors were subjected to treatment with vehicle or cisplatin (7 mg/kg); tumors were harvested after 72 hours. (G) tSNE of scRNA-Seq profiles from 20-week KPT LUAD tumors, collected 72 hours after administration of vehicle or cisplatin, colored by predicted membership (STAR Methods) in cluster 5 (blue) or 8 (green). Two independent mice were used per condition. (H) Relative enrichment (y axis, Pearson’s residual: (observed number of cells − expected number of cells)/expected number of cells, STAR Methods) of cells in different clusters (x axis), after cisplatin treatment in KPT LUAD tumors in vivo. See also related Figure S4.
Figure 6.
Figure 6.. HPCS-like program is expressed in human tumors and associates with poor survival.
(A) The high-plasticity program is expressed in individual malignant cells from human LUAD tumors. Left: PHATE map of the mouse LUAD cells (as in Figure 2D), colored by the program score. Right: For each of three scRNA-Seq studies of cancer cells from human LUAD tumors, shown are the violin plot (left) of the distribution of the Highly mixed/HPCS program scores (y axis) in the cancer cells of each tumor (x axis), and a tSNE of the profiles, with cells (dots) colored by their program scores. (B) Hazard ratio (HR, x axis, mean HR and 95%-confidence interval) for each NMF program (y axis) in LUAD patients in the TCGA as predicted by a Cox proportional hazards model independently fit to each NMF activity term as a continuous variable (n = 403; STAR Methods). (C) Hazard ratio (HR, x axis, mean HR and 95%-confidence interval) for each cluster (y axis) in LUAD patients in the TCGA as predicted by a Cox proportional hazards model independently fit to each cluster activity term as a continuous variable (n = 403; STAR Methods). (D) Hazard ratio (HR, x axis, mean HR and 95%-confidence interval) for each NMF program (y axis) across all tumors with tumor purity information in TCGA (n = 5723) as predicted by a Cox proportional hazards model independently fit to each NMF activity term as a continuous variable (STAR Methods). (E) Hazard ratio (HR, x axis, mean HR and 95%-confidence interval) for each cluster (y axis) in all cancer patients in the TCGA as predicted by a Cox proportional hazards model independently fit to each cluster activity term as a continuous variable (n = 5723; STAR Methods). See also related Figure S5 and Table S5.
Figure 7.
Figure 7.. Integrin α2Hi LUAD HPCS cells isolated from human patient-derived xenografts harbor high growth potential and plasticity.
(A) Cells in the HPCS are present across all profiled tumors. Fraction of cells that were mappable (y axis) from each tumor (x axis) that express the HPCS-like program. (B) Histograms showing the distribution of the fraction of pan-cytokeratin positive cells in human LUAD tissues staining for: Claudin-4 (left), Integrin α2 (middle), and both together (right). Vertical dotted lines represent the point at which at least 10% of a tumor stained strongly positive. (C) Experimental design. Integrin α2Hi and integrin α2Lo LUAD cells were isolated from three distinct human patient-derived xenograft (PDX) models, followed by 3D tumor sphere culture for 22 days. (D) Pan-cytokeratin and integrin α2 immunofluorescence in one of the PDX models. Scale bar: 50 μm. (E) Fold change in growth (y axis) of tumor spheres derived from integrin α2Hi and integrin α2Lo cells. Data plotted as mean ± S.D. * p = 0.0216 (t test of the log2 transform of the shown fold change; n = 3 biological replicates) (F) NMI (y axis) between each population. Box plots: upper, median, lower quartile of 1,000 bootstrap samples, of 50 cells each, from the indicated time point; whiskers: 1.5 interquartile range. * p < 0.05 (STAR Methods). See also related Figure S6.

Comment in

References

    1. Ambrogio C, Gomez-Lopez G, Falcone M, Vidal A, Nadal E, Crosetto N, Blasco RB, Fernandez-Marcos PJ, Sanchez-Cespedes M, Ren X, et al. (2016). Combined inhibition of DDR1 and Notch signaling is a therapeutic strategy for KRAS-driven lung adenocarcinoma. Nat Med 22, 270–277. - PubMed
    1. Arozarena I, and Wellbrock C. (2019). Phenotype plasticity as enabler of melanoma progression and therapy resistance. Nat Rev Cancer 19, 377–391. - PubMed
    1. Batlle E, and Clevers H. (2017). Cancer stem cells revisited. Nat Med 23, 1124–1134. - PubMed
    1. Beltran H, Hruszkewycz A, Scher HI, Hildesheim J, Isaacs J, Yu EY, Kelly K, Lin D, Dicker A, Arnold J, et al. (2019). The Role of Lineage Plasticity in Prostate Cancer Therapy Resistance. Clin Cancer Res 25, 6916–6924. - PMC - PubMed
    1. Bystrykh L, Weersing E, Dontje B, Sutton S, Pletcher MT, Wiltshire T, Su AI, Vellenga E, Wang J, Manly KF, et al. (2005). Uncovering regulatory pathways that affect hematopoietic stem cell function using ‘genetical genomics’. Nat Genet 37, 225–232. - PubMed

Publication types

LinkOut - more resources