. 2020 Aug 10;38(2):212-228.e13.
doi: 10.1016/j.ccell.2020.06.006. Epub 2020 Jul 23.

Epigenomic State Transitions Characterize Tumor Progression in Mouse Lung Adenocarcinoma

Affiliations

Epigenomic State Transitions Characterize Tumor Progression in Mouse Lung Adenocarcinoma

Lindsay M LaFave et al. Cancer Cell. .

Erratum in

Abstract

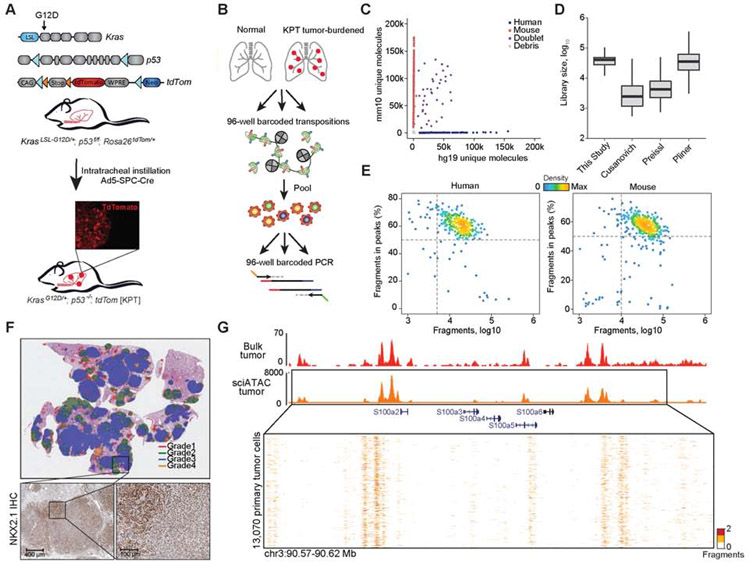
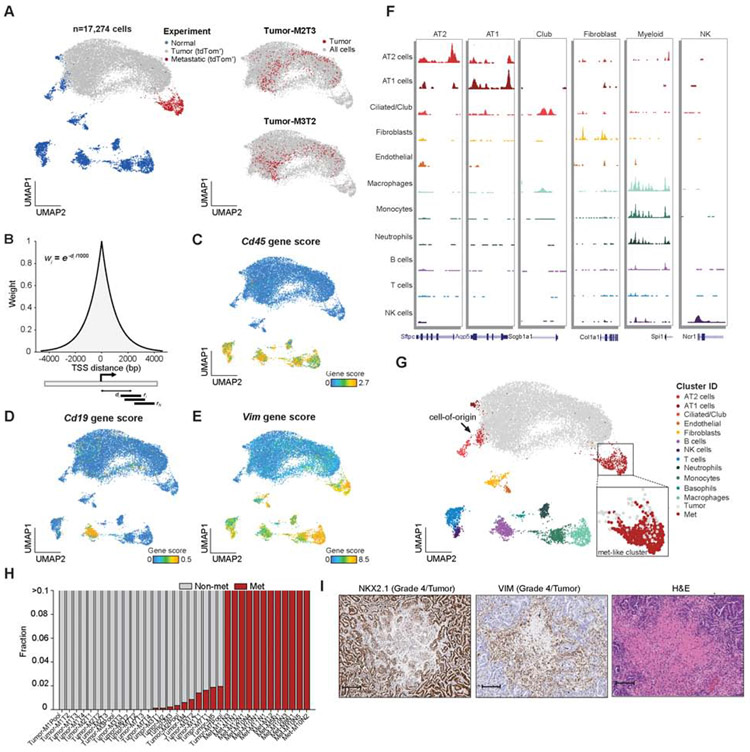
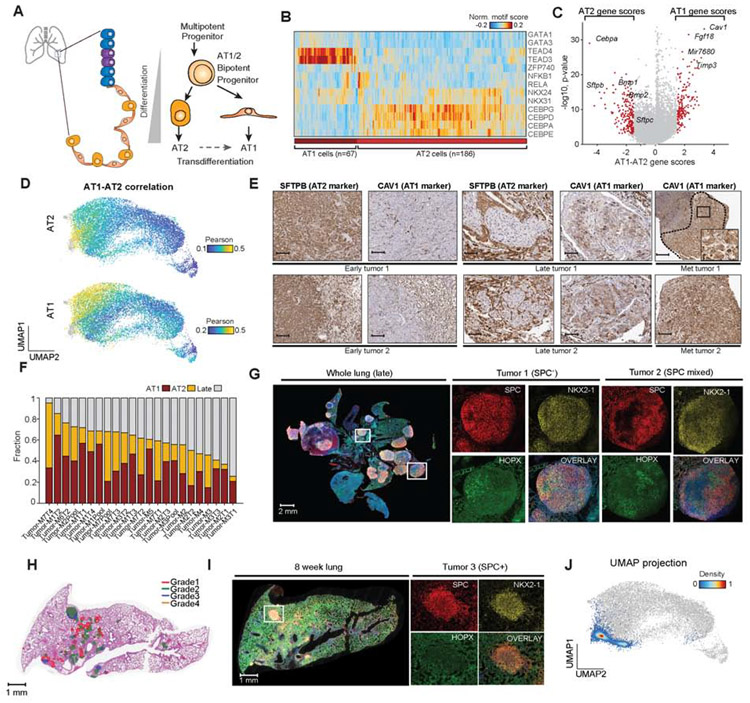
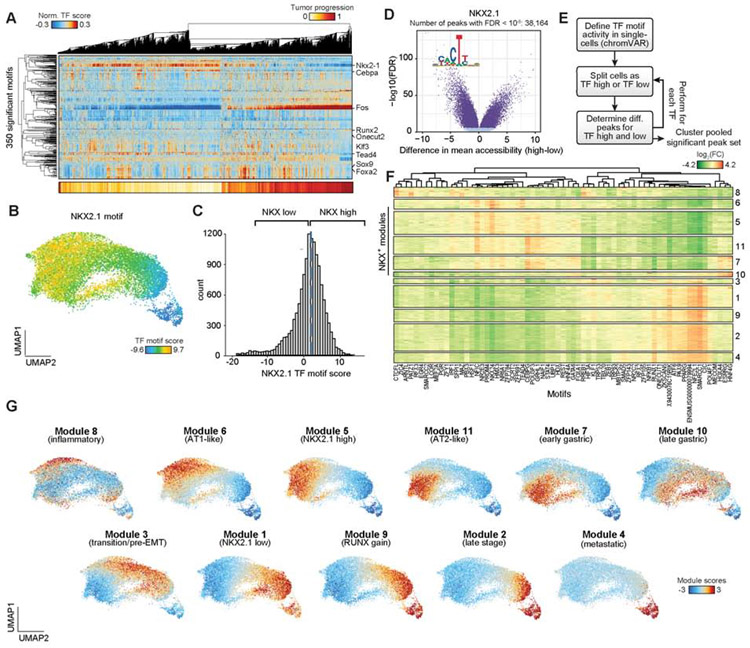
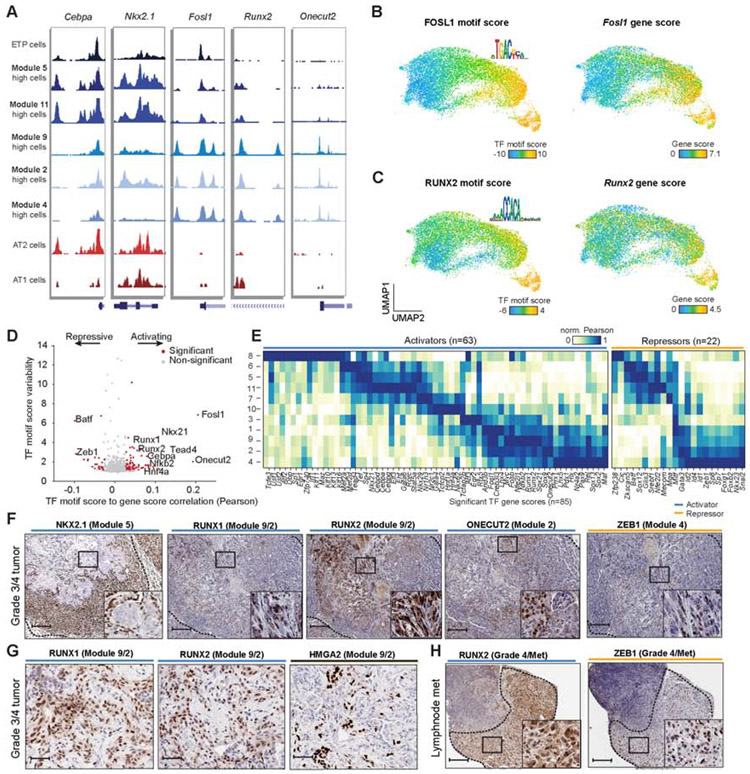
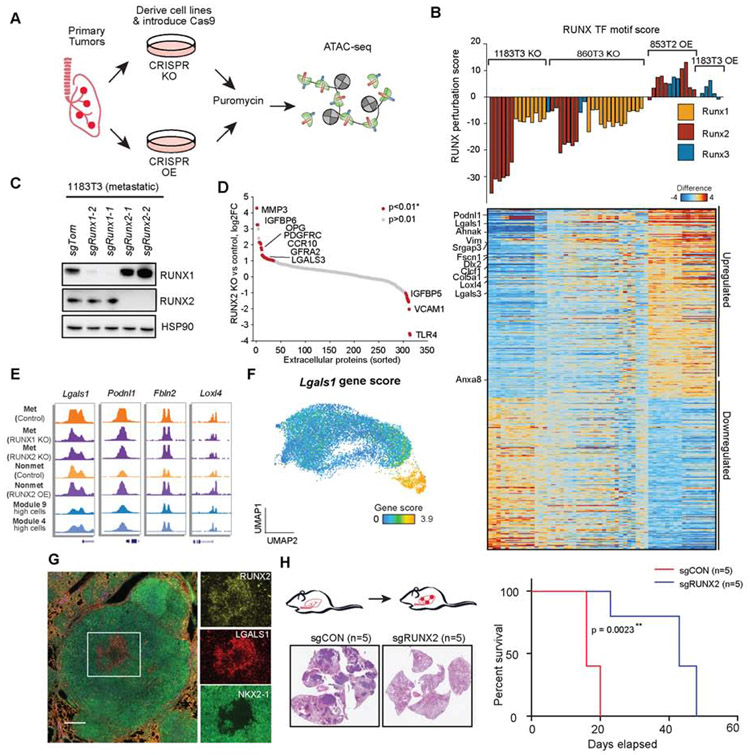
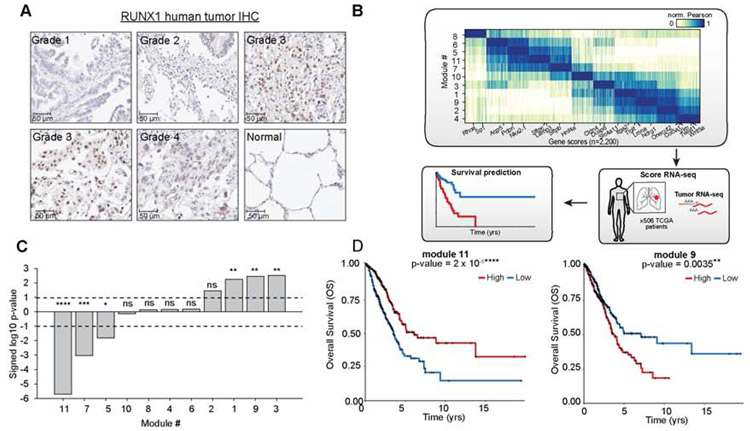
Regulatory networks that maintain functional, differentiated cell states are often dysregulated in tumor development. Here, we use single-cell epigenomics to profile chromatin state transitions in a mouse model of lung adenocarcinoma (LUAD). We identify an epigenomic continuum representing loss of cellular identity and progression toward a metastatic state. We define co-accessible regulatory programs and infer key activating and repressive chromatin regulators of these cell states. Among these co-accessibility programs, we identify a pre-metastatic transition, characterized by activation of RUNX transcription factors, which mediates extracellular matrix remodeling to promote metastasis and is predictive of survival across human LUAD patients. Together, these results demonstrate the power of single-cell epigenomics to identify regulatory programs to uncover mechanisms and key biomarkers of tumor progression.

Keywords: cancer; epigenomics; epithelial-to-mesenchymal transition; metastasis; non-small cell lung cancer; single cell.


Conflict of interest statement

Declaration of Interests T.J. is a member of the Board of Directors of Amgen and Thermo Fisher Scientific. He is also a co-Founder of Dragonfly Therapeutics and T2 Biosystems. T.J. serves on the Scientific Advisory Board of Dragonfly Therapeutics, SQZ Biotech, and Skyhawk Therapeutics. None of these affiliations represent a conflict of interest with respect to the design or execution of this study or interpretation of data presented in this manuscript. T.J. laboratory currently also receives funding from the Johnson & Johnson Lung Cancer Initiative and The Lustgarten Foundation for Pancreatic Cancer Research, but this funding did not support the research described in this manuscript. J.D.B. holds patents related to ATAC-seq and single-cell ATAC-seq and serves on the Scientific Advisory Board of CAMP4 Therapeutics and seqWell. A.R. is a co-founder and equity holder of Celsius Therapeutics, an equity holder in Immunitas, and an SAB member of Thermo Fisher Scientific, Syros Pharmaceuticals, Asimov, and Neogene Therapeutics.

Figures

Figure 1.
Figure 1.. An optimized single-cell ATAC-seq approach enabled analyses of single KP tumor cells.
(A) Schematic of alleles in the KPT model, LSL: lox-stop-lox; loxp (blue arrows); FRT site (orange arrows). Inset immunofluorescence (IF) image of a tdTom positive (tdTom+) tumor. (B) Schematic of sciATAC-seq strategy for single-cell profiling of tdTom+ cancer cells. (C) Unique fragments from species-mixing experiment of GM12878 (n = 1) and 3T3 cells (n = 1). (D) Estimated library sizes of published data (Cusanovich et al., 2015; Pliner et al., 2018; Preissl et al., 2018) and this study, derived from GM12878 cells. Box intervals represent 25% and 75% bounds. (E) FRIP by total fragments recovered from GM12878 and 3T3 cells. (F) IHC of a tumor-burdened lung at 30 weeks after tumor initiation in KPT model, representing H&E with Aiforia defined grades (top) and NKX2.1 IHC (scale bar; bottom, left 400 μm and right 100 μm). (G) Chromatin accessibility tracks generated from bulk ATAC-seq of a KPT tumor (red) (n = 1) and aggregated single-cell from a primary KPT tumor (n = 13,070; orange) at the S100 gene family locus. see also Fig. S1 and Table S1.
Figure 2.
Figure 2.. Single-cell chromatin accessibility data defined heterogeneous normal and KP cell states.
(A) UMAP visualization of normal and KPT cancer cells profiled by sciATAC-seq. Individual samples are labeled by mouse number (M1-M12), primary tumor (T1-T5, pool), or metastatic tumor number (N1-N5); color codes represent normal (n = 2), immune-depleted normal lung (n = 1), tdTom+ cells isolated from lung tumors (n = 23), lymph node or thymic metastases (n = 15), and liver metastases (n = 3). Two examples highlighted in red of individual tumors are shown (right). (B) Schematic of approach to calculate gene scores using an exponential decay function. Individual fragments are weighted based on the inverse distance to the TSSs, then summed across the chosen window (9,212 bp) reflecting 1% of the total weight for the chosen exponential half-life (1 kb). (C-E) Example gene scores are shown on the UMAP for Cd45 (C), Cd19 (D) and Vim (E). (F) Chromatin accessibility tracks for normal cell clusters at lineage-defining marker genes; track with associated genomic location shown (bottom). (G) Normal cell-type cluster identities shown on the UMAP of single-cells, tumor and metastatic cells labeled in gray and red, respectively, with inset zoom of the metastatic-like cluster. (H) Fractions of cancer cells within individual tumors that cluster with metastatic cells (red) or with cells derived from the primary tumor (gray) (n = 35). (I) Images of NKX2.1, VIM and H&E staining of a representative grade 4 region (zoom 9.5X; scale bar, 100 μm). see also Fig. S2, Table S1 and Data S1.
Figure 3.
Figure 3.. KPT cancer cells reflected AT1 and AT2 epigenomic states.
(A) Schematic of epithelial cell types and alveolar differentiation hierarchy. (B) Hierarchical clustering of AT1 (n = 67) and AT2 (n = 186) cells based on top significant TF motif scores, labeled by AT1 and AT2 cluster identity (bottom). (C) Volcano plot of differential gene scores between AT1 versus AT2 cells. Genes with a differential gene score greater than 1.8 or less than −1.8 are highlighted in red with −log10 p value shown. (D) Correlation of each cancer cell to normal AT1 and AT2 cells using gene score signatures. Cells are colored by their Pearson r differential correlation coefficients. (E) Images of serial sections of early KP tumors (n = 2), late KP tumors (n = 2), and lymph node metastases (n = 2) stained for SFTPB (AT2 marker) and CAV1 (AT1 marker) (scale bar, 250 μm except Met tumor 2 125 μm; inset, 50 μm). (F) Fraction of single cancer cells per sample that resemble AT1-like, AT2-like or late-stage cells; red=AT1, orange=AT2 and gray=late (n = 23). (G) Multiplexed IHC in a late-stage tumor sample; whole lung and two individual tumors shown; red (SPC; AT2), yellow (NKX2-1), green (HOPX; AT1), and overlay with DAPI (scale bar; whole lung, 0.5x, 2000 μm; tumor 1; 7.5x, 200 μm; tumor 2; 4.5x, 200 μm). (H) Aiforia graded 8-week tumor-burdened lung (red=grade 1, green=grade 2, blue=grade 3, and orange=grade 4). (I) Multiplexed IHC staining of an exemplar lung lobe at 8 weeks post-initiation stained with SPC (red), NKX2-1 (yellow), HOPX (green) and overlaid channels with DAPI. tdTom+ cells from entire lung used for scATAC-seq profiling (scale bar; whole lung, 0.7x, 1000 μm; tumors; 10x, 100 μm). (J) scATAC-seq profiling and projection of early time point (ETP) cells (n = 4,610) onto the original UMAP clustering of all lung cells (gray points). ETP cells are colored by cluster density. see also Fig. S3 and Table S2.
Figure 4.
Figure 4.. Chromatin co-accessibility modules defined cell state transitions during tumor progression.
(A) Hierarchical clustering of cancer cells (n = 13,670) using significant TF motif scores (n = 350 motifs) associated with tumor progression score as calculated by a distance from a fit polynomial line (bottom). (B) UMAP of cancer cells colored by NKX2.1 TF motif score. (C) Histogram of NKX2.1 TF motif scores for all cancer cells. Cells are delineated as “high” or “low” based on the median motif score across cancer cells (blue dashed line). (D) Differential chromatin accessibility for each peak between NKX2.1 TF motif “high” or “low” cells. Peaks with a significant FDR (q < 10−6) calculated by a two-sample Student’s t-test are shown in dark blue. (E) Schematic depicting the co-accessibility module analysis workflow. (F) Clustering of differential TF motif associated peaks (n = 74,732 rows) using the log2 fold-change (FC) of mean accessibility between “high” versus “low” cell groups per TF motif (n = 67 columns). Clustering is performed based on the Louvain method. Peaks are hierarchically clustered per module for visualization. (G) UMAP plots highlighting single-cell module scores for cancer cells. see also Fig. S4 and Table S3.
Figure 5.
Figure 5.. Regulatory analysis of cancer cells identified chromatin activators and repressors.
(A) Chromatin accessibility tracks for cells with high module scores and normal AT1/AT2 cells respectively at key transcription factors. Modules include early time point (ETP), early-stage (5, 11) and late-stage (9, 2, 4) modules. Module high was defined as two standard deviations above the mean module score across cells. (B-C) UMAP highlighting single-cell TF motif scores and motif logos (left), and gene scores (right) for FOSL1 (B) and RUNX2 (C) in cancer cells. (D) Correlation of TF motif scores with gene scores for each TF (n = 769) plotted against the TF motif score variability. Significantly variable TF motifs (motif score s.d. ≥ 1.2) correlated with their gene score (permutation p < 0.001) are shown in red; TFs with positive or negative correlation are highlighted as activators or repressors, respectively. Permutation p values were calcuated using a Z-test between the observed TF-motif gene correlation coefficient to the permuted correlation coefficients. TF motif scores signficiance was computed with deviation Z-scores across cells. (E) Normalized correlation (max/min normalized using Pearson r correlations) of TF gene scores to module scores delineated by activators (n = 58) and repressors (n = 14). (F) IHC of heterogeneous late-stage TFs stained for NKX2.1 (module 5), RUNX1 (module 9/2), RUNX2 (module 9/2), ONECUT2 (module 2), and ZEB1 (module 4) at 250 μm, inset 50 μm (n = 1). (G) Grade 4 regions stained for RUNX1, RUNX2 and HMGA2 (n = 1). (H) Lymph node tumors stain for RUNX2 and ZEB1 (250 μm, inset 50 μm; n = 1). see also Fig. S5 and Table S4.
Figure 6.
Figure 6.. CRISPR perturbation revealed RUNX TFs regulate extracellular matrix remodeling.
(A) Schematic of the strategy used to OE or KO TFs in tumor-derived KP cell lines. (B) Hierarchical (KO or OE vs control) RUNX TF motif scores (defined by RUNX perturbation score; top, bar plot) and associated differential gene scores (KO or OE vs control; bottom, heatmap) for each RUNX1, RUNX2, or RUNX3 KO (1183T3 and 860T3; metastatic) or OE (853T2; non-metastatic) bulk ATAC-seq experiment. RUNX perturbation score was determined using the slope from a linear regression. Samples include 1183T3: controls (n=10), RUNX1 KO (n = 10), RUNX2 KO (n = 6), RUNX3 KO (n = 1), RUNX2 OE (n = 2), RUNX3 OE (n = 3); 860T3: controls (n=10), RUNX1 KO (n = 15), RUNX2 KO (n = 7), RUNX3 KO (n = 3); 853T2 controls (n = 5), RUNX2 OE (n = 10), 853T2 RUNX3 OE (n = 3). (C) RUNX1 and RUNX2 expression in CRISPR KO cells from two independent guides as assessed by western blot; HSP90 shown as a loading control. (D) Log2 fold-change (RUNX KO vs control) of extracellular matrix proteins from a metastatic cell line (1183T3) with control (sgCON) (n = 1) or sgRunx2 (n = 1). Arrays with duplicate antibody spots and p values were determined by a Z-test (p<0.01*). (E) Chromatin accessibility tracks at differential RUNX genes (identified in panel B) for representative metastatic sgCON (control), metastatic sgRunx2 (KO), non-metastatic sgCON (control), and non-metastatic Runx2 (OE), and module-high cells (for comparison to KPT model). (F) Gene score for Lgals1 derived from cancer cells. (G) Multiplexed IHC for late-stage region in KPT tumor. Overlaid image (left), individual channel insets: green (NKX2-1), yellow (RUNX2), and red (LGALS1) (scale bar; whole tumor 2.4x, 500 μm; zoomed region, 7.5x, 200 μm). (H) Intravenous metastasis experiments with schematic for tail vein injection (left top). Exemplar IHC stains for example control and sgRUNX2 KO tumors (left bottom) (n = 5 per arm, repeated in triplicate). Survival curve (right) with log-rank p value (n = 5 per arm) with survival log-rank (Mantel-Cox) test. ** represents p<0.01. see also Fig. S6 and Table S5.
Figure 7:
Figure 7:. Module-associated genes were predictive of survival across human LUAD cases.
(A) LUAD tumor microarray (TMA) map stained with RUNX1. Individual images of tumor sections with grade indicated on tumor image. (B) Schematic of human module survival analyses. Module-specific genes from mouse cancer cells were used to score RNA-seq data from primary human LUADs in TCGA (n = 506) to determine association with patient survival. (C) Significance of module-associated genes with overall survival (OS) based on a logrank test (dashed lines: logrank p = 0.01). Positive values denote decreased survival, negative values denote increased patient survival for patients with higher median module expression. For p value significance, **** represents p<0.0001, *** represents p<0.001, ** represents p<0.01, and Represents p<0.05. (D) Kaplan-Meier plots for human LUAD patients with respect to expression of module 11 (left) or module 9- (right) associated genes. Curves are shown comparing OS of high (red) versus low (blue) patient groups, determined based on the median module expression. p values determined by a logrank test. **** represents p<0.0001 and ** represents p<0.01. see also Fig. S7 and Table S6.

Comment in

References

    1. Altorki NK, Markowitz GJ, Gao D, Port JL, Saxena A, Stiles B, McGraw T, and Mittal V (2019). The lung microenvironment: an important regulator of tumour growth and metastasis. Nat. Rev. Cancer 19, 9–31. - PMC - PubMed
    1. Azizi E, Carr AJ, Plitas G, Cornish AE, Konopacki C, Prabhakaran S, Nainys J, Wu K, Kiseliovas V, Setty M, et al. (2018). Single-Cell Map of Diverse Immune Phenotypes in the Breast Tumor Microenvironment. Cell 174, 1293–1308.e36. - PMC - PubMed
    1. Bai X, Meng L, Sun H, Li Z, Zhang X, and Hua S (2017). MicroRNA-196b Inhibits Cell Growth and Metastasis of Lung Cancer Cells by Targeting Runx2. Cell. Physiol. Biochem 43, 757–767. - PubMed
    1. Bankhead P, Loughrey MB, Fernández JA, Dombrowski Y, McArt DG, Dunne PD, McQuaid S, Gray RT, Murray LJ, Coleman HG, et al. (2017). QuPath: Open source software for digital pathology image analysis. Sci. Rep 7, 16878. - PMC - PubMed
    1. Berg S, Kutra D, Kroeger T, Straehle CN, Kausler BX, Haubold C, Schiegg M, Ales J, Beier T, Rudy M, et al. (2019). ilastik: interactive machine learning for (bio)image analysis. Nat. Methods 16, 1226–1232. - PubMed

Publication types