. 2020 Jul 22;21(15):5188.
doi: 10.3390/ijms21155188.

Characterization of Fluid Biomarkers Reveals Lysosome Dysfunction and Neurodegeneration in Neuronopathic MPS II Patients

Affiliations

Characterization of Fluid Biomarkers Reveals Lysosome Dysfunction and Neurodegeneration in Neuronopathic MPS II Patients

Akhil Bhalla et al. Int J Mol Sci. .

Abstract

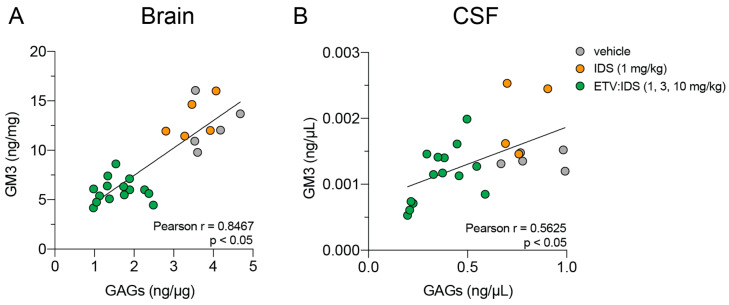
Mucopolysaccharidosis type II is a lysosomal storage disorder caused by a deficiency of iduronate-2-sulfatase (IDS) and characterized by the accumulation of the primary storage substrate, glycosaminoglycans (GAGs). Understanding central nervous system (CNS) pathophysiology in neuronopathic MPS II (nMPS II) has been hindered by the lack of CNS biomarkers. Characterization of fluid biomarkers has been largely focused on evaluating GAGs in cerebrospinal fluid (CSF) and the periphery; however, GAG levels alone do not accurately reflect the broad cellular dysfunction in the brains of MPS II patients. We utilized a preclinical mouse model of MPS II, treated with a brain penetrant form of IDS (ETV:IDS) to establish the relationship between markers of primary storage and downstream pathway biomarkers in the brain and CSF. We extended the characterization of pathway and neurodegeneration biomarkers to nMPS II patient samples. In addition to the accumulation of CSF GAGs, nMPS II patients show elevated levels of lysosomal lipids, neurofilament light chain, and other biomarkers of neuronal damage and degeneration. Furthermore, we find that these biomarkers of downstream pathology are tightly correlated with heparan sulfate. Exploration of the responsiveness of not only CSF GAGs but also pathway and disease-relevant biomarkers during drug development will be crucial for monitoring disease progression, and the development of effective therapies for nMPS II.

Keywords: ETV:IDS; GM3; Hunter syndrome; biomarkers; cerebrospinal fluid; dermatan sulfate (DS); gangliosides; glycosaminoglycans (GAGs); heparan sulfate (HS); inflammation; lysosome dysfunction; mucopolysaccharidosis type II; neurodegeneration; neurofilament light chain (Nf-L).


Conflict of interest statement

M.E. is a consultant for Takeda, REGENXBIO, and Denali Therapeutics.

Figures

Figure 1
Figure 1
Correlation between brain and CSF GAGs in Ids KO;TfRmu/huKI mice. GAG levels were evaluated in the brain and CSF of Ids KO;TfRmu/huKI mice following treatment with increasing doses of ETV:IDS. TfRmu/hu KI mice served as non-disease controls; (A) ETV:IDS is the lysosomal enzyme (E) iduronate 2-sulfatase (IDS) fused to the Transport Vehicle (TV), a TfR-binding Fc domain. Ids KO;TfRmu/huKI were treated with 4-weekly intravenous doses of vehicle, ETV:IDS or IDS alone. Brain (B) and CSF (C) were harvested 7 days following the last dose and GAGs were measured using LC-MS/MS; (D) correlation between brain and CSF GAG levels of Ids KO;TfRmu/huKI treated with ETV:IDS or IDS. Pearson r was used to determine the correlation coefficient. Graphs display mean ± SEM and p values: one-way ANOVA with Dunnett multiple-comparison test; **** p < 0.0001; n = 5 per group.
Figure 2
Figure 2
Correlation between brain and CSF gangliosides (GM3) in Ids KO;TfRmu/huKI mice. Ganglioside GM3 levels were evaluated in brain and CSF of Ids KO;TfRmu/huKI mice treated with IDS or increasing doses of ETV:IDS. TfRmu/huKI mice served as non-disease controls. Brains (A) and CSF (B) were harvested 7 days following the last dose, and ganglioside levels were measured using LC-MS/MS; (C) a scatter plot was used to show the correlation between brain and CSF ganglioside levels of Ids KO;TfRmu/huKI treated with ETV:IDS. Pearson r was used to determine the correlation coefficient. Graphs display mean ± SEM and p values: one-way ANOVA with Dunnett multiple-comparison test; **** p < 0.0001; n = 5 per group.
Figure 3
Figure 3
Positive correlation between primary storage substrate (GAGs) and accumulated lysosomal lipids (Ganglioside GM3) in brains and CSF Ids KO;TfRmu/huKI mice. GAGs and Ganglioside GM3 levels were evaluated in brains (A) and CSF (B) of Ids KO; TfRmu/huKI mice treated with increasing doses of ETV:IDS or IDS. The scatter plot was used to determine the correlation between GM3 and GAG levels in brains and CSF. Pearson r was used to determine the correlation coefficient.
Figure 4
Figure 4
Accumulation of Heparan and Dermatan sulfate derived disaccharides in CSF and serum of MPS II patients. CSF HS (A) and DS (B) levels in MPS II patients who were either untreated at the time of sample collection (n = 1), on ERT (n = 6), or on HSCT (n = 2) were compared to age-matched controls (n = 25); serum HS (C) and DS (D) levels in MPS II patients who were either untreated at the time of sample collection (n = 1), on ERT (n = 9), or on HSCT (n = 2) were compared to age-matched controls. One outlier each from serum HS and serum DS (different samples) was omitted based on the Wilcoxon sum rank test [41]. Each data point represents a single control or patient visit. Data are plotted using a min to max box plot. Differences between MPS II and non-MPS controls are estimated using a linear mixed-effects model to account for repeated measures in 2 patients. No evidence of age or treatment is seen in the MPS II sample set, and thus the model will not specifically adjust for these in the estimation; * p < 0.05.
Figure 5
Figure 5
Longitudinal HS and DS levels in CSF and serum of nMPS II patients with HSCT. CSF and serum HS and DS measured by LC-MS/MS and quantified against calibration curves generated using pure reference standards for D0A0, D0S0, and D0a4. HS (orange; sum of D0A0 and D0S0) and DS (gray; D0a4) are plotted again age to show time-dependent changes in GAGs post HSCT. For HSCT patient #1 (A,B), only post-transplant samples were available, with the earliest collection at age 1. For HSCT patient # 2 (C,D), the sample collected at age 1 is a pre-HSCT sample (closed squares). Median HS and DS values for the non-MPS control group are shown for reference. Refer to Figure 4 for individual data points for control groups.
Figure 6
Figure 6
Exploratory lipidomic analysis in CSF and serum shows an accumulation of lysosomal lipids in the CSF of nMPS II patients relative to non-MPS controls. A volcano plot of lipid species in (A) CSF and (B) serum is shown. Changes in MPS II are depicted as % of non-MPS controls. Values above 100% imply an increase, while values below 100% imply a decrease from non-MPS controls. Differences between nMPS II and non-MPS controls are estimated using a linear mixed-effects model to account for subjects with repeated measures (2 MPS II patients on HSCT). Due to the exploratory nature of the analysis, age was adjusted as a linear effect across all analytes. The treatment effect was not considered due to the small number of patients with HSCT. P values are adjusted for multiple comparisons across all measurable analytes using the Benjamin-Hochberg methodology.
Figure 7
Figure 7
Elevated lysosomal lipid levels correlate with heparan sulfate levels in CSF of nMPS II patients. Lysosomal lipids such as Gangliosides GM3(d36:1) (A–C), Glucosylceramides (d18:0/20:0) (D–F), and BMP (18:1/18:1) (G–I) are quantified in CSF and serum of nMPS II patients and non-MPS controls using LC-MS/MS; (A,B,D,E,G,H) CSF lysosomal lipid levels in nMPS II patients that were either untreated at the time of sample collection (n = 1), on enzyme replacement therapy (n = 6), or on HSCT (n = 2) were compared to age-matched controls (n = 25); (C,F,I) serum lysosomal lipid levels in nMPS II patients that were either untreated at the time of sample collection (n = 1), on ERT (n = 9), or on HSCT (n = 2) were compared to age-matched controls (n = 15). Each data point represents a single control or patient visit. Data are plotted using a min to max box plot. Differences between nMPS II and non-MPS controls are estimated using a linear mixed-effects model to account for repeated measures in 2 patients. No evidence of age or treatment is seen in the nMPS II sample set, and thus the model will not specifically adjust for these in the estimation; * p < 0.05.
Figure 8
Figure 8
Neurofilament Light Chain (Nf-L) levels are elevated in the CSF and serum of nMPS II patients. Nf-L was quantified using SIMOA detection; (A,B) CSF Nf-L levels in nMPS II patients that were either untreated at the time of sample collection (n = 1), on ERT (n = 6), or on HSCT (n = 2) were compared to age-matched controls (n = 25); (C,D) Serum HS and DS levels in nMPS II patients who were either untreated at the time of sample collection (n = 1), on ERT (n = 9), or on HSCT (n = 2) were compared to age-matched controls (n = 15). Each data point represents a single control or patient visit. Data are plotted using a min to max box plot. Differences between nMPS II and non-MPS controls are estimated using a linear mixed-effects model to account for repeated measures in 2 patients. Age was adjusted as a linear effect, and treatment effects are not considered due to the small sample set (n = 2 for HSCT), and thus the model will not specifically adjust for this in the estimation; * p < 0.05.
Figure 9
Figure 9
Neurodegeneration markers GFAP and UCH-L1 are elevated in nMPS II CSF. (A) GFAP, (B) UCLH-L1, and (C) total-Tau were quantified using SIMOA detection. nMPS II patients who were either untreated at the time of sample collection (n = 1), on enzyme replacement therapy (n = 6), or on HSCT (n = 2) were compared to age-matched controls (n = 25). Each data point represents a single control or patient visit. Data are plotted using a min to max box plot. Differences between nMPS II and non-MPS controls are estimated using a linear-mixed effects model to account for repeated measures in 2 patients. No evidence of age or treatment is seen in the MPS II sample set, and thus the model will not specifically adjust for these in the estimation; n.s.- not significant; * p < 0.05.

References

    1. Viana G.M., Priestman D.A., Platt F.M., Khan S., Tomatsu S., Pshezhetsky A.V. Brain Pathology in Mucopolysaccharidoses (MPS) Patients with Neurological Forms. J. Clin. Med. 2020;9:396. doi: 10.3390/jcm9020396. - DOI - PMC - PubMed
    1. Martin R., Beck M., Eng C., Giugliani R., Harmatz P., Muñoz V., Muenzer J. Recognition and diagnosis of mucopolysaccharidosis II (Hunter syndrome) Pediatrics. 2008;121:e377–e386. doi: 10.1542/peds.2007-1350. - DOI - PubMed
    1. D’Avanzo F., Rigon L., Zanetti A., Tomanin R. Mucopolysaccharidosis Type II: One Hundred Years of Research, Diagnosis, and Treatment. Int. J. Mol. Sci. 2020;21 doi: 10.3390/ijms21041258. - DOI - PMC - PubMed
    1. Lampe C., Atherton A., Burton B.K., Descartes M., Giugliani R., Horovitz D.D., Kyosen S.O., Magalhães T.S., Martins A.M., Mendelsohn N.J., et al. Enzyme Replacement Therapy in Mucopolysaccharidosis II Patients Under 1 Year of Age. JIMD Rep. 2014;14:99–113. doi: 10.1007/8904_2013_289. - DOI - PMC - PubMed
    1. Hendriksz C.J., Muenzer J., Vanderver A., Davis J.M., Burton B.K., Mendelsohn N.J., Wang N., Pan L., Pano A., Barbier A.J. Levels of glycosaminoglycans in the cerebrospinal fluid of healthy young adults, surrogate-normal children, and Hunter syndrome patients with and without cognitive impairment. Mol. Genet. Metab. Rep. 2015;5:103–106. doi: 10.1016/j.ymgmr.2015.11.001. - DOI - PMC - PubMed

MeSH terms