. 2020 Jul 22;9(8):1755.
doi: 10.3390/cells9081755.

Fibroblast Growth Factor-14 Acts as Tumor Suppressor in Lung Adenocarcinomas

Affiliations

Fibroblast Growth Factor-14 Acts as Tumor Suppressor in Lung Adenocarcinomas

Kati Turkowski et al. Cells. .

Abstract

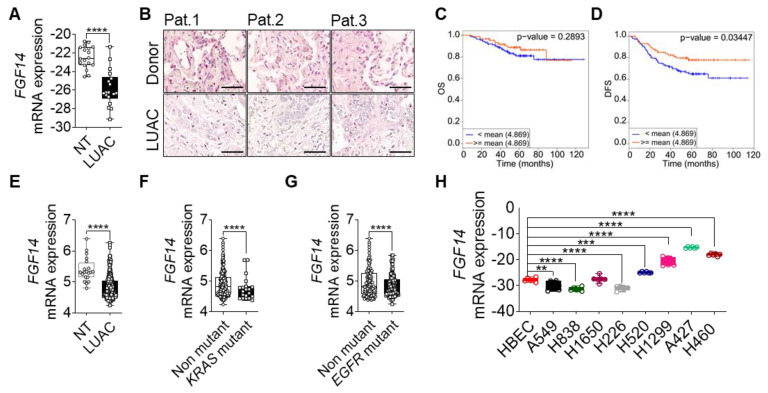
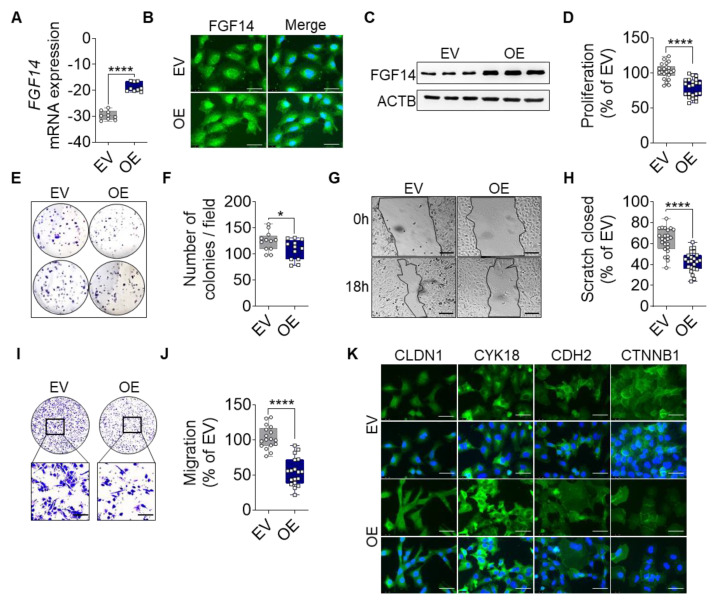
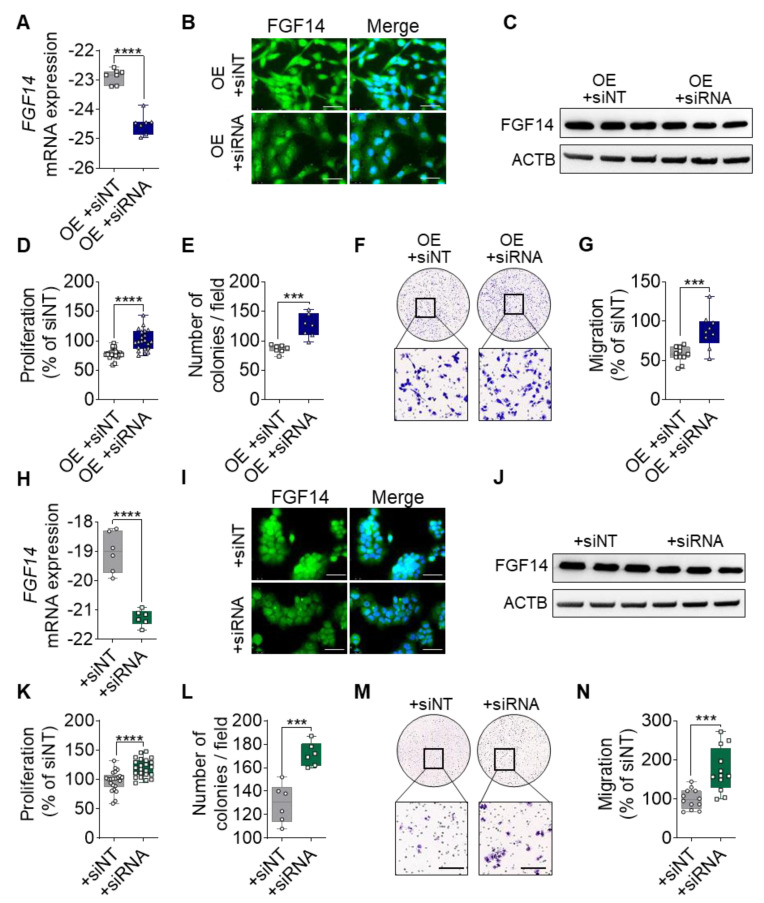
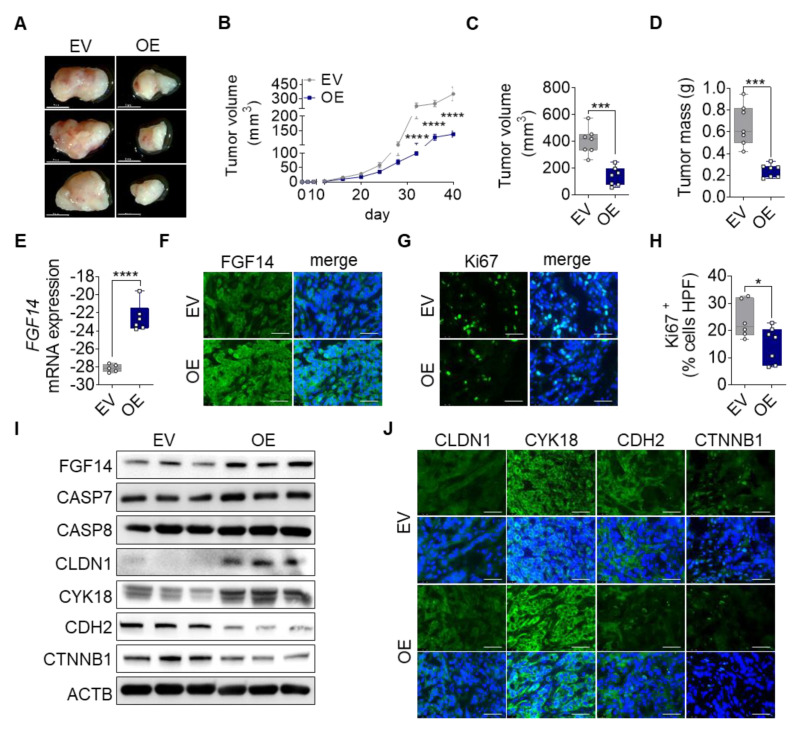
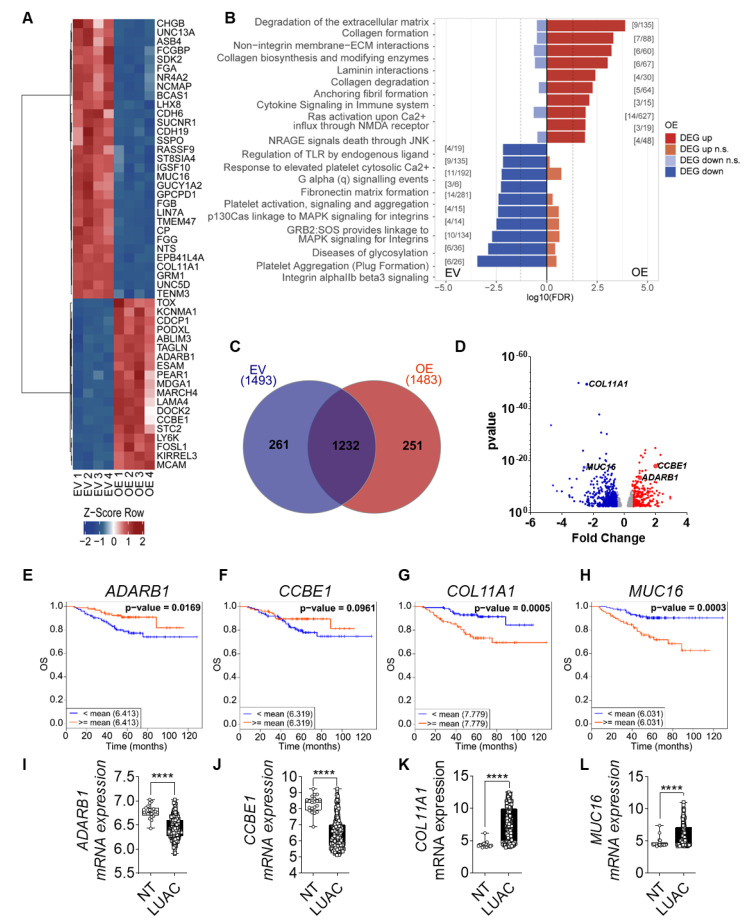
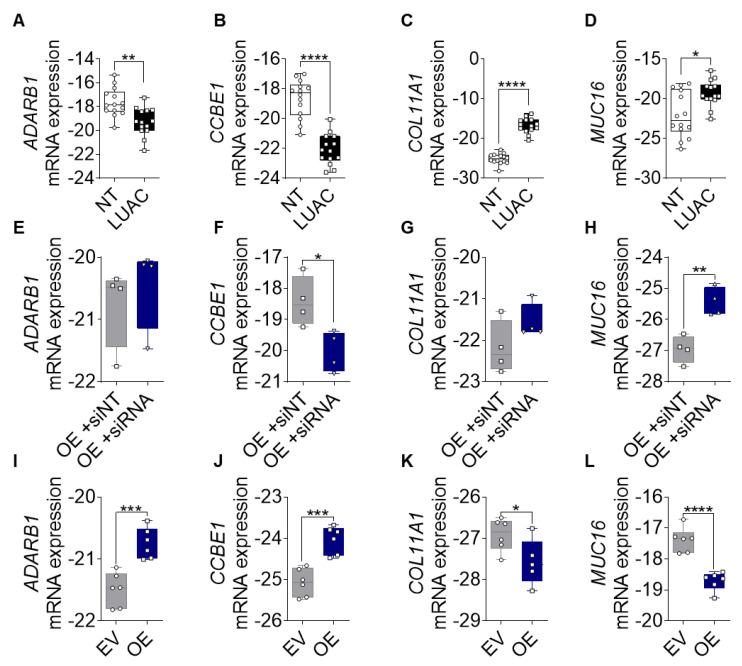
Investigation of the molecular dynamics in lung cancer is crucial for the development of new treatment strategies. Fibroblast growth factor (FGF) 14 belongs to the FGF family, which might play a crucial role in cancer progression. We analyzed lung adenocarcinoma (LUAC) patients samples and found that FGF14 was downregulated, correlating with reduced survival and oncogenic mutation status. FGF14 overexpression in lung cancer cell lines resulted in decreased proliferation, colony formation, and migration, as well as increased expression of epithelial markers and a decreased expression of mesenchymal markers, indicating a mesenchymal to epithelial transition in vitro. We verified these findings using small interfering RNA against FGF14 and further confirmed the suppressive effect of FGF14 in a NOD.Cg-Prkdcscid Il2rgtm1Wjl/SzJ immunodeficient xenograft tumor model. Moreover, FGF14 overexpressing tumor cell RNA sequencing data suggests that genes affected by FGF14 were related to the extracellular matrix, playing a role in proliferation and migration. Notably, newly identified FGF14 target genes, adenosine deaminase RNA specific B1 (ADARB1), collagen and calcium-binding epidermal growth factor domain-containing protein 1 (CCBE1), α1 chain of collagen XI (COL11A1), and mucin 16 (MUC16) expression was negatively correlated with overall survival when FGF14 was downregulated in LUAC. These findings led us to suggest that FGF14 regulates proliferation and migration in LUAC.

Keywords: fibroblast growth factor 14; lung adenocarcinoma; lung cancer mesenchymal epithelial transition; xenograft model.


Conflict of interest statement

The authors declare no conflict of interest.

Figures

Figure 1
Figure 1
Clinical outcome associated with FGF14 expression in lung adenocarcinoma (LUAC). (A) mRNA expression analysis of FGF14 in LUAC patients samples (n = 18) compared to non-tumor tissue (NT). (B) Immunohistochemical staining of FGF14 in LUAC and healthy donor tissue samples (n = 3). Scale bar 50 µm. Kaplan–Meier estimate of (C) overall survival (OS) and (D) disease free survival (DFS) among Okayama patients dataset with LUAC that was classified according to the levels of FGF14 mRNA as either high (above the mean value of FGF14 mRNA levels; red) and low (below the mean value of FGF14 mRNA levels; blue). (E) mRNA expression level of FGF14 in LUAC samples from the same study compared with non-tumor tissue. (F) Analysis of FGF14 expression in KRAS mutant vs KRAS non-mutant patients samples and (G) EGFR mutant vs EGFR non-mutant samples. (H) mRNA expression of FGF14 in different lung cancer cell lines e.g., LUAC (A549, H1299, H838, and H1650), LUSC (H226. and H520), lung carcinoma (A427) and large cell lung cancer (H460) compared with primary human bronchial epithelial cells (HBEC). Data obtained from CANCERTOOL (CG). Data shown as mean+/- standard error of the mean using Student’s t-test. P-values ≤ 0.05 were considered statistically significant for all analyses. ** p ≤ 0.01, *** p ≤ 0.001 and **** p ≤ 0.0001.
Figure 2
Figure 2
FGF14 overexpression reveals a tumor-suppressive phenotype in vitro. Validation of FGF14 overexpression after transfection of A549 cells with empty vector (EV) and FGF14 expression vector (OE) was quantified by (A) qRT-PCR, (B) immunocytochemistry (ICC) staining and (C) Western blot. Cells in B panel were labeled using FGF14 antibody and revealed by an AlexaFlour 488 secondary antibody (green). DNA was stained with 4′,6-diamidino-2-phenylindole (blue), scale bars, 50 µm. (D) Cellular proliferation was quantified by BrdU incorporation of FGF14 OE cells compared to EV control cells. (E,F) Colony formation of FGF14 OE cells compared with EV control cells. The migratory ability of FGF14 OE cells was assessed via (G,H) scratch assay and (I,J) Boyden chamber assay. Representative pictures were taken at 0 and 18 h after scratching; scale bars, 100 µm. (K) ICC staining of epithelial (CLDN1, CYK18) and mesenchymal marker (CDH2, CTNNB1) labeled using an AlexaFlour 488 secondary antibody (green). DNA was stained with 4′,6-diamidino-2-phenylindole (blue), scale bars, 50 µm. Data are shown as mean ± standard error of the mean using Student’s t-test. P-values ≤ 0.05 were considered statistically significant for all analyses. (n = 3) * p ≤ 0.05 and **** p ≤ 0.0001.
Figure 3
Figure 3
Silencing of FGF14 abrogate the suppressive phenotype in FGF14 overexpressing A549 cells. (A) mRNA expression of FGF14 after siRNA transfection with FGF14 siRNA and non-targeting siRNA control (siNT). (B) ICC images of FGF14 after treatment with FGF14 siRNA compared with non-targeting control. Cells were labeled by using antibody against FGF14 and detected using AlexaFlour488 secondary antibody (green). Nuclear DNA was counterstained with DAPI (blue), scale bars, 50 µm. (C) Western blotting of FGF14 OE cells after treatment with FGF14 siRNA. (D) Cellular proliferation by BrdU incorporation, (E) colony formation and (F,G) Boyden chamber migration was performed after treatment of FGF14 OE cells with siNT compared to FGF14 siRNA. (H) mRNA expression level of FGF14 in H460 cells after siRNA treatment. (I) Representative pictures of FGF14 ICC staining of siRNA and non-targeting siRNA treated H460 cells. (J) Western blotting of H460 cells after siRNA transfection. In vitro assays including (K) proliferation, (L) colony formation and (M,N) migration to determine functional changes upon FGF14 silencing. Data are shown as mean ± standard error of the mean using Student’s t-test (n = 3). P-values ≤0.05 were considered statistically significant for all analyses. *** p ≤ 0.001 and **** p ≤ 0.0001.
Figure 4
Figure 4
Impact of FGF14 overexpression on cancer progression in vivo. A549-EV and A549-FGF14 OE cells were injected in the right flank of immunodeficient mice. Tumors were harvested after 40 days. (A) Representative photographs of dissected FGF14 overexpressing tumors. (B) Measurement of tumor volume during tumor progression. Quantification of (C) tumor volume and (D) tumor mass after tumor dissection. Revalidation of FGF14 expression in mice tumor samples via (E) qPCR and (F) immunohistochemistry staining. (G) Ki67 staining of proliferating cells within the tumor were (H) counted per high power field using ImageJ (Fiji) Software. Representative pictures of FGF14 and Ki67 staining visualized using Alexa Flour 488 coupled secondary antibody (green). (I) Validation of FGF14 overexpression, apoptosis using antibodies against CASP7 and CASP8 and epithelial marker expressions using antibodies against CLDN1 and CYK18 and mesenchymal marker expressions evaluated by antibodies against CDH2 and CTNNB1. (J) Additional immunohistochemistry staining of epithelial and mesenchymal marker. Representative pictures of epithelial markers (CDH1 and CYK18) and mesenchymal markers (CDH2 and CTNNB1) visualized using Alexa Flour 488 coupled secondary antibody (green). Nuclear DNA was counterstained with DAPI (blue), scale bar 50 µm. Data shown as mean ± standard error of the mean using one-way analysis of variance (n = 7). P-values ≤ 0.05 were considered statistically significant for all analyses. * p ≤ 0.05, *** p ≤ 0.001, and **** p ≤ 0.0001.
Figure 5
Figure 5
FGF14 overexpression impacts gene expression profile of tumor cells. (A) Heatmap of top 50 most significant differentially expressed genes (DEGs) for each contrast (sorted by smallest adjusted p-value). (B) The DEGs, split into up and downregulated genes, a gene set enrichment analysis was performed using KEGG Orthology-Based Annotation System (KOBAS). The graph represents the top 10 gene sets or pathways enriched for up- or downregulated genes of one database (dashed line: p-value = 0.05). The graph only shows pathways that were not significant for both directions (up and down). Significant gene set enrichment was defined by the false discovery rate (FDR). (C) Venn diagram of DEGs using InteractiVenn [36]. (D) Volcano plot: bottom track = p-value based definition of a DEG (less stringent, only for comparison). (EH) Kaplan–Meier estimate of OS among the Okayama patients dataset with LUAC classified according to the mRNA expression levels of CCBE1, ADARB1, COL11A1, and MUC16 as either high (above the mean value of mRNA levels, red) and low (below the mean value of mRNA levels, blue). (IL) mRNA expression level of in LUAC samples from the same study compared with non-tumor tissue. Data was obtained from CANCERTOOL. Data are presented as mean ± standard error of the mean using Student’s t-test. p-values ≤ 0.05 were considered statistically significant for all analyses **** p ≤ 0.0001.
Figure 6
Figure 6
Validation of FGF14 target genes. (AD) mRNA expression of ADARB1, CCBE1, COL11A1, and MUC16 in human LUAC tissue compared with samples from non-tumor tissue (n = 14). (EH) mRNA expression silencing of FGF14 in A549-FGF14 OE cells and non-targeting siRNA control samples (n = 4). (IL) mRNA expression of FGF14 target genes in FGF14 OE and FGF14 EV tumor tissues from immunodeficient xenograft model (n = 6). Data are presented as mean ± standard error of the mean using Student’s t-test. P-values ≤ 0.05 were considered statistically significant for all analyses. * p ≤ 0.05, ** p ≤ 0.01, *** p ≤ 0.001, and **** p ≤ 0.0001.

References

    1. Barta J.A., Powell C.A., Wisnivesky J.P. Global epidemiology of lung cancer. Ann. Glob. Heal. 2019;85:1–16. doi: 10.5334/aogh.2419. - DOI - PMC - PubMed
    1. Robert Koch-Institut; Gesellschaft der epidemiologischen Krebsregister in Deutschland e.V., editor. Krebs in Deutschland für 2015/2016 Krebs in Deutschland. Robert Koch-Institut; Gesellschaft der epidemiologischen Krebsregister in Deutschland e.V.; Berlin, Germany: 2017. 11. Ausgab.
    1. Travis W.D. Pathology of Lung Cancer. Clin. Chest Med. 2011;32:669–692. doi: 10.1016/j.ccm.2011.08.005. - DOI - PubMed
    1. Herbst R.S., Morgensztern D., Boshoff C. The biology and management of non-small cell lung cancer. Nature. 2018;553:446–454. doi: 10.1038/nature25183. - DOI - PubMed
    1. Aisner D., Sholl L.M., Berry L.D., Haura E.B., Ramalingam S.S., Glisson B.S., Socinski M.A., Waqar S.N., Garon E.B., Cetnar J.P., et al. Effect of expanded genomic testing in lung adenocarcinoma (LUCA) on survival benefit: The Lung Cancer Mutation Consortium II (LCMC II) experience. J. Clin. Oncol. 2016;34:11510. doi: 10.1200/JCO.2016.34.15_suppl.11510. - DOI

Publication types

MeSH terms

Substances