. 2020 Jul 21;10(7):297.
doi: 10.3390/metabo10070297.

hcapca: Automated Hierarchical Clustering and Principal Component Analysis of Large Metabolomic Datasets in R

Affiliations

hcapca: Automated Hierarchical Clustering and Principal Component Analysis of Large Metabolomic Datasets in R

Shaurya Chanana et al. Metabolites. .

Abstract

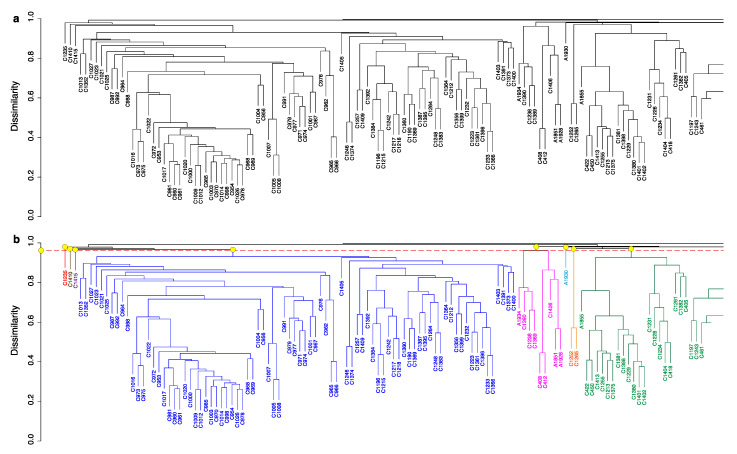
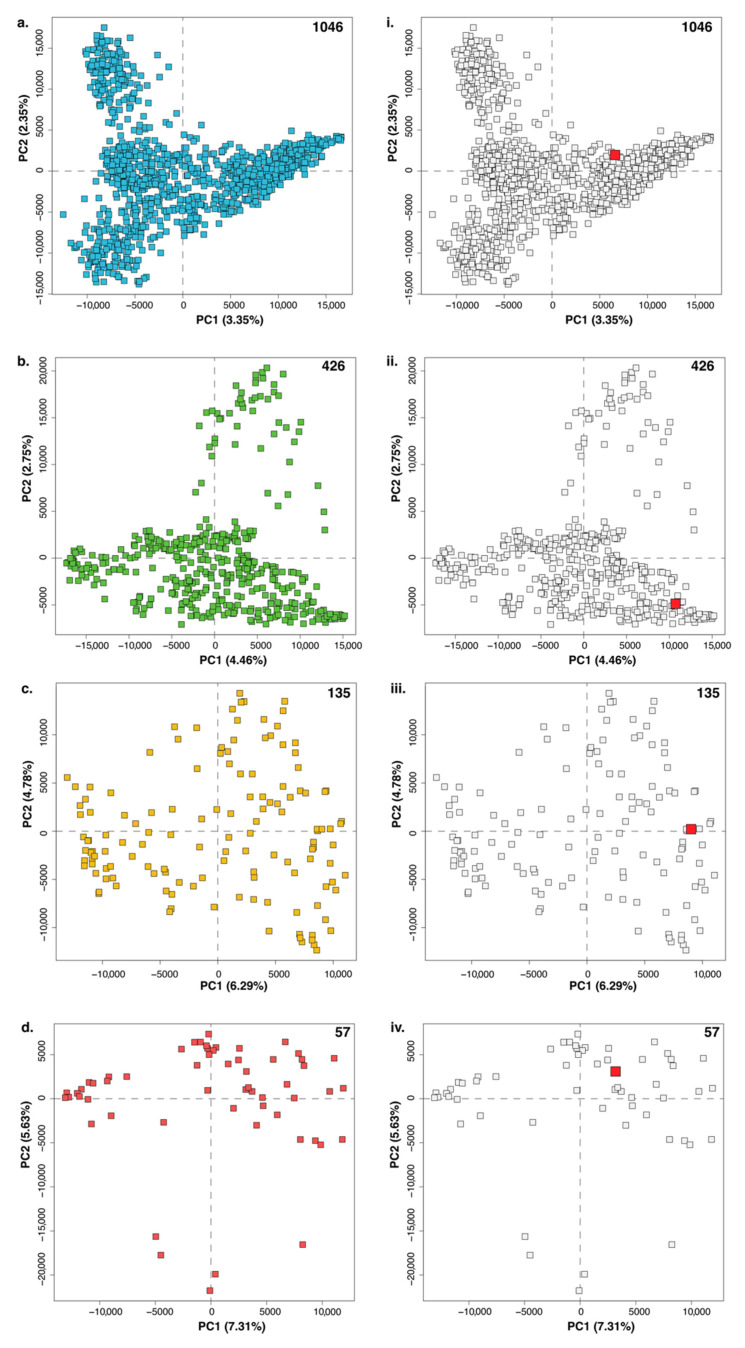
Microbial natural product discovery programs face two main challenges today: rapidly prioritizing strains for discovering new molecules and avoiding the rediscovery of already known molecules. Typically, these problems have been tackled using biological assays to identify promising strains and techniques that model variance in a dataset such as PCA to highlight novel chemistry. While these tools have shown successful outcomes in the past, datasets are becoming much larger and require a new approach. Since PCA models are dependent on the members of the group being modeled, large datasets with many members make it difficult to accurately model the variance in the data. Our tool, hcapca, first groups strains based on the similarity of their chemical composition, and then applies PCA to the smaller sub-groups yielding more robust PCA models. This allows for scalable chemical comparisons among hundreds of strains with thousands of molecular features. As a proof of concept, we applied our open-source tool to a dataset with 1046 LCMS profiles of marine invertebrate associated bacteria and discovered three new analogs of an established anticancer agent from one promising strain.

Keywords: HCA; LCMS; PCA; dendrogram; genomics; metabolites; open source; variance.


Conflict of interest statement

The authors declare no conflict of interest.

Figures

Figure 1
Figure 1
Subplots (ad) show the PCA scores plot for four datasets. The number of samples in each dataset is shown in the top right corner of each plot. The total variance explained by a principal component (PC) is shown in parentheses next to the axis labels on each subplot. As the number of samples in a PCA decreases, the variance explained by each PC increases due to a combination of fewer samples and lesser overall variance in the dataset.
Figure 2
Figure 2
(a) Partial dendrogram generated from an HCA of all 1046 samples. The scale on the left denotes dissimilarity i.e., the closer to the bottom a pair of samples are, the more similar they are to each other. Only a small subset of the figure is shown for clarity; the original complete dendrogram may be found in the Supplementary Information as Figures S1 (linear display) and S3 (circular display). (b) Arbitrary dissimilarity cutoff choice of 0.95 results in eight different groups being formed. The groups have been colored accordingly. The eight groups have been colored as red, brown, grey, blue, magenta, teal, orange, and green. The yellow dots indicate the point at which the tree branch diverges to form each respective colored group of samples.
Figure 3
Figure 3
Scheme depicting hcapca logic. Note also that a small (35 sample) example of the walk through of hcapca processing and interactive visualization is depicted in Supplementary Information Figures S4–S13. (a) The first tree is partitioned into two smaller sub-clusters. (b) Since the SoV12 for the two sub-clusters does not meet the cutoff value (25%), they are further split into smaller groups (c). The SoV12 of the red and green clusters is more than the cutoff value and so their partitioning stops and PCA models are made (red/green squares). The green and blue sub-clusters have SoV12s lower than the cutoff so they are split further as indicated by the ellipsis. (d) The overall structure of this schema results in a “tree-of-trees”. The circles represent the various nodes being formed and are colored as per the trees (from a, b, and c) that they represent. Dashed borders indicate nodes that need to be partitioned further while solid lines denote nodes that can no longer be split.
Figure 4
Figure 4
A1901 was identified from the PCA of node ‘fj’ shown in Figure S2. (a) The dendrogram of the node ‘fj’ contains eight strains in total. (b) PCA scores and loadings plots of the node containing A1901 with red squares highlighting the strain and its corresponding metabolites respectively are also shown. (c) Structures of the new lomaiviticin congeners.
Figure 5
Figure 5
(ad) represent the PCA models for the nodes mw, yq, ss, and bm from Figure S2, respectively. Sub-plots (iiv) correspond to (ad), respectively, highlighting the position of A1901 using a red dot while de-emphasizing other points in the plot by making them grey. Without the utilization of hcapca, the discovery of the new anticancer compounds would not have been possible.

References

    1. Newman D.J., Cragg G.M. Natural products as sources of new drugs over the nearly four decades from 01/1981 to 09/2019. J. Nat. Prod. 2020;83:770–803. doi: 10.1021/acs.jnatprod.9b01285. - DOI - PubMed
    1. Jensen P.R., Moore B.S., Fenical W. The marine actinomycete genus Salinispora: A model organism for secondary metabolite discovery. Nat. Prod. Rep. 2015;32:738–751. doi: 10.1039/C4NP00167B. - DOI - PMC - PubMed
    1. Shen B. A new golden age of natural products drug discovery. Cell. 2015;163:1297–1300. doi: 10.1016/j.cell.2015.11.031. - DOI - PMC - PubMed
    1. Harvey A.L., Edrada-Ebel R., Quinn R.J. The re-emergence of natural products for drug discovery in the genomics era. Nat. Rev. Drug Discov. 2015;14:111–129. doi: 10.1038/nrd4510. - DOI - PubMed
    1. Koehn F.E. High impact technologies for natural products screening. Nat. Compd. Drugs Vol. I. 2008;65:175–210. doi: 10.1007/978-3-7643-8117-2_5. - DOI - PubMed