Review
. 2020 Jul 21;9(7):180.
doi: 10.3390/biology9070180.

Circadian Photoentrainment in Mice and Humans

Affiliations
Review

Circadian Photoentrainment in Mice and Humans

Russell G Foster et al. Biology (Basel). .

Abstract

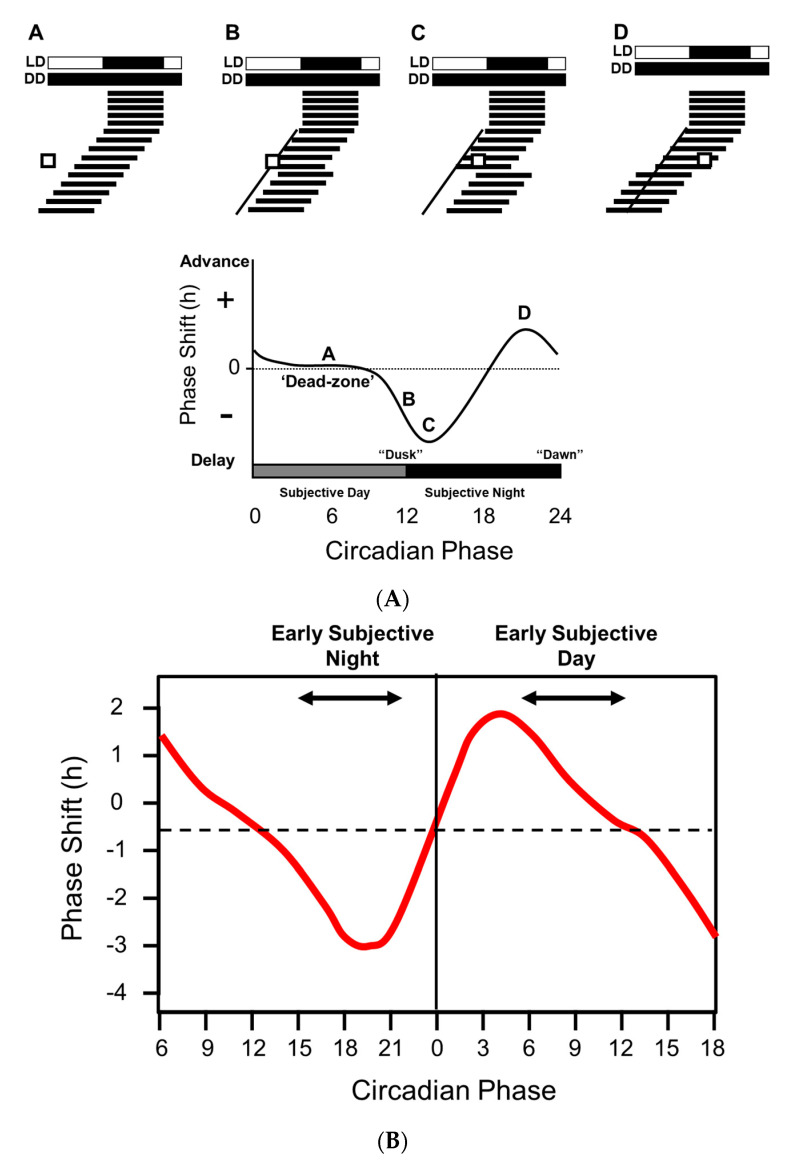
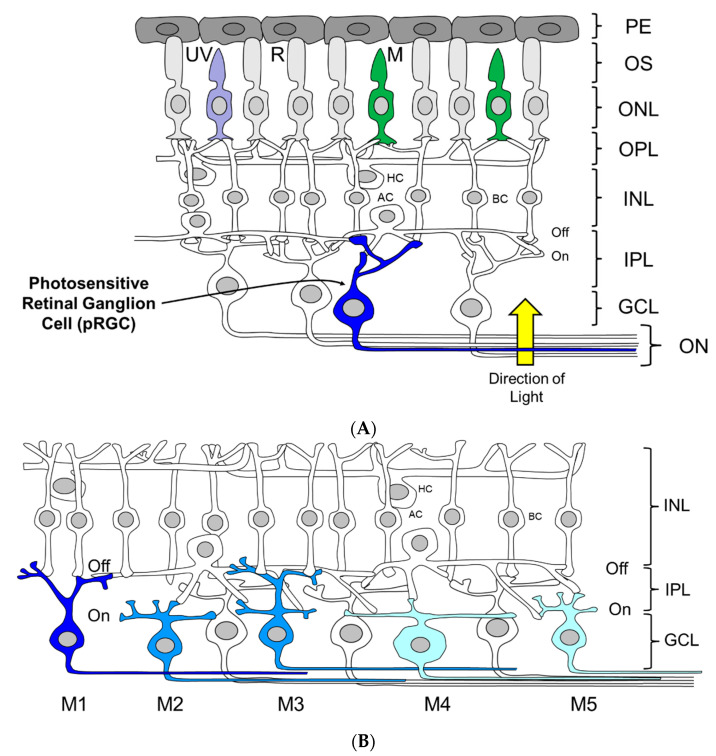
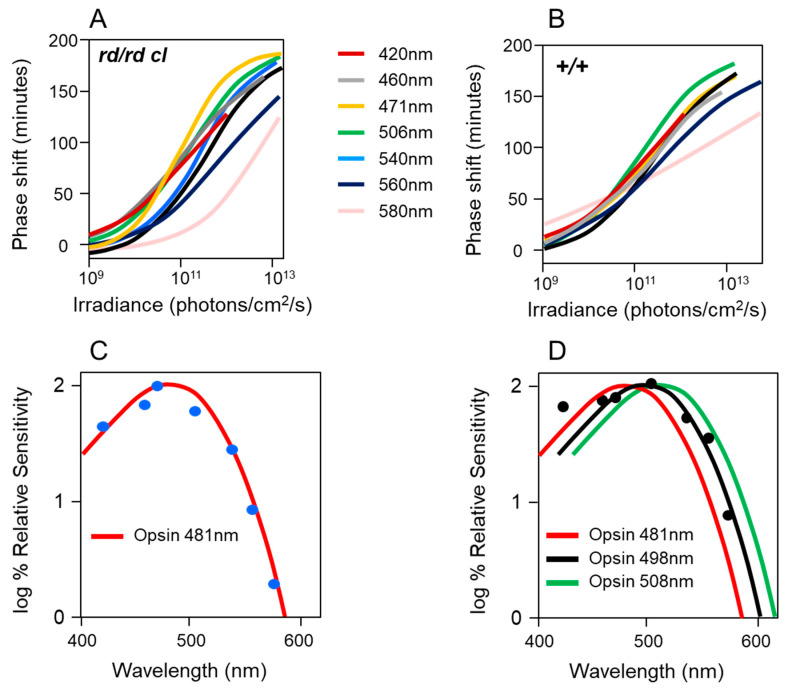
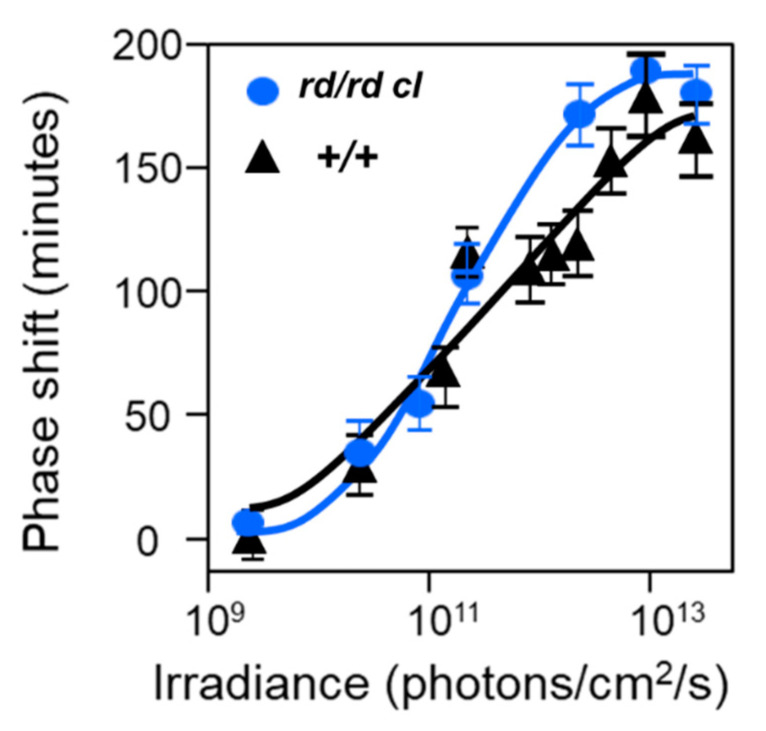
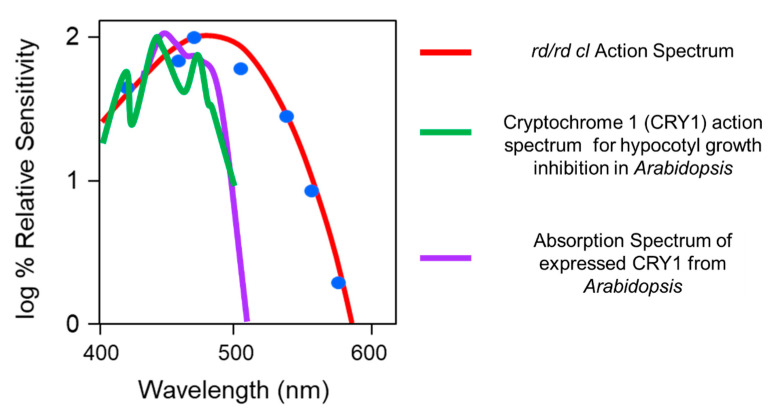
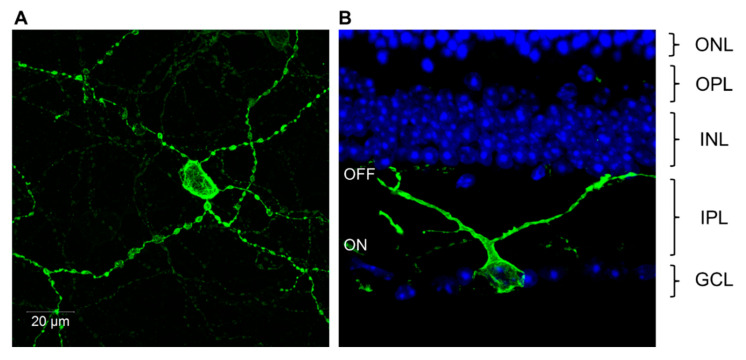
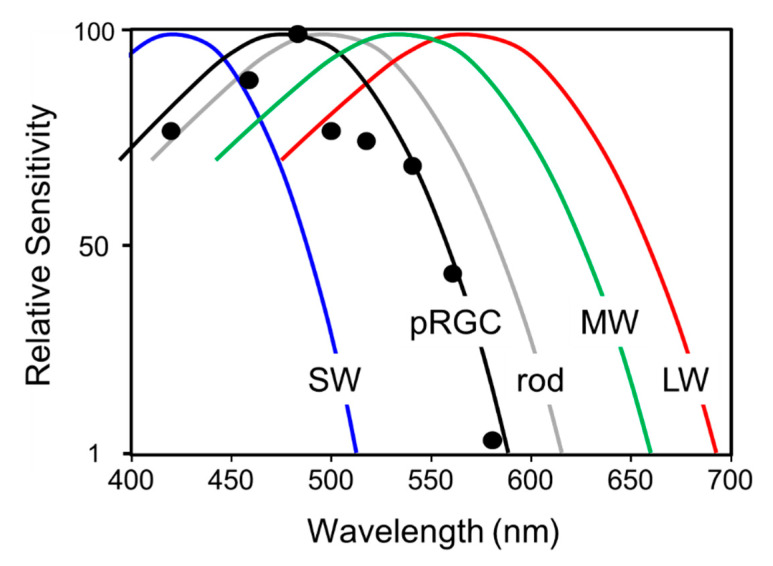
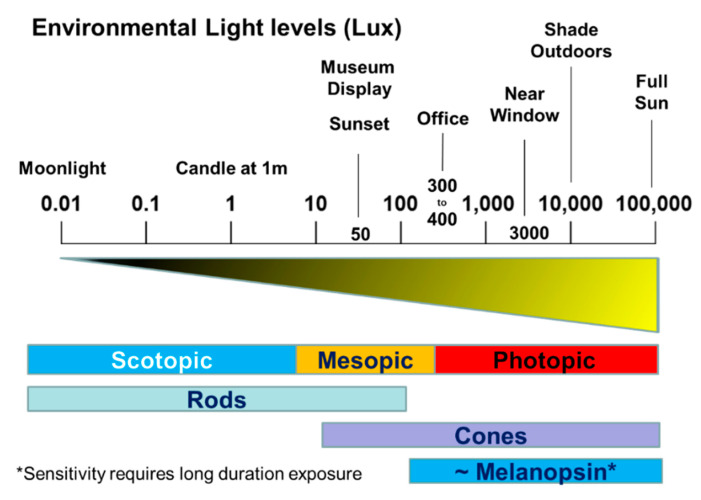
Light around twilight provides the primary entrainment signal for circadian rhythms. Here we review the mechanisms and responses of the mouse and human circadian systems to light. Both utilize a network of photosensitive retinal ganglion cells (pRGCs) expressing the photopigment melanopsin (OPN4). In both species action spectra and functional expression of OPN4 in vitro show that melanopsin has a λmax close to 480 nm. Anatomical findings demonstrate that there are multiple pRGC sub-types, with some evidence in mice, but little in humans, regarding their roles in regulating physiology and behavior. Studies in mice, non-human primates and humans, show that rods and cones project to and can modulate the light responses of pRGCs. Such an integration of signals enables the rods to detect dim light, the cones to detect higher light intensities and the integration of intermittent light exposure, whilst melanopsin measures bright light over extended periods of time. Although photoreceptor mechanisms are similar, sensitivity thresholds differ markedly between mice and humans. Mice can entrain to light at approximately 1 lux for a few minutes, whilst humans require light at high irradiance (>100's lux) and of a long duration (>30 min). The basis for this difference remains unclear. As our retinal light exposure is highly dynamic, and because photoreceptor interactions are complex and difficult to model, attempts to develop evidence-based lighting to enhance human circadian entrainment are very challenging. A way forward will be to define human circadian responses to artificial and natural light in the "real world" where light intensity, duration, spectral quality, time of day, light history and age can each be assessed.

Keywords: circadian; entrainment; human; melanopsin (OPN4); mouse; photoreceptor.


Conflict of interest statement

The authors declare no conflicts of interest.

Figures

Figure 1
Figure 1
(A): phase response curve (PRC) for a nocturnal animal such as a mouse. In the upper part of this figure (A–D) the light/dark cycle is shown and the dark line illustrates the duration of activity (also called “alpha”) on subsequent days. For the first four days the animal is kept under a light/dark cycle of 12 h of light and 12 h of dark (L:D 12:12). On day 5, the lights were switched off and the animal was kept under constant darkness (DD), and it freeran with a period slightly shorter than 24 h. To provide reference points under freerunning conditions, activity onset in a nocturnal animal is termed “circadian time 12” or CT 12. The CT 0–12 is considered as the “subjective day,” and CT 12–24 is considered “subjective night.” If the animal is exposed to a single one-hour pulse of light during its subjective circadian day, as shown in (A), there is usually no or little phase shifting effect on the freerunning rhythm. This is called the “dead zone.” At (B) the light pulse is given early in the subjective night, the effect is to start activity slightly later the next day (a delaying phase shift). In (C) the light exposure is later into the night and there is an increased delaying effect the following day. When light is given during the second half of the night (D), the effect is to advance the freerunning rhythm. If the phase shifts (A–D) are plotted against the circadian time the result produces a phase response curve (PRC). (B): One version of the human phase response curve (PRC) derived from human subjects [4]. In this figure, phase advances (positive values) and delays (negative values) have been plotted against the timing of light exposure relative to the measured phase of melatonin, which, in humans, is frequently used as a routine measure of circadian phase. The light “pulse” consisted of 6.7 h bright light exposure alternating between 6 min fixed gaze (approximately 10,000 lux) and free gaze (approximately 5000–9000 lux) exposures. Redrawn from Khalsa et.al. 2003. See text for details.
Figure 2
Figure 2
(A): Diagram of the Mouse Retina. The rods and cones have differing spectral maxima (λmax): rod photoreceptors (R) colored grey, λmax ~ 498 nm; green cones (M) colored green, λmax ~ 508 nm; ultraviolet sensitive cones (UVS) colored purple, λmax ~ 360 nm. These photoreceptors convey visual information to the retinal ganglion cells via the second order neurons of the inner retina (INL), and the bipolar (BC), horizontal (HC) and amacrine (AC) cells. The optic nerve is formed from the axons of all the ganglion cells and this large nerve takes light information into the brain. A subset of photosensitive retinal ganglion cells (pRGC—shown in blue) detects light directly by using the “blue” light sensitive photopigment called melanopsin or OPN4. Thus, photodetection in the retina occurs in three types of cell: the rods, cones and pRGCs. The eye itself has an independent clock, which changes the sensitivity or the rods and cones to light, and to complicate matters still further, the pRGCs also receive signals from the rods and cones, via inner retinal neurons, and can help drive light responses by the pRGCs. Counter-intuitively, light passes to the rods, cones and pRGCs by passing through the inner to the outer retina. (B): A least five, and possibly six, subtypes of melanopsin-expressing pRGCs have been identified to date. Images showing the pRGC subtypes (1–5) identified in the mouse retina are based upon their intensity of labeling with melanopsin antibodies (indicated as dark to light blue) and their anatomy; specifically, their dendritic projections to the “ON” and “OFF” layers of the sublaminae of the inner plexiform layers (IPL). Most recently, a potential M6 cell has been identified which has a small bistratisfied dendritic field with spiny, highly branched dendrites (similar to M5 cells). Like other non-M1 pRGCs (including M4 cells), M6 cells project to the dorsal lateral geniculate nucleus, suggesting they contribute to pattern vision [16]. Abbreviations: inner nuclear layer (INL) which comprises multiple types of horizontal cells (H), bipolar cells (BC) and amacrine cells (AC); ganglion cell layer (GCL); optic nerve (ON); outer nuclear layer (ONL); outer plexiform layer (OPL); outer segments (OS); pigmented epithelium (PE); Off and On denote the ON and OFF sublaminae of the IPL.
Figure 3
Figure 3
Action spectra for circadian entrainment. Action spectra were derived using the magnitude of the phase shift in a freerunning locomotor activity rhythm by a 15 min light stimulus. Wheel running activity rhythms of singly housed male C3H/He rd/rd cl and wildtype mice aged between 80 and 250 days were monitored. Animals were entrained to a L:D 12:12 cycle for seven days then placed under constant darkness. After 7 to 10 days of constant darkness, a single monochromatic (half band width = 10nm), 15 min light pulse of defined irradiance was applied four hours after activity onset (Circadian Time 16) to generate maximum phase delays. Animals were returned to constant darkness for a further 10 days. The magnitude of the phase shift was calculated by comparing the time of activity onset before and after the light pulse. Pre-pulse phase was calculated from the seven days prior to the light pulse application, and the post-pulse stable freerunning activity was calculated from the seven days after the light pulse, taken from the second day after the light pulse. Monochromatic and neutral density filters were used to regulate the wavelength and intensity of the stimulus allowing irradiance response curves to be compiled at 420, 460, 471, 506, 540, 560 and 580 nm. Irradiance response curves (IRCs) were compiled at seven wavelengths of near-monochromatic light (n = 4 to 7 animals for each data point) between 420 and 580 nm in: (A) the rd/rd cl and (B) wildtype mice. (C) The derived action spectrum for circadian entrainment in rd/rd cl is well approximated an opsin-retinal photopigment with a novel λmax at 481 nm (R-squared = 0.976). (D) The wildtype action spectrum is also well approximated by an opsin-vitamin A photopigment (R-squared = 0.896), but with a λmax of ~500 nm. This is consistent with the involvement of a rod (498 nm) and/or cone (508 nm) absorption spectra.
Figure 4
Figure 4
A comparison of rd/rd cl and wildtype responses at 471 nm (15 min exposure) The data show a similar irradiance range of responses in the two genotypes, from ~1 × 10⁹ photons cm2 s−1 to a saturating response at ~1 × 10¹⁴ photons cm2 s−1. This dynamic range corresponds to both the rod and cone activation ranges. A significant difference is identified in the slopes of the response relationship of the irradiance response curves (p < 0.002), and photobiology formalisms suggest that this represents responses driven by different photoreceptors in the two genotypes.
Figure 5
Figure 5
Comparison of flavin-photopigment-based and opsin/vitamin A-based spectral responses. The well-defined action spectra for flavin-photopigment-based responses correspond closely to each other but not to the action spectrum for circadian phase shifts in rd/rd cl mice. See text for details.
Figure 6
Figure 6
Visualization of melanopsin expressing photosensitive retinal ganglion cells (pRGCs) of the adult mouse retina. (A) Confocal microscopy image of a flat mounted mouse retina showing antibody labeling of melanopsin in an M1 type pRGC with high levels of melanopsin expression and large but sparse dendritic fields. Additionally, note the presence of a weaker stained processes from neighboring non-M1 cells. (B) Cross section image of the mouse retina showing the dendrites of M1 type pRGCs extending to the OFF layers of the inner plexiform layers (IPL). Abbreviations: Outer nuclear layer (ONL); inner nuclear layer (INL); inner plexiform layer (IPL); ON and OFF mark the ON and OFF sublaminae of the IPL; ganglion cell layer (GCL).
Figure 7
Figure 7
Data showing that the progressive loss of 24 h rhythmicity in a subject with a grade IV glioblastoma that infiltrated the anterior hypothalamus. Case study: Patient identifier (JJB), male, 67 years of age diagnosed with grade IV glioblastoma with progressive infiltration into the anterior hypothalamus. The Figure shows rest/activity recordings measured in the home environment using actigraphy and plotted on a 48 h time base from 25th February 2010 to the 1st July 2010, and the death of JJB. Actigraphy profiles are shown across eleven periods of analysis (times indicated on left of the actigraphy profile). Periodogram analysis of the activity profiles indicated diurnal rest/activity profiles close to a period of 24 h until 26th March 2010 (five periods); beyond this time the subject showed increasingly non-24 h (arrhythmic) behavior, as defined by periodogram analysis. Post-mortem analysis of the brain of JJB showed significant tumor (glioma) infiltration of the suprachiasmatic nuclei (SCN) and compression of this area of the brain due to basal brain swelling. The single peak of activity between ~10.00 and 12.00 seen in periods 10 and 11 corresponds to the daily visits to the home by a nurse. Unpublished data collected by Emma Cussans, Katharina Wulff, Olaf Ansorge and Russell Foster. Sincerest thanks are expressed to the family of JJB for their help and participation in the collection of these data during a very difficult time.
Figure 8
Figure 8
An action spectrum for pupillary constriction in a woman lacking functional rods and cones. Irradiance-response curves (IRCs) were generated at eight wavelengths for both eyes to define the action spectrum. The resulting action spectrum of pupil responses provided a poor fit to rod and cone photopigments (rod R2 = 0.35; short wave-sensitive (SWS) cone, mid wave-sensitive (MWS) cone, long wave-sensitive (LWS) cone R2 = 0). An optimum fit to the pupil response to light was provided by an opsin/vitamin A-based template with λmax 476 nm (R2 = 0.89), corresponding closely to the pRGC system. The data shown were not corrected for pre-retinal lens absorption. When this correction was applied, the λmax shifted from 476 nm to 480 nm [93].
Figure 9
Figure 9
The human retina functions over a very wide range of light intensities. Scotopic vision is light detection by the rod photoreceptors of the eye under low light conditions. In the human eye cone photoreceptors are nonfunctional in low light and rods mediate scotopic vision. Photopic vision is light detection by the cone photoreceptors of the eye under bright light conditions. In humans and many other animals, photopic vision allows color perception, mediated by cone cells, and a significantly higher visual acuity and temporal resolution than available with scotopic vision. Mesopic vision is a combination of photopic vision and scotopic vision in low but not quite dark lighting situations and involves an input from both rod and cone photoreceptors. As light levels increase, and as rods become saturated, melanopsin photoreception is activated. Whilst this diagram gives some sense of the sensory thresholds for the different photoreceptor classes, it is also misleading in that it fails to take into consideration the differences in effective stimulus durations for the rods, cones and melanopsin-pRGCs. Rods and cones detect light over the millisecond range whilst melanopsin-based pRGCs require long duration exposure to light to elicit a biological response. See text for details.

References

    1. Pittendrigh C.S. Temporal organization: Reflections of a Darwinian clock-watcher. Annu. Rev. Physiol. 1993;55:16–54. doi: 10.1146/annurev.ph.55.030193.000313. - DOI - PubMed
    1. Ko C.H., Takahashi J.S. Molecular components of the mammalian circadian clock. Hum. Mol. Genet. 2006;15:R271–R277. doi: 10.1093/hmg/ddl207. - DOI - PubMed
    1. Daan S., Pittendrigh C.S. A functional analysis of circadian pacemakers in nocturnal rodents. II. The variabilityof phase response curves. J. Comp. Physiol. 1976;106:253–266. doi: 10.1007/BF01417857. - DOI
    1. Khalsa S.B., Jewett M.E., Cajochen C., Czeisler C.A. A phase response curve to single bright light pulses in human subjects. J. Physiol. 2003;549:945–952. doi: 10.1113/jphysiol.2003.040477. - DOI - PMC - PubMed
    1. Pittendrigh C.S. Circadian rhythms and the circadian organization of living systems. Cold Spring Harb. Symp. Quant. Biol. 1960;25:159–184. doi: 10.1101/SQB.1960.025.01.015. - DOI - PubMed