. 2020 Jul 21;12(7):785.
doi: 10.3390/v12070785.

Oropouche Virus Infects, Persists and Induces IFN Response in Human Peripheral Blood Mononuclear Cells as Identified by RNA PrimeFlow™ and qRT-PCR Assays

Affiliations

Oropouche Virus Infects, Persists and Induces IFN Response in Human Peripheral Blood Mononuclear Cells as Identified by RNA PrimeFlow™ and qRT-PCR Assays

Mariene Ribeiro Amorim et al. Viruses. .

Abstract

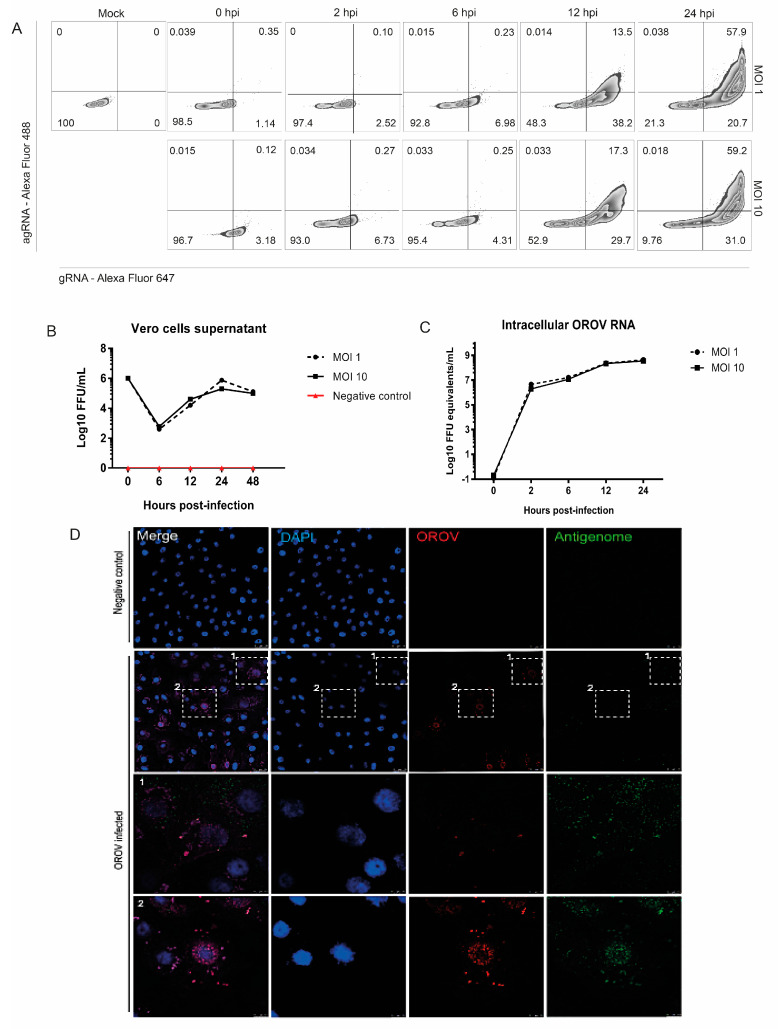
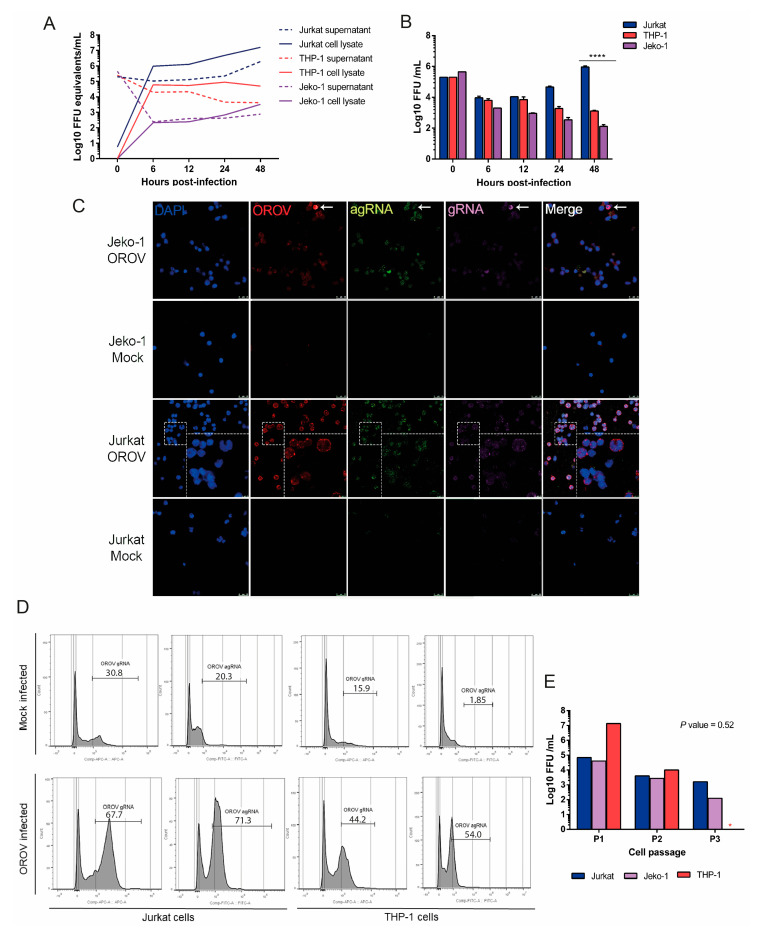
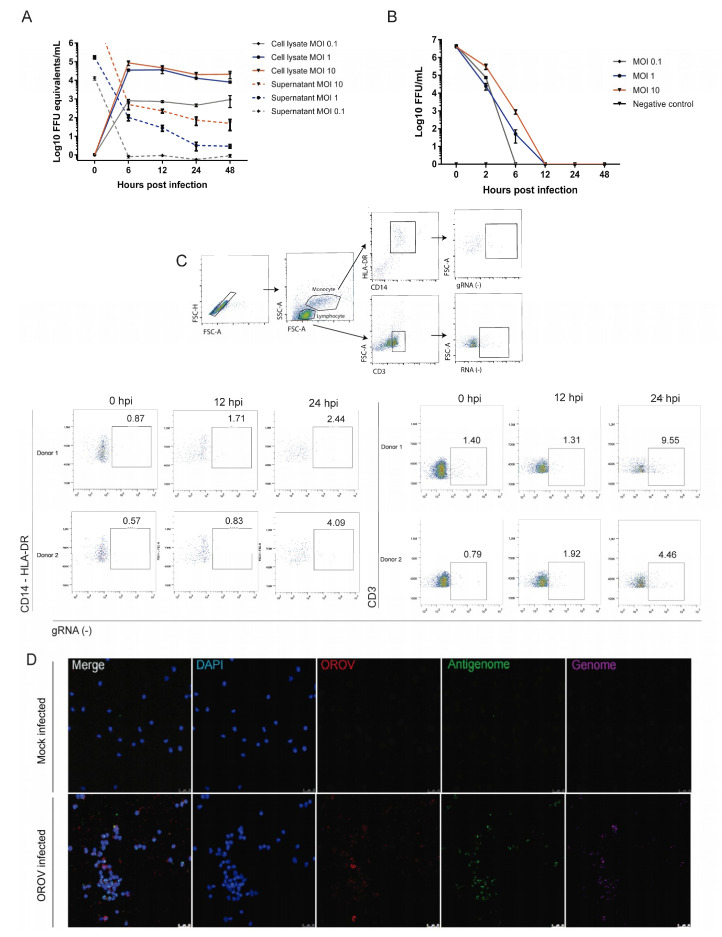
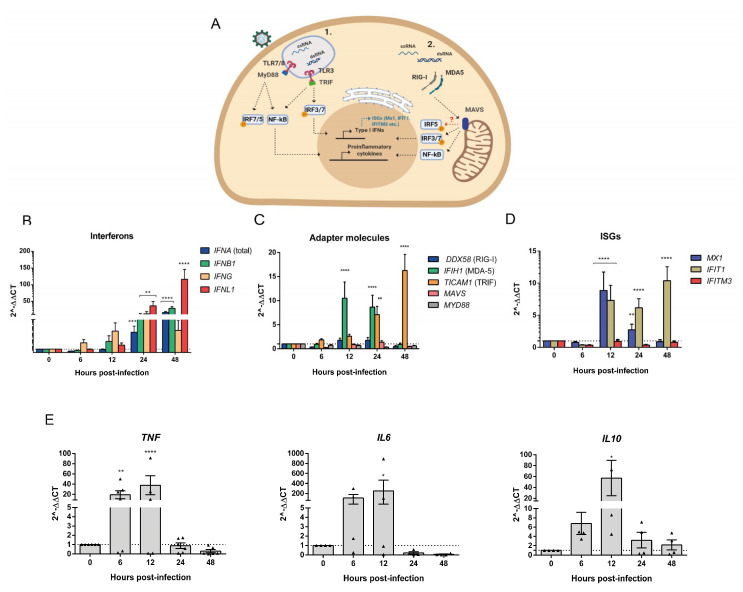
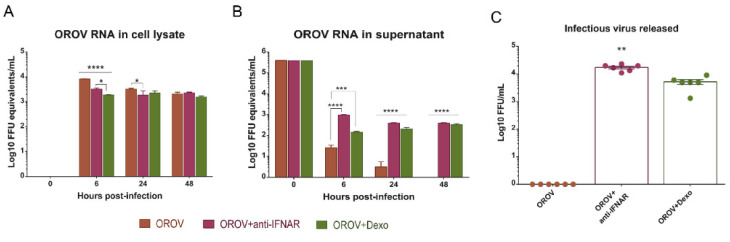
Oropouche orthobunyavirus (OROV) is an emerging arbovirus with a high potential of dissemination in America. Little is known about the role of peripheral blood mononuclear cells (PBMC) response during OROV infection in humans. Thus, to evaluate human leukocytes susceptibility, permissiveness and immune response during OROV infection, we applied RNA hybridization, qRT-PCR and cell-based assays to quantify viral antigens, genome, antigenome and gene expression in different cells. First, we observed OROV replication in human leukocytes lineages as THP-1 monocytes, Jeko-1 B cells and Jurkat T cells. Interestingly, cell viability and viral particle detection are maintained in these cells, even after successive passages. PBMCs from healthy donors were susceptible but the infection was not productive, since neither antigenome nor infectious particle was found in the supernatant of infected PBMCs. In fact, only viral antigens and small quantities of OROV genome were detected at 24 hpi in lymphocytes, monocytes and CD11c+ cells. Finally, activation of the Interferon (IFN) response was essential to restrict OROV replication in human PBMCs. Increased expression of type I/III IFNs, ISGs and inflammatory cytokines was detected in the first 24 hpi and viral replication was re-established after blocking IFNAR or treating cells with glucocorticoid. Thus, in short, our results show OROV is able to infect and remain in low titers in human T cells, monocytes, DCs and B cells as a consequence of an effective IFN response after infection, indicating the possibility of leukocytes serving as a trojan horse in specific microenvironments during immunosuppression.

Keywords: B cells; Oropouche virus; PBMC; RNA PrimeFlow™; dendritic cells; interferons; lymphocyte; monocytes.


Conflict of interest statement

The authors declare no conflicts of interest.

Figures

Figure 1
Figure 1
OROV genome and antigenome detection in Vero cells. RNA PrimeFlow™ assay for the detection of OROV productive infection was standardized in Vero cells. (A) Vero cells were previously infected with OROV and analyzed by RNA PrimeFlow™ assay at 2, 6, 12 and 24 hpi. Quadrants exhibit OROV genome (gRNA), antigenome (agRNA) or both detection in Vero cells infected at a Multiplicity of Infection (MOI) 1 and 10, and the percentage of events. Noninfected cells were also submitted to the protocol and are shown as the mock sample. (B) Vero cells were infected with OROV at MOI 1 and 10. Supernatants were collected at 0, 2, 6, 12, 24, and 48 hpi, and analyzed by focus forming assay (FFA). (C) Lysates from cellular monolayers were collected and analyzed by qRT-PCR for the assessment of OROV RNA. (D) Vero cells were cultivated in coverslips and infected with MOI 2. At 18 h post-infection, the coverslips were submitted to RNA PrimeFlow™ protocol for immunofluorescence. It is shown OROV proteins in red (Alexa Fluor 594), antigenome in green (AlexaFluor 488) and cell nuclei in blue (DAPI). Images with 63x times magnification. Scales at 2 μm, with 10 μm in zoomed images.
Figure 2
Figure 2
OROV productively infect different human leucocyte lineages. Jurkat, THP-1 and Jeko-1 cells were seeded in 24-well plates and infected with OROV. Cells, supernatants and cell lysates were collected for evaluation by different methodologies. (A) Infection at MOI 1 and OROV RNA measured in cellular lysates and supernatants by qRT-PCR for OROV segment S. Lines represent the mean of viral load ± SEM (B) FFA analysis of the supernatants. Jurkat cells’ productive viral replication was significantly different from THP-1 and Jeko-1 cells at 48 hpi. Tukey’s multiple comparison test was performed and the p-value < 0.0001 is represented by ****. (C) Detection of OROV 48 hpi in cells infected at MOI 2 by confocal microscopy. OROV proteins in red (Alexa Fluor 594); genome (gRNA) in magenta (AlexaFluor 647); antigenome (agRNA) in green (AlexaFluor 488); DAPI (blue). Images with 63x times magnification. Scales at 25 μm, with 75 μm in zoomed images. (D) Flow cytometry detection of OROV gRNA and agRNA in Jurkat and THP-1 cells infected with MOI 1 at 24 hpi. Mock PF represents the mock infected cells that were submitted to the RNA PrimeFlow™ protocol. (E) Jurkat, THP-1 and Jeko-1 cells were infected with MOI 1 and subcultured several times. A sample of the supernatant was collected at each passage (P1, P2, P3) and analyzed by FFA. The THP-1 cell culture did not resist until passage 3 (P3; red asterisk). The Friedman test showed no significant difference in viral replication between the three lineages. The results of infection kinetics are representations of two independent experiments.
Figure 3
Figure 3
Human peripheral blood monocytes and lymphocytes are susceptible to OROV infection but generate low yields of infectious particles. Human peripheral blood mononuclear cells (PBMCs) were obtained from whole blood of healthy donors, infected in vitro and analyzed by different methodologies. (A) PBMCs were seeded in 24-well plates and infected with OROV MOI 0.1; 1 and 10. Cell lysates and supernatants were collected to RNA quantification by qRT-PCR (n = 3). (B) The supernatants were also analyzed by FFA assay. Symbols represent the mean of viral load ± SEM. (C) PBMCs from healthy donors (n = 2) were infected with MOI 1, submitted RNA PrimeFlow™ protocol 24 hpi and flow cytometry. CD3+ and CD14+ HLA DR+ percentage of events with OROV Grna, and the gating strategy are shown. (D) Detection of OROV 48 hpi in cells infected with MOI 2, by confocal microscopy. OROV proteins in red (Alexa Fluor 594); genome (gRNA) in magenta (AlexaFluor 647); antigenome (agRNA) in green (AlexaFluor 488); DAPI (blue). Images with 63x times magnification. Scales at 25 μm.
Figure 4
Figure 4
OROV infection of PBMCs induces the expression of cytokines and innate immune response genes. Cell lysates from PBMCs obtained from healthy donors (n = 3) and infected with OROV at MOI 10 were processed for RNA extraction and RT-PCR. (A) Scheme of the RNA PAMPs recognition pathways analyzed. (BE) SYBR Green qRT-PCR data analysis of gene expression are shown in fold change (2^∆∆CT). Graphics show results from two independent experiments. Bars represent mean ± SEM. All times post-infection were compared to the time 0 h samples (noninfected) by two-way ANOVA and Dunnett’s multiple comparisons test. **** p-value < 0.0001; *** 0.0002 < p-value < 0.0007; ** 0.001 < p-value < 0.009; and * p-value < 0.03.
Figure 5
Figure 5
OROV infection and replication in PBMCs is favored when the type I IFN receptor is blocked and when the cells are treated with Dexamethasone. PBMC were pretreated for 2 h with Dexamethasone (Dexo) 1 µM and human anti-IFNAR antibody 5 ng/mL, and infected with OROV at MOI 1. Cell lysates and supernatants were collected for analysis. (A) qRT-PCR of cell lysate and supernatant (B) for OROV RNA detection through the time of infection. Data were compared by two-way ANOVA and Tukey’s multiple comparison test. (C) Infectious particles released in the supernatant were measured by FFA, 48 hpi. Treatment groups were compared by one-way ANOVA and Dunn’s multiple comparisons test. Bars represent viral load ± SEM. **** p-value < 0.0001, *** p-value < 0.0007; and * p-value < 0.05.

References

    1. Mavalankar D., Shastri P., Bandyopadhyay T., Parmar J., Ramani K.V. Increased mortality rate associated with Chikungunya epidemic, Ahmedabad, India. Emerg. Infect. Dis. 2008;14:412–415. doi: 10.3201/eid1403.070720. - DOI - PMC - PubMed
    1. Travassos Da Rosa J.F., De Souza W.M., De Paula Pinheiro F., Figueiredo M.L., Cardoso J.F., Acrani G.O., Teixeira Nunes M.R. Oropouche virus: Clinical, epidemiological, and molecular aspects of a neglected orthobunyavirus. Am. J. Trop. Med. Hyg. 2017;96:1019–1030. doi: 10.4269/ajtmh.16-0672. - DOI - PMC - PubMed
    1. de Souza Luna L.K., Rodrigues A.H., Santos R.I.M., Sesti-Costa R., Criado M.F., Martins R.B., Silva M.L., Delcaro L.S., Proença-Modena J.L., Figueiredo L.T.M., et al. Oropouche Virus Is Detected in Peripheral Blood Leukocytes From Patients. J. Med. Virol. 2017;89:1108–1111. doi: 10.1002/jmv.24722. - DOI - PubMed
    1. Cardoso B.F., Serra O.P., Da Silva Heinen L.B., Zuchi N., De Souza V.C., Naveca F.G., Dos Santos M.A.M., Slhessarenko R.D. Detection of oropouche virus segment s in patients and in culex quinquefasciatus in the state of mato grosso, Brazil. Mem. Inst. Oswaldo Cruz. 2015;110:745–754. doi: 10.1590/0074-02760150123. - DOI - PMC - PubMed
    1. Vasconcelos H.B., Azevedo R.S.S., Casseb S.M., Nunes-neto J.P., Chiang J.O., Cantuária P.C., Segura M.N.O., Martins L.C., Monteiro H.A.O., Rodrigues S.G., et al. Oropouche fever epidemic in Northern Brazil: Epidemiology and molecular characterization of isolates. J. Clin. Virol. 2008;44:129–133. doi: 10.1016/j.jcv.2008.11.006. - DOI - PubMed

Publication types

Supplementary concepts