. 2020 Jul 16;11(7):807.
doi: 10.3390/genes11070807.

Target-Genes Reveal Species and Genotypic Specificity of Anthocyanin Pigmentation in Citrus and Related Genera

Affiliations

Target-Genes Reveal Species and Genotypic Specificity of Anthocyanin Pigmentation in Citrus and Related Genera

Chiara Catalano et al. Genes (Basel). .

Abstract

Background: Anthocyanin pigmentation characterizes a number of tissues of Citrus and its relatives. The gain and loss of pigmentation is intriguing and is inherited variously among species.

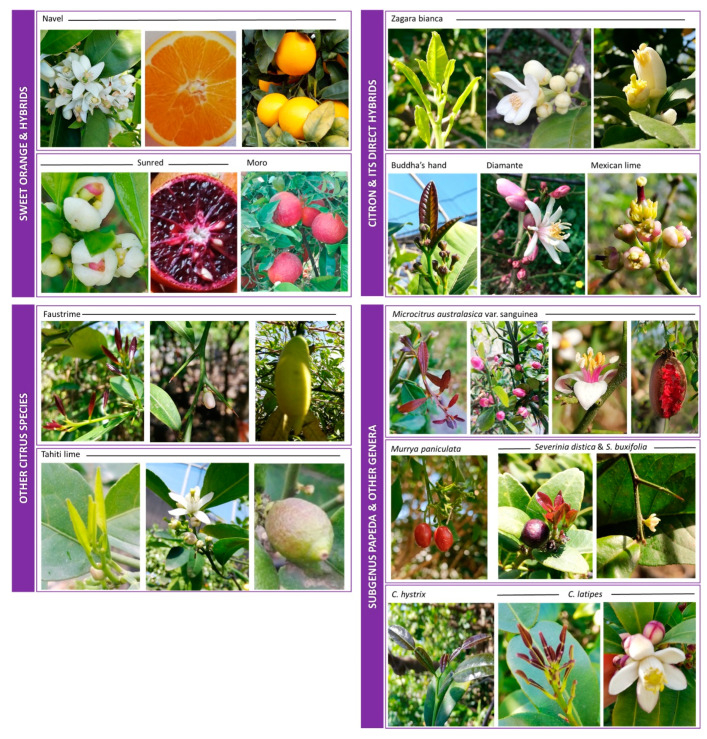
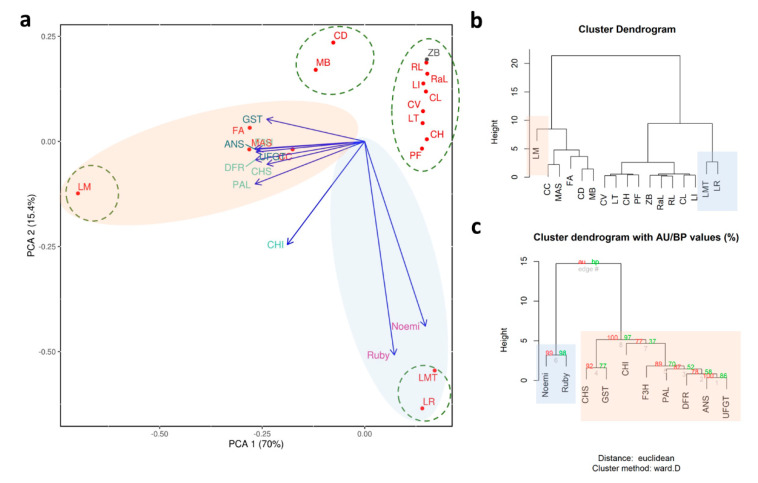
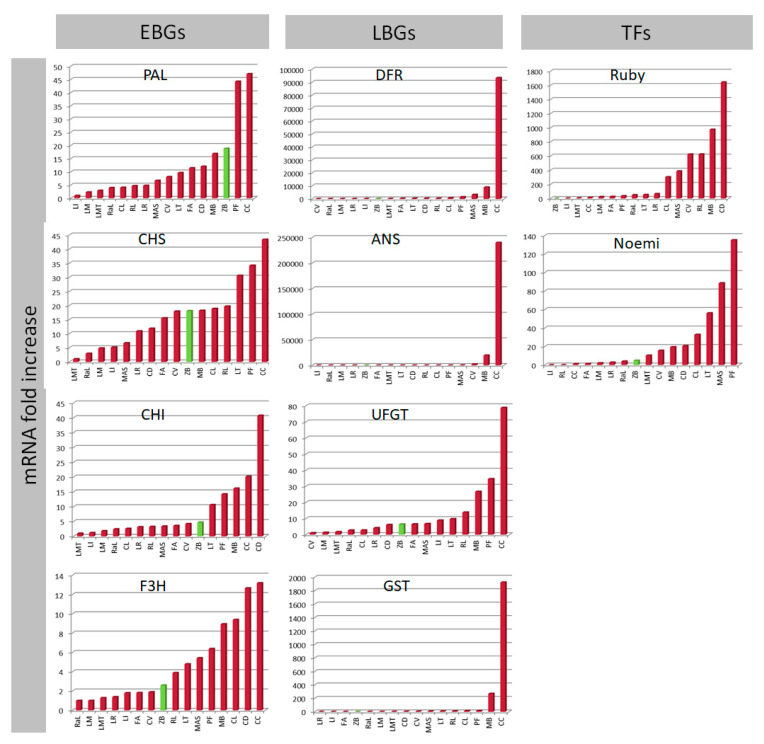
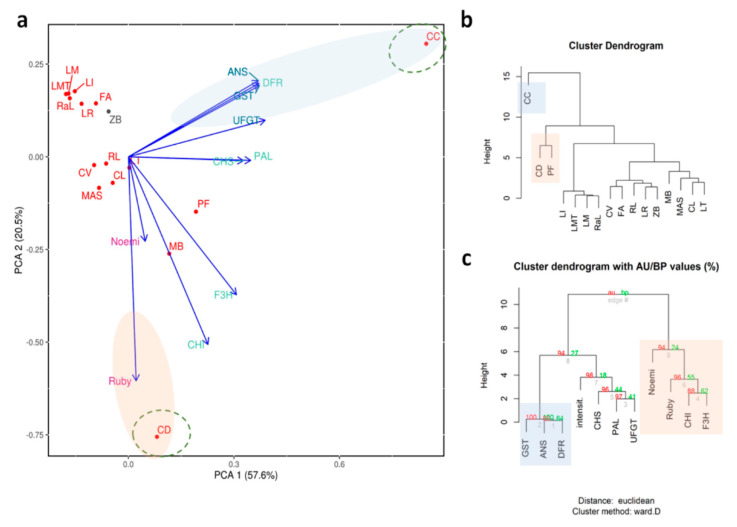
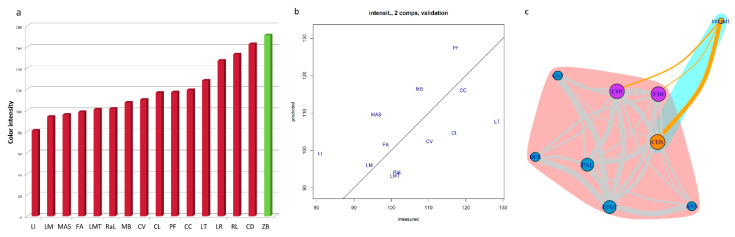
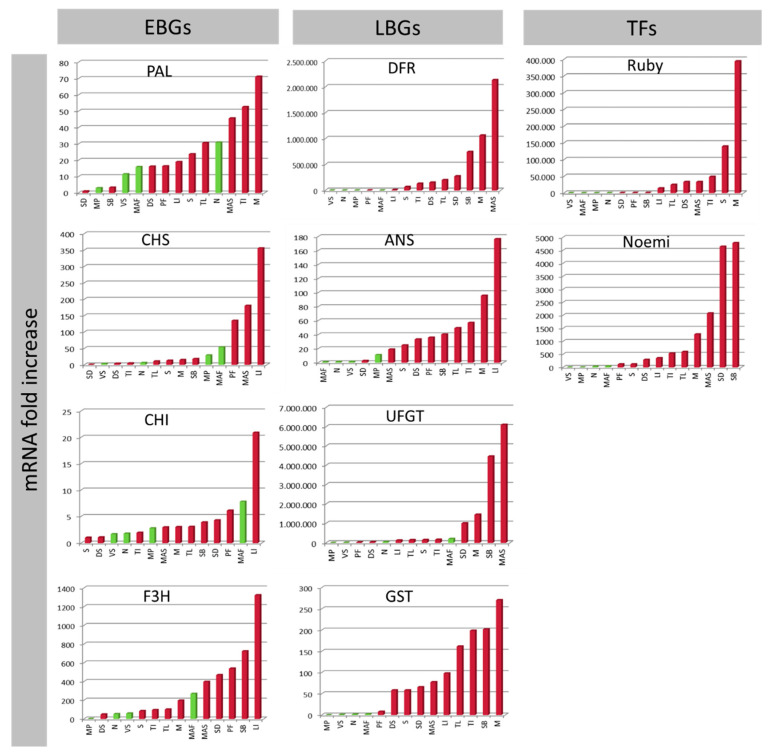
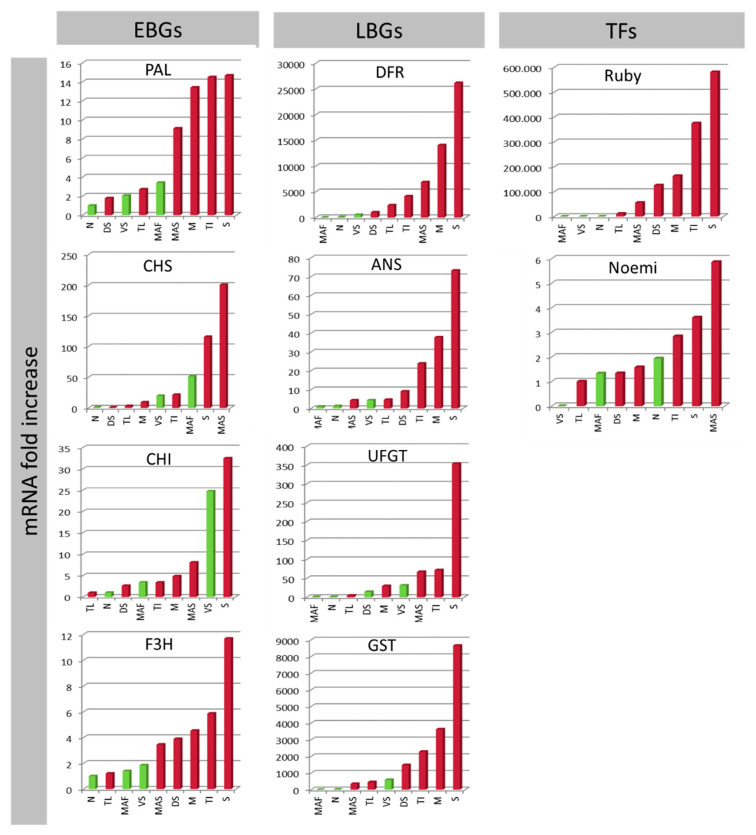
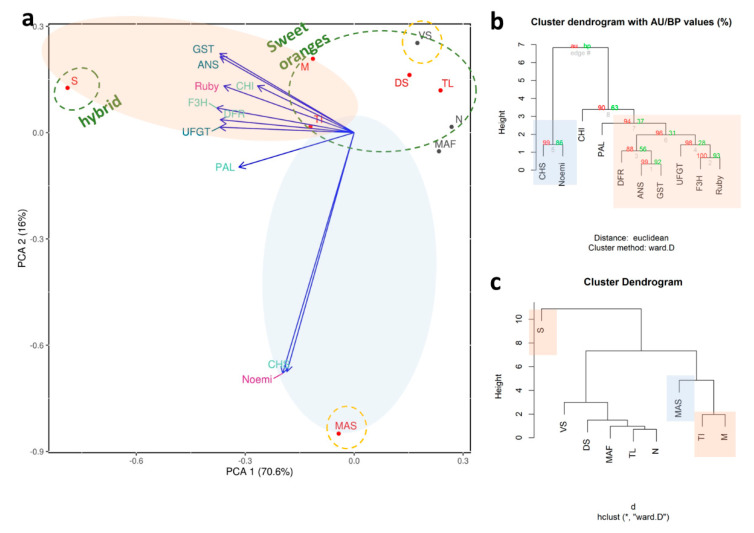
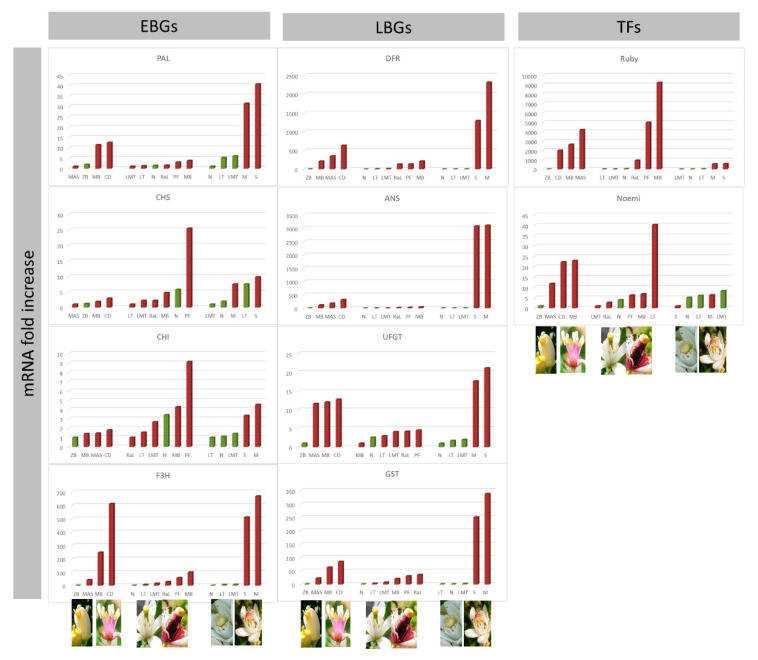
Methods: Citrus germplasm was used to investigate the anthocyanin pigmentation of tissues never before considered, including stamen, style and stigma, and of young leaves, petals, rind and flesh of 28 genotypes belonging to 14 species. Citrus genotypes encompassed citron, lemon, sweet orange, lime, and Citrus relatives included Microcitrus, Murraya, and Severinia. A relative qRT-PCR analysis was carried out on the structural and regulatory genes: phenylalanine ammonia-lyase (PAL), chalcone synthase (CHS), chalcone isomerase (CHI), flavanone 3'-hydroxylase (F3H), dihydroflavonol 4-reductase (DFR), anthocyanidin synthase (ANS), uridine diphosphate glucose flavonoid glucosyl-transferase (UFGT), glutathione S-transferase (GST), Ruby and Noemi. Image analysis and a genomic approach were employed to evaluate how the red pigmentation is inherited among tissues and species.

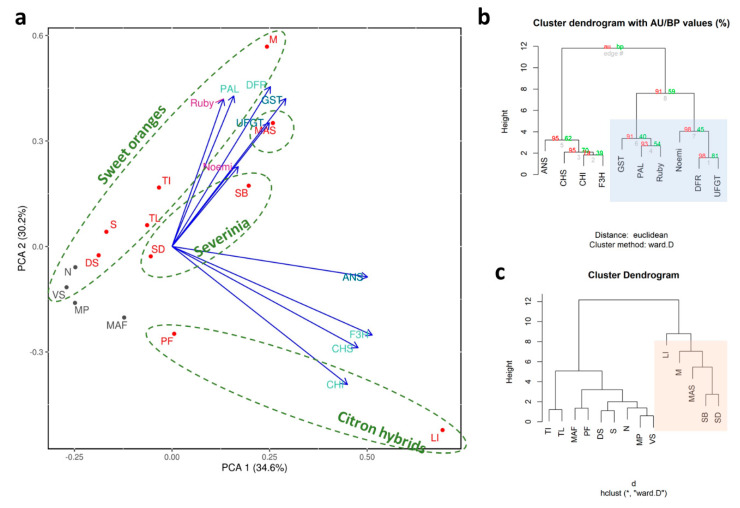
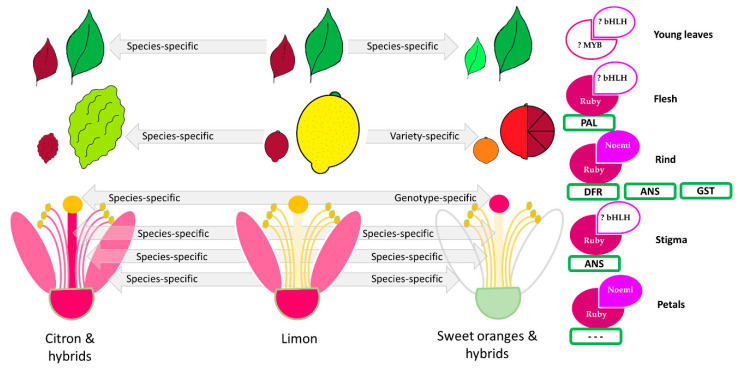
Results: Pigmentation of young leaves and petals is specific to citron and its hybrids. Ruby controls the pigmentation of petals, but not of leaves. The red color of the rind and flesh is a trait that particularly characterizes a diversity of sweet oranges, citron hybrids and Citrus relatives. Color expression depends on external factors and also on developmental stage. The coloration of stamen and style is citron-specific, while a red stigma is exclusive to Moro orange and its hybrids.

Conclusion: It is hypothesized that there is a relationship among Citrus species and genes controlling anthocyanin pigmentation.

Keywords: Citrus; fruit; image analysis; qRT-PCR; red color; stamen; stigma; style.


Conflict of interest statement

The authors declare no conflict of interest.

Figures

Figure 1
Figure 1
Variability in the levels of anthocyanins in the tissues of the accessions used in this study. These are combined into four groups as indicated in Table 1. For each group is presented a range of images of the most indicative accessions in terms of pigmentation in the young leaves, petals, stamens, styles, stigmas, flesh, and rind. Unpigmented examples are also shown for all tissues.
Figure 2
Figure 2
qRT-PCR expression data for all structural Early Biosynthetic Genes (EBGs) and Late Biosynthetic Genes (LBGs) and Transcription Factors (TFs) separated from young leaves. The expression levels were calculated as the mRNA fold increase. Each accession is indicated by a code: ‘Zagara bianca’—ZB, ‘Red lime’—RL, ‘Rangpur lime’—RaL, ‘Incomparabile’—LI, ‘Pink fleshed’—PF, Citrus latipes—CL, ‘Tahiti’—LT, C. volkameriana—CV, C. hystrix—CH, ‘Mexican lime’—LMT, ‘Lima rossa corrugata’—LR, C. celebica—CC, ‘Buddha’s hand’—MB, M. australasica var. sanguinea—MAS, ‘Diamante’—CD, ‘Meyer’—LM, ‘Femminello Adamo’—FA.
Figure 3
Figure 3
Statistical analyses carried out on accessions characterized by the pigmentation of young leaves. (a) Principal component analysis; cluster dendrograms based on the distribution of expression data focusing on (b) accessions and (c) genes where AU refers to Approximately Unbiased p-value and BP is for Bootstrap Probability value. Each accession is indicated by a code: ‘Zagara bianca’—ZB, ‘Red lime’—RL, ‘Rangpur lime’—RaL, ‘Incomparabile’—LI, ‘Pink fleshed’—PF, Citrus latipes—CL, ‘Tahiti’—LT, C. volkameriana—CV, C._hystrix—CH, ‘Mexican lime’—LMT, ‘Lima rossa corrugata’—LR, C. celebica—CC, ‘Buddha’s hand’—MB, M. australasica var. sanguinea—MAS, ‘Diamante’—CD, ‘Meyer’—LM, ‘Femminello Adamo’—FA.
Figure 4
Figure 4
The qRT-PCR expression data of all structural genes: Early Biosynthetic Genes (EBGs), Late Biosynthetic Genes (LBGs) and Transcription Factors (TFs) analyzed in petals. The expression levels are calculated as the mRNA fold increase. Each accession is indicated by code: ‘Lima rossa corrugata’—LR, ‘Incomparabile’—LI, ‘Femminello Adamo’—FA, ‘Zagara bianca’—ZB, ‘Rangpur lime’—RaL, ‘Meyer’—LM, ‘Mexican lime’—LMT, ‘Diamante’—CD, C. volkameriana—CV, M. australasica var. sanguinea—MAS, ‘Tahiti’—LT, ‘Red lime’—RL, Citrus latipes—CL, ‘Pink fleshed’—PF, ‘Buddha’s hand’—MB, C. celebica—CC.
Figure 5
Figure 5
Statistical analyses carried out on accessions selected for their petal pigmentation. (a) Principal components analysis; cluster dendrograms based on the distributions of expressions focused on (b) accessions and on (c) genes where AU refers to Approximately Unbiased p-value and BP is for Bootstrap Probability value. Each accession is indicated by code: ‘Lima rossa corrugata’—LR, ‘Incomparabile’—LI, ‘Femminello Adamo’—FA, ‘Zagara bianca’—ZB, ‘Rangpur lime’—RaL, ‘Meyer’—LM, ‘Mexican lime’—LMT, ‘Diamante’—CD, C. volkameriana—CV, M. australasica var. sanguinea—MAS, ‘Tahiti’—LT, ‘Red lime’—RL, Citrus latipes—CL, ‘Pink fleshed’—PF, ‘Buddha’s hand’—MB, C. celebica—CC.
Figure 6
Figure 6
Statistical analyses of the quantitative trait of anthocyanins accumulation in petals. The accessions are indicated with codes: ‘Incomparabile’—LI, ‘Meyer’—LM, M. australasica var. sanguineaMAS, ‘Femminello Adamo’—FA, ‘Mexican lime’—LMT, ‘Rangpur lime’—RaL, ‘Buddha’s hand’—MB, C. volkameriana—CV, Citrus latipes—CL, ‘Pink fleshed’—PF, C. celebica—CC, ‘Tahiti’—LT, ‘Lima rossa corrugata’—LR, ‘Red lime’—RL, ‘Diamante’—CD, ‘Zagara bianca’—ZB. (a) Bar plot of petal color intensity measured by image analysis on petals as the intensity in grayscale (whitest has the highest value) reported for each accession. (b) Validation plot of the partial least square regression (PLS) model for petal pigmentations. Values measured by image analysis of petals versus predicted values from gene expression using the first two components of the model. (c) The network of gene expressions in petals involved in pigmentation measured as the color intensity. The thickness of edges represents the Pearson’s Correlation Coefficient value, the node dimension represents the weight of the node in the network, the color of the edge represents the relationship among genes in grey and with the phenotypical trait in dark orange. The node colors represent the subgroups and the halo represents community detection, based on edge-betweenness.
Figure 7
Figure 7
qRT-PCR expression data for all structural genes in the rind separated into Early Biosynthetic Genes (EBGs), Late Biosynthetic Genes (LBGs) and Transcription Factors (TFs). The expression level was calculated as the mRNA -fold increase. Each accession is coded: M. paniculata—MP, ‘Vaniglia sanguigno’—VS, ‘Navel’—N, ‘Faustrime’—MAF, ‘Pink fleshed’—PF, ‘Doppio sanguigno’—DS, ‘Sunred’—S, S. disticha—SD, M. australasica var. sanguinea—MAS, ‘Incomparabile’—LI, ‘Tarocco Lempso’—TL, ‘Tarocco Ippolito’—TI, S. buxifolia—SB, ‘Moro’—M.
Figure 8
Figure 8
Statistical analyses carried out on accessions selected for their rind pigmentation. (a) Principal component analysis, cluster dendrogram based on the distribution of expression data focused (b) on genes where AU refers to Approximately Unbiased p-value and BP is for Bootstrap Probability value; and (c) on accessions. Accessions are coded: M paniculata—MP, ‘Vaniglia sanguigno’—VS, ‘Navel’—N, ‘Faustrime’—MAF, ‘Pink fleshed’—PF, ‘Doppio sanguigno’—DS, ‘Sunred’—S, S disticha—SD, M. australasica var. sanguinea—MAS, ‘Incomparabile’—LI, ‘Lempso’—TL, ‘Ippolito’—TI, S. buxifolia—SB, ‘Moro’—M.
Figure 9
Figure 9
qRT-PCR expression data for all structural genes separated into Early Biosynthetic Genes (EBGs), Late Biosynthetic Genes (LBGs), and Transcription Factors (TFs) in the flesh of M. australasica and Faustrime, and of the juices of all other accessions. The expression level was calculated as the mRNA-fold increase. Accessions are coded: ‘Faustrime’—MAF, ‘Navel’—N, M. australasica var. sanguinea—MAS, ‘Tarocco Lempso’—TL, ‘Vaniglia sanguigno’—VS, ‘Doppio sanguigno’—DS, ‘Tarocco Ippolito’—TI, ‘Moro’—M, ‘Sunred’—S.
Figure 10
Figure 10
Statistical analysis of accessions selected for their pigmentation in flesh and juice. (a) Principal component analysis, cluster dendrogram based on the distribution of expression data focused (b) on genes and (c) on accessions. Accessions are coded: ‘Faustrime’—MAF, ‘Navel’—N, M. australasica var. sanguinea—MAS, ‘Tarocco Lempso’—TL, ‘Vaniglia sanguigno’—VS, ‘Doppio sanguigno’—DS, ‘Tarocco Ippolito’—TI, ‘Moro’—M, ‘Sunred’—S.
Figure 11
Figure 11
qRT-PCR expression data for all structural genes separated into Early Biosynthetic Genes (EBGs) and Late Biosynthetic Genes (LBGs) and Transcription Factors (TFs) in stamen, style, and stigma. The expression levels were calculated as mRNA-fold increases. Each accession is indicated by a code: ‘Zagara bianca’—ZB, M. australasica var. sanguinea—MAS, ‘Buddha’s hand’—MB, ‘Diamante’—CD, ‘Navel’—N, ‘Tahiti’—LT, ‘Mexican lime’—LMT, ‘Pink fleshed’—PF, ‘Rangpur lime’—RaL, ‘Moro’—M, ‘Sunred’—S.
Figure 12
Figure 12
A model illustrating the putative inheritance of anthocyanin pigmentation in tissues of the main Citrus species and hybrids considered in this study. A scheme of leaves, fruits, and flowers tissue pigmentation is shown. A representation of transcription factors (Ruby and Noemi), biosynthetic genes (PAL, dihydroflavonol 4-reductase (DFR), anthocyanidin synthase (ANS), glutathione S-transferase (GST)) and their relationship based on the qualitative statistical analysis describing the difference between pigmented and non-pigmented samples in tissues is presented.

References

    1. Wu G.A., Terol J., Ibanez V., López-García A., Pérez-Román E., Borredá C., Domingo C., Tadeo F.R., Carbonell-Caballero J., Alonso R., et al. Genomics of the Origin and Evolution of Citrus. Nature. 2018;554:311–316. doi: 10.1038/nature25447. - DOI - PubMed
    1. Ollitrault P., Curk F., Krueger R. Citrus Taxonomy. In: Talon M., Caruso M., Gmitter F.G., editors. The Genus Citrus. Woodhead Publishing, Elsevier; Duxford, UK: 2020. - DOI
    1. Butelli E., Garcia-Lor A., Licciardello C., Las Casas G., Hill L., Recupero G.R., Keremane M.L., Ramadugu C., Krueger R., Xu Q., et al. Changes in Anthocyanin Production during Domestication of Citrus. Plant Physiol. 2017;173:2225–2242. doi: 10.1104/pp.16.01701. - DOI - PMC - PubMed
    1. Huang D., Wang X., Tang Z., Yuan Y., Xu Y., He J., Jiang X., Peng S.A., Li L., Butelli E., et al. Subfunctionalization of the Ruby2–Ruby1 Gene Cluster during the Domestication of Citrus. Nat. Plants. 2018;4:930–941. doi: 10.1038/s41477-018-0287-6. - DOI - PubMed
    1. Li H., Deng Z., Zhu H., Hu C., Liu R., Young J.C., Tsao R. Highly Pigmented Vegetables: Anthocyanin Compositions and Their Role in Antioxidant Activities. Food Res. Int. 2012;46:250–259. doi: 10.1016/j.foodres.2011.12.014. - DOI

Publication types

MeSH terms