. 2020 Jul 16;12(7):1927.
doi: 10.3390/cancers12071927.

Genetic and Molecular Basis of Heterogeneous NK Cell Responses against Acute Leukemia

Affiliations

Genetic and Molecular Basis of Heterogeneous NK Cell Responses against Acute Leukemia

Dhon Roméo Makanga et al. Cancers (Basel). .

Abstract

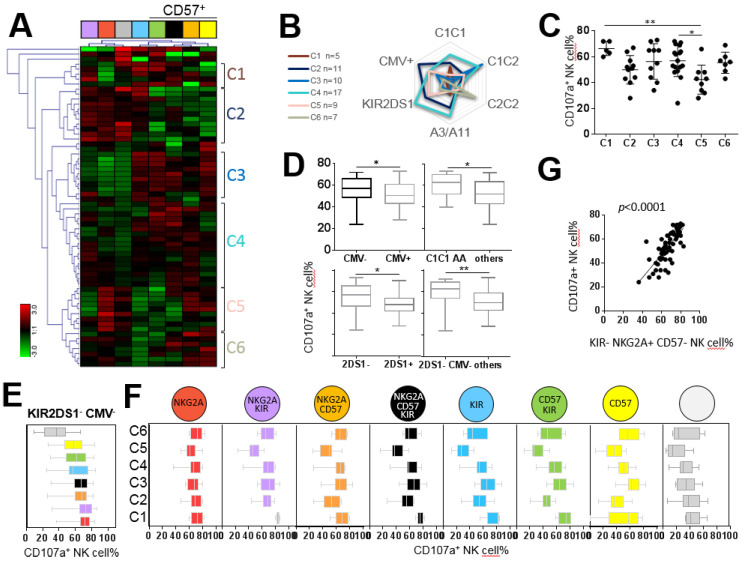
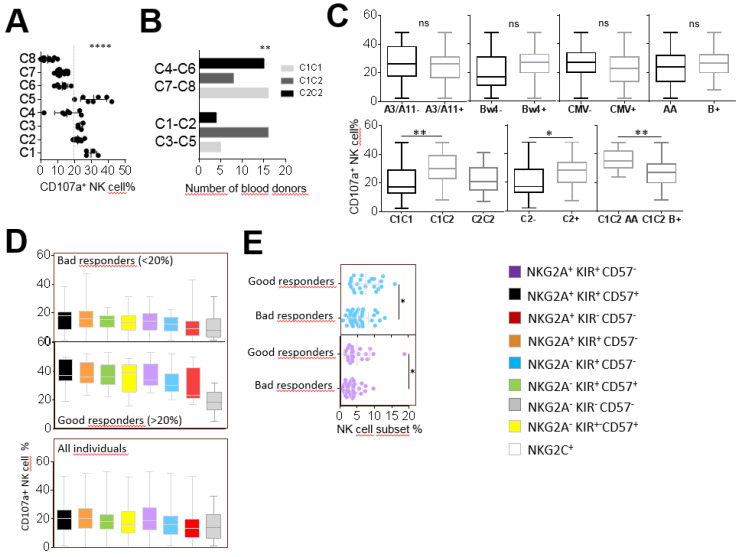
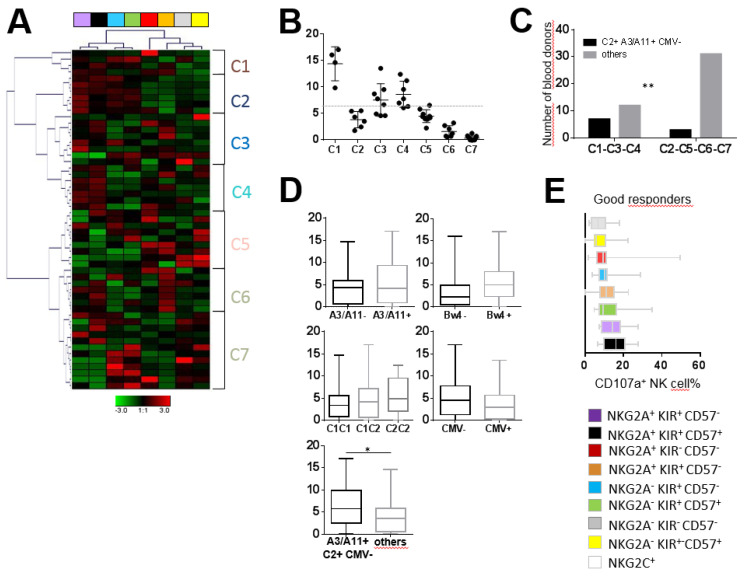
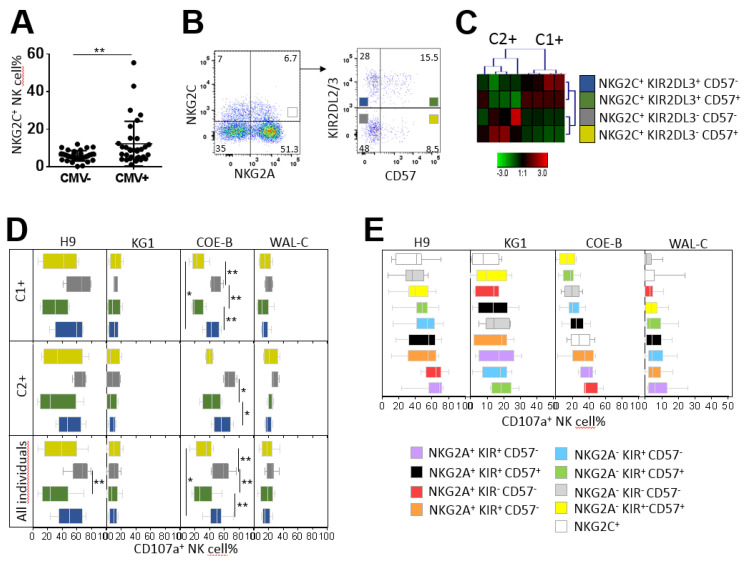
Natural killer (NK) cells are key cytotoxic effectors against malignant cells. Polygenic and polymorphic Killer cell Immunoglobulin-like Receptor (KIR) and HLA genes participate in the structural and functional formation of the NK cell repertoire. In this study, we extensively investigated the anti-leukemic potential of NK cell subsets, taking into account these genetic parameters and cytomegalovirus (CMV) status. Hierarchical clustering analysis of NK cell subsets based on NKG2A, KIR, CD57 and NKG2C markers from 68 blood donors identified donor clusters characterized by a specific phenotypic NK cell repertoire linked to a particular immunogenetic KIR and HLA profile and CMV status. On the functional side, acute lymphoblastic leukemia (ALL) was better recognized by NK cells than acute myeloid leukemia (AML). However, a broad inter-individual disparity of NK cell responses exists against the same leukemic target, highlighting bad and good NK responders. The most effective NK cell subsets against different ALLs expressed NKG2A and represented the most frequent subset in the NK cell repertoire. In contrast, minority CD57+ or/and KIR+ NK cell subsets were more efficient against AML. Overall, our data may help to optimize the selection of hematopoietic stem cell donors on the basis of immunogenetic KIR/HLA for ALL patients and identify the best NK cell candidates in immunotherapy for AML.

Keywords: CMV; HLA; KIR; acute leukemia; natural killer cells; repertoire.


Conflict of interest statement

The authors declare no conflict of interest.

Figures

Figure 1
Figure 1
Inter- and intra-individual heterogeneity of NK cell responses against a panel of myeloid and lymphoid target cells. (A) Histogram outlining NK (CD3 CD56+) cell degranulation observed after 5 h incubation in the presence of myeloid cell lines (blue bar) and lymphoid cell lines (red bar) at an effector/target ratio of 1:1 for 14 representative blood donors. Values are expressed as mean ± SD. (B) Heatmap representing the relative MFI of each NK ligand expression on target cell surfaces using Genesis software. Relative MFI represents the ratio of the MFI of each NK ligand on the MFI of isotype control of each mAb. Red and green indicate high expression levels and low expression levels, respectively. The modulation of NKG2D (C), DNAM-1 (D) and 2B4 (E) expression observed after NK cell stimulation in the presence of H9 ALL and KG1 AML cell lines at an effector/target ratio 1:1 from 24 representative healthy blood donors by MFC. (F) NK cell degranulation evaluated against H9 ALL and KG1 AML cell lines from a broader cohort of 68 blood donors. Good and bad responders are located in gray and pink zones, respectively. (G) NK cell degranulation against H9 and KG1 cell lines is represented for good responders identified against H9. (H) NK cell degranulation against H9 and KG1 cell lines is represented for good responders identified against KG1. **** Indicates p < 0.0001 (Student’s t-test).
Figure 2
Figure 2
Impact of the immunogenetic KIR/HLA profile and CMV status on the structuration of the NK cell repertoire. (A) Heatmap (Genesis®) clustering of healthy blood donors (n = 68) from the frequency of nine NK cell subsets targeted by flow cytometry based on NKG2A, KIR, NKG2C and CD57 markers. Each column is dedicated to a defined NK cell subset. Red and green indicate the high and low frequencies of the NK cell subsets, respectively. C1–C9 indicate the nine clusters of individuals. (B) Charts representing frequencies of nine investigated NK cell subsets for each cluster. (C) Radar charts indicating the number of blood donors for each characteristic (KIR AA or B+ genotype, A3/A11, Bw4, C1 and C2 environment and CMV status) per cluster. The KIR/HLA immunogenetic profiles and CMV status impacting each cluster are indicated in brown. (D) Whisker graphs of NK cell subset frequencies according to A3/A11, Bw4, C1, and C2 environments, KIR genotype (AA or B+) and CMV status investigated in 68 individuals. * Indicates p < 0.05, ** indicates p < 0.01 and **** indicates p < 0.0001.
Figure 3
Figure 3
NKG2A+ NK cell subsets are the most efficient against the H9 ALL cell line. (A) Heatmap (Genesis®) clustering of healthy blood donors (n = 68) from the degranulation of eight targeted NK cell subsets. NK cell subset degranulation was assessed after 5 h incubation in the presence of the H9 ALL cell line at an effector/target ratio of 1:1. Each column is dedicated to a defined NK cell subset. Red and green indicate high frequency and low frequency of NK cell degranulation, respectively. C1–C6 indicate the six clusters of individuals. (B) Radar charts indicating the number of blood donors for each characteristic (KIR AA or B+ genotype, A3/A11, Bw4, C1 and C2 environment and CMV status) per cluster. (C) Whisker graphs of whole NK cell degranulation in each cluster. (D) Whisker graphs of whole NK cell degranulation according to C1C1 environment, KIR genotype (AA), KIR gene content (2DS1+ or 2DS1) and CMV status (CMV+ or CMV) investigated in 68 individuals. (E) Whisker graphs illustrating the degranulation of the eight investigated NK cell subsets from the best responders, KIR2DS1 CMV, against the H9 ALL cell line. NK cell subsets are classified from the highest to the lowest efficiency. NKG2A+ KIR CD57 NK cells represented the most efficient NK cell subset against the H9 ALL cell line. (F) Whisker graphs of NK cell degranulation for each investigated NK cell subset for all clusters. (G) Correlation between NKG2A+ KIR CD57 NK cell frequencies and whole NK cell degranulation percentage from 68 individuals. p-values are indicated only where a significant p-value was obtained (p < 0.05). * Indicates p < 0.05, ** indicates p < 0.01. Spearman’s rank correlation coefficients were calculated, and p-values of p < 0.0001 were obtained.
Figure 4
Figure 4
CD57+ NK cell subsets are the most efficient against the KG1 AML cell line. (A) Dot plots illustrating the whole NK cell degranulation of eight clusters of individuals. (B) Histograms indicating the number of individuals according to HLA-C environment (C1C1, C1C2 and C2C2) for good (C1, C2, C3 and C5) and bad (C4, C6, C7 and C8) responders. (C) Whisker graphs representing whole NK cell degranulation according to A3/A11, Bw4, C1, C2 environments, KIR genotype (AA or B+) and CMV status investigated in 68 individuals. (D) Whisker graphs illustrating the degranulation frequency of eight NK cell subsets against the KG1 AML cell line from bad and good responders and from all individuals (n = 68). NK cell subsets are classified from the highest to the lowest efficiency. (E) Dot plots illustrating the NK cell frequency of NKG2A+ KIR CD57 (blue) and NKG2A+ KIR+ CD57 (purple) NK cell subsets for bad and good responders. p-values are indicated only where a significant p-value was obtained (p < 0.05). * Indicates p < 0.05, ** indicates p < 0.01, **** indicates p < 0.0001.
Figure 5
Figure 5
KIR+ NK cell subsets are the most efficient against primary AML blasts. (A) Heatmap (Genesis®) clustering of healthy blood donors (n = 51) from the degranulation of eight targeted NK cell subsets. NK cell subset degranulation was assessed after 5 h incubation in the presence of primary AML target cells at an effector/target ratio of 1:1. Each column is dedicated to a defined NK cell subset. Red and green indicate high frequency and low frequency of NK cell degranulation, respectively. C1–C7 indicate the seven clusters of individuals. (B) Dot plots illustrating whole NK cell degranulation of blood donors clustered from C1 to C7. (C) Histograms illustrating the number of individuals according to A3/A11, C2 environment and CMV for bad (C2, C5, C6 and C7) and good (C1, C3 and C4) responders. (D) Whisker graphs of whole NK cell degranulation according to HLA-Bw4, A3/A11, C1 and C2 environments and CMV status in 51 individuals. (E) Whisker graphs of the degranulation frequency of the eight investigated NK cell subsets against primary AML target cells for the good (C1, C3 and C4) responders. NK cell subsets are classified from the highest to the lowest efficiency. p-values are indicated only where a significant p-value was obtained (p < 0.05). * Indicates p < 0.05, ** indicates p < 0.01.
Figure 6
Figure 6
Degranulation potential of CMV-driven NKG2C+ NK cell subsets against leukemia target cells. (A) Dot plots of NKG2C+ NK cell frequencies in CMV (n = 32) and CMV+ (n = 36) individuals. (B) Density plots illustrating the cell strategy to target NKG2C+ NK cell subsets expressing or not expressing KIR2DL2/3 and CD57. (C) Heatmap (Genesis®) clustering of CMV+ blood donors with NKG2C NK cell amplification (n = 8) from the frequencies of the four NKG2C+ (KIR+ CD57+, KIR+ CD57, KIR CD57+ and KIR CD57) NK cell subsets. Each column is dedicated to a defined NK cell subset. The color of each square reflects the percentage of the corresponding subset. Red and green indicate high and low frequencies of NK cell subsets, respectively. (D) Whisker graphs of the degranulation of the four NKG2C+ NK cell subsets against ALL H9 and AML KG1 cell lines, primary ALL COE-B and AML WAL-C blasts for C1+ (n = 4), C2+ (n = 4) and all individuals (n = 8). (E) Whisker graphs of degranulation frequency of the nine investigated NK cell subsets from CMV+ individuals (n = 9) with amplification of the NKG2C+ NK cell subsets against H9, KG1, CO-E and WAL-C. NK cell subsets are classified from the highest to the lowest efficiency. p-values are indicated only where a significant p-value was obtained (p < 0.05). * Indicates p < 0.05 and ** indicates p < 0.01.

References

    1. Iannello A., Thompson T.W., Ardolino M., Marcus A., Raulet D.H. Immunosurveillance and immunotherapy of tumors by innate immune cells. Curr. Opin. Immunol. 2016;38:52–58. doi: 10.1016/j.coi.2015.11.001. - DOI - PMC - PubMed
    1. Waggoner S.N., Reighard S.D., Gyurova I.E., Cranert S.A., Mahl S.E., Karmele E.P., McNally J.P., Moran M.T., Brooks T.R., Yaqoob F., et al. Roles of natural killer cells in antiviral immunity. Curr. Opin. Virol. 2016;16:15–23. doi: 10.1016/j.coviro.2015.10.008. - DOI - PMC - PubMed
    1. Kärre K. MHC gene control of the natural killer system at the level of the target and the host. Semin. Cancer Biol. 1991;2:295–309. - PubMed
    1. Anfossi N., André P., Guia S., Falk C.S., Roetynck S., Stewart C.A., Breso V., Frassati C., Reviron D., Middleton D., et al. Human NK cell education by inhibitory receptors for MHC class I. Immunity. 2006;25:331–342. doi: 10.1016/j.immuni.2006.06.013. - DOI - PubMed
    1. Boudreau J.E., Hsu K.C. Natural killer cell education in human health and disease. Curr. Opin. Immunol. 2018;50:102–111. doi: 10.1016/j.coi.2017.11.003. - DOI - PMC - PubMed