. 2020 Jul 16;9(7):943.
doi: 10.3390/foods9070943.

Sourdough Fermentation Degrades Wheat Alpha-Amylase/Trypsin Inhibitor (ATI) and Reduces Pro-Inflammatory Activity

Affiliations

Sourdough Fermentation Degrades Wheat Alpha-Amylase/Trypsin Inhibitor (ATI) and Reduces Pro-Inflammatory Activity

Xin Huang et al. Foods. .

Abstract

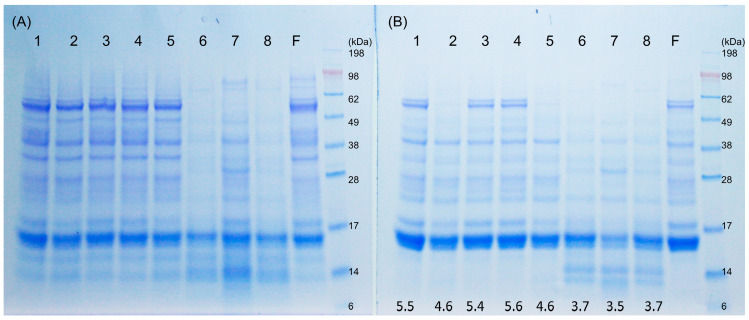
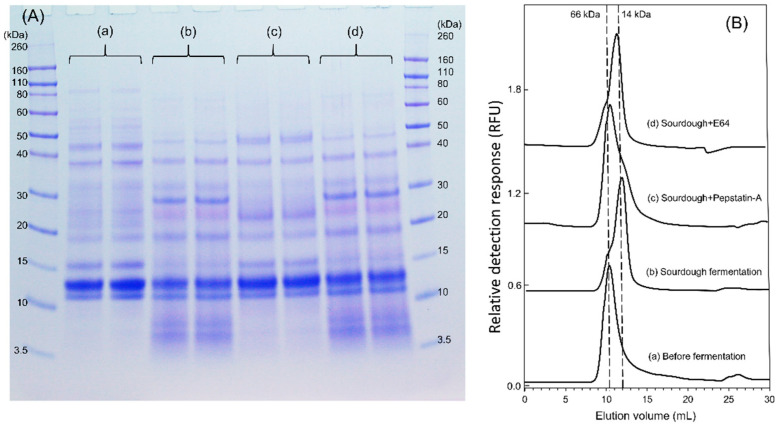
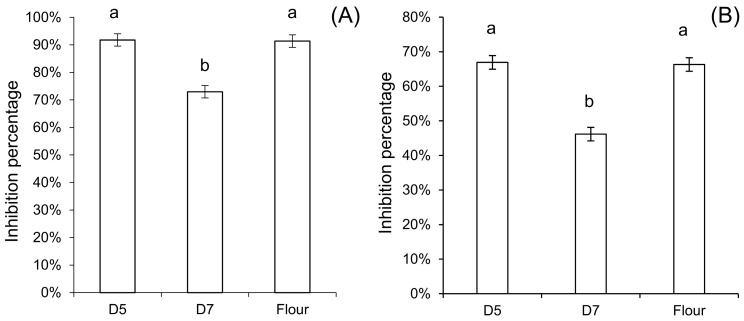
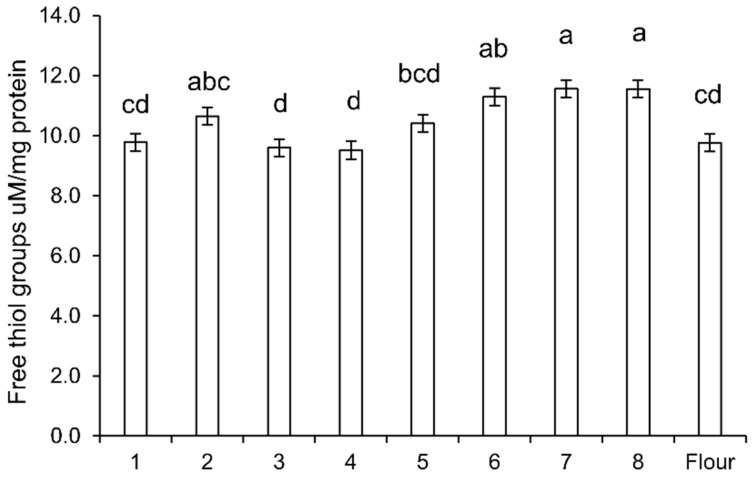
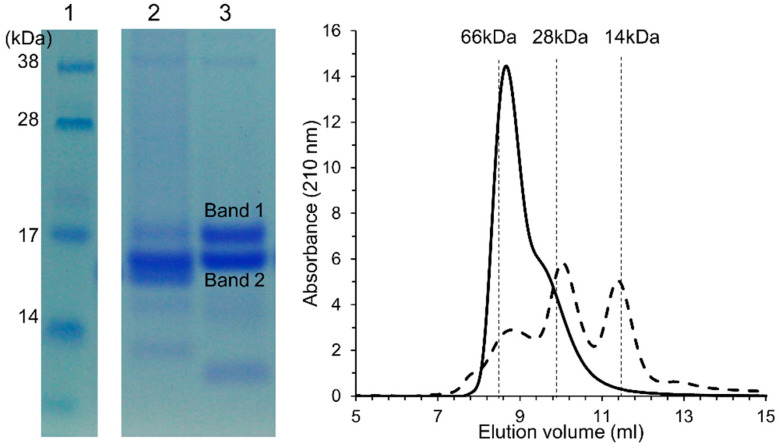
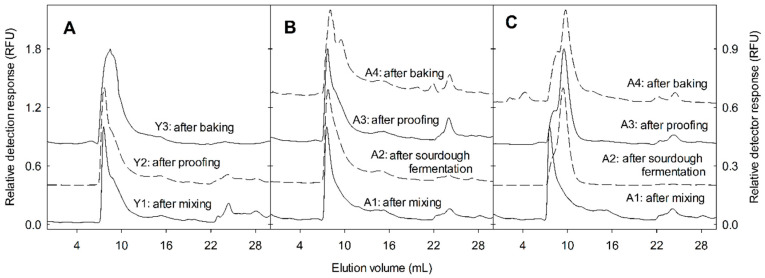
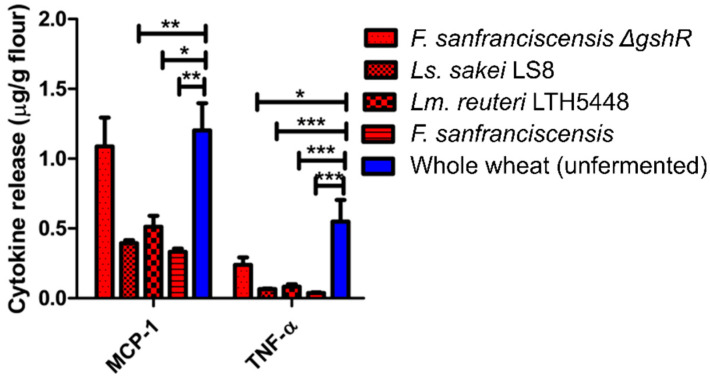
The ingestion of gluten-containing foods can cause wheat-related disorders in up to 15% of wheat consuming populations. Besides the role of gluten, α-amylase/trypsin inhibitors (ATI) have recently been identified as inducers of an innate immune response via toll-like receptor 4 in celiac disease and non-celiac wheat sensitivity. ATI are involved in plant self-defense against insects and possibly in grain development. Notably, they are largely resistant to gastrointestinal proteases and heat, and their inflammatory activity affects not only the intestine, but also peripheral organs. The aim of this study was to understand the changes of ATI throughout the sourdough and yeast-fermented bread-making processes. ATI tetramers were isolated, fluorescein-labelled, and added to a mini-dough bread-making system. When the pH decreased below 4.0 in sourdough fermentation, the ATI tetramers were degraded due to the activation of aspartic proteases, whilst in yeast fermentation, ATI tetramers remained intact. The amylase inhibitory activity after sourdough fermentation decreased significantly, while the concentration of free thiol groups increased. The glutathione reductase activity of Fructilactobacillus sanfranciscensis did not contribute to the reduction of ATI tetramers. Compared to the unfermented wheat, sourdough fermentation was able to decrease the release of pro-inflammatory cytokines monocyte chemoattractant protein-1 (MCP-1) and tumor necrosis factor alpha (TNF-α) in quantitative ATI extracts added to the human monocytic cell line THP-1. The current data suggest that sourdough fermentation can degrade ATI structure and bioactivity, and point to strategies to improve product development for wheat sensitivity patients.

Keywords: bioactivity; fermentation; innate immunity; lactic acid bacteria; wheat sensitivity.


Conflict of interest statement

The authors declare no conflict of interest.

Figures

Figure 1
Figure 1
Sodium dodecyl sulfate–polyacrylamide gel electrophoresis (SDS-PAGE) under reducing condition of (A) the albumin/globulin extract of yeast-fermented doughs and sourdoughs, and (B) albumin/globulin extract of yeast-fermented doughs and sourdoughs after heat treatment. The pH value after fermentation is indicated below. Dough 1, yeast-fermented dough at 30 °C for 1 h; 2, yeast-fermented dough at 30 °C for 17 h; 3, yeast-fermented dough at 4 °C for 17 h; 4, yeast-fermented dough with glutathione at 30 °C for 1 h; 5, yeast-fermented dough with glutathione at 30 °C for 17 h; 6, chemically acidified dough, pH 3.5, at 30 °C for 17 h; 7, wheat sourdough at 30 °C for 17 h; 8, chemically acidified dough, pH 3.5, with glutathione at 30 °C for 17 h; F, wheat flour. The α-amylase/trypsin inhibitor (ATI) proteins migrate in the range of molecular weight 12–15 kDa.
Figure 2
Figure 2
Effect of protease inhibitors on the wheat sourdough albumin/globulin extract and fluorescence-labelled ATI tetramer. (A) SDS-PAGE of albumin/globulin extract. (a) control before fermentation, (b) rye starter-wheat sourdough, pH was 3.6 after 17 h fermentation, (c) rye starter-wheat sourdough in the presence of 20 µM aspartic proteinase inhibitor Pepstatin-A, pH was 3.7 after 17 h fermentation, (d) rye starter-wheat sourdough in the presence of 10 µM cysteine proteinase inhibitor E-64, pH was 3.6 after 17 h fermentation. The replicates were from two individual fermentation. (B) Size-exclusion chromatogram of fluorescein isothiocyanate (FITC)-labelled ATI tetramer after sourdough fermentation in the presence of protease inhibitors. The samples were treated the same as in (A). Fluorescent detector was set at excitation 488 nm and emission 530 nm. Elution volume of molecular marker bovine serum albumin (66 kDa) and lysozyme (14 kDa) was indicated in broken lines.
Figure 3
Figure 3
Inhibitory activity of the albumin/globulin extract after heat treatment against α-amylase from (A) yellow mealworm Tenebrio molitor, and (B) from porcine pancreas. D5, yeast-fermented dough; D7, wheat sourdough. Each letter indicates groups with statistical difference (p < 0.05, a vs. b) using triplicates and one-way analysis of variance (ANOVA) with Tukey’s honest significance test (HSD).
Figure 4
Figure 4
Free thiol groups in the albumin/globulin extracts of doughs. The number indicates the dough systems described in Figure 1. Dough 1, yeast-fermented dough at 30 °C for 1 h; 2, yeast-fermented dough at 30 °C for 17 h; 3, yeast-fermented dough at 4 °C for 17 h; 4, yeast-fermented dough with glutathione at 30 °C for 1 h; 5, yeast-fermented dough with glutathione at 30 °C for 17 h; 6, chemically acidified dough, pH 3.5, at 30 °C for 17 h; 7, wheat sourdough at 30 °C for 17 h; 8, chemically acidified dough, pH 3.5, with glutathione at 30 °C for 17 h; F, wheat flour. Bars that do not share a common superscript differ significantly (p < 0.05, one-way ANOVA with Tukey’s honest significance test (HSD) analysis).
Figure 5
Figure 5
Identification of isolated ATI tetramers. SDS-PAGE of ATI tetramer isolates in the presence of 2% (m/v) dithiothreitol. (1) Molecular weight standard, (2) Commercial Sigma ATI control, containing mainly monomeric and dimeric ATI 0.19, 0.28, and 0.53 [14], and (3) ATI tetramer isolate. Size-exclusion chromatogram of ATI tetramer isolate (line) and Sigma ATI (broken line). Elution volume of molecular standard bovine serum albumin 66 kDa (8.6 mL), chymotrypsinogen 25.6 kDa (9.9 mL), and lysozyme 14 kDa (11.4 mL). As determined by mass spectrometry, Band 1 consists of the ATI tetramer CM3 subunit and Band 2 of the ATI tetramer CM2 subunit.
Figure 6
Figure 6
Size-exclusion chromatogram of fluorescein-labelled ATI in bread-making. Panel (A): Yeast-fermented bread, Panel (B): (III) chemically acidified dough at pH 5.0, Panel (C): (V) Rye starter-wheat sourdough. Fluorescence-labelled ATI was added to bread dough Panel (A) or to sourdough Panels (B,C). ATI was extracted after mixing of sourdough, after sourdough fermentation, or after mixing of bread dough, after proofing, and after baking. FITC-labelled ATI was separated by size exclusion chromatography coupled to a fluorescent detector set at excitation 488 nm and emission 530 nm. Chromatograms were normalized to the highest peak intensity in each chromatogram and were offset by 0.4 RFU. The elution volume of the molecular marker bovine serum albumin (66 kDa) was 7.25 mL, of lysozyme (14 kDa) was 9.86 mL, and of glutathione (307 Da) was 17.35 mL. The Roman number and the sample letters are the same as those indicated in Table 1.
Figure 7
Figure 7
ATI bioactivity of whole wheat fermented by four Lactobacillus strains ATI were extracted from freeze-dried doughs, and extracts added to toll-like receptor 4 (TLR4) expressing THP-1 human monocytic cells. The release of monocyte chemoattractant protein-1 (MCP-1) and tumour necrosis factor alpha (TNF-α) into the culture medium was quantified by enzyme-linked immunosorbent assay (ELISA). (* p < 0.05; ** p < 0.01; *** p < 0.001).

References

    1. Tatham A.S., Shewry P.R. Allergy to wheat and related cereals. Clin. Exp. Allergy. 2008;38:1712–1726. doi: 10.1111/j.1365-2222.2008.03101.x. - DOI - PubMed
    1. Schuppan D., Pickert G., Ashfaq-Khan M., Zevallos V. Non-celiac wheat sensitivity: Differential diagnosis, triggers and implications. Best Pract. Res. Clin. Gastroenterol. 2015;29:469–476. doi: 10.1016/j.bpg.2015.04.002. - DOI - PubMed
    1. Catassi C., Alaedini A., Bojarski C., Bonaz B., Bouma G., Carroccio A., Castillejo G., De Magistris L., Dieterich W., Di Liberto D., et al. The Overlapping Area of Non-Celiac Gluten Sensitivity (NCGS) and Wheat-Sensitive Irritable Bowel Syndrome (IBS): An Update. Nutrients. 2017;9:1268. doi: 10.3390/nu9111268. - DOI - PMC - PubMed
    1. Fritscher-Ravens A., Schuppan D., Ellrichmann M., Schoch S., Röcken C., Brasch J., Bethge J., Böttner M., Klose J., Milla P.J. Confocal Endomicroscopy Shows Food-Associated Changes in the Intestinal Mucosa of Patients With Irritable Bowel Syndrome. Gastroenterology. 2014;147:1012–1020.e4. doi: 10.1053/j.gastro.2014.07.046. - DOI - PubMed
    1. Fritscher-Ravens A., Pflaum T., Mösinger M., Ruchay Z., Röcken C., Milla P.J., Das M., Böttner M., Wedel T., Schuppan D. Many Patients With Irritable Bowel Syndrome Have Atypical Food Allergies Not Associated With Immunoglobulin E. Gastroenterology. 2019;157:109–118.e5. doi: 10.1053/j.gastro.2019.03.046. - DOI - PubMed