. 2020 Jul 17;21(14):5042.
doi: 10.3390/ijms21145042.

Transglutaminase 2-Mediated p53 Depletion Promotes Angiogenesis by Increasing HIF-1α-p300 Binding in Renal Cell Carcinoma

Affiliations

Transglutaminase 2-Mediated p53 Depletion Promotes Angiogenesis by Increasing HIF-1α-p300 Binding in Renal Cell Carcinoma

Seon-Hyeong Lee et al. Int J Mol Sci. .

Abstract

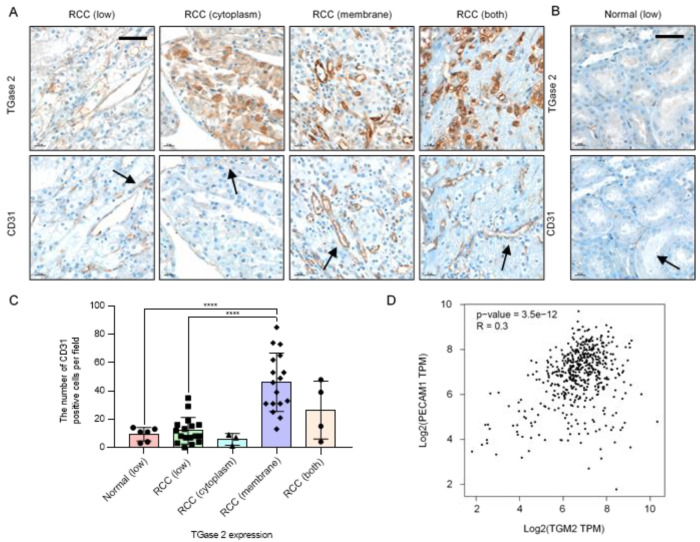
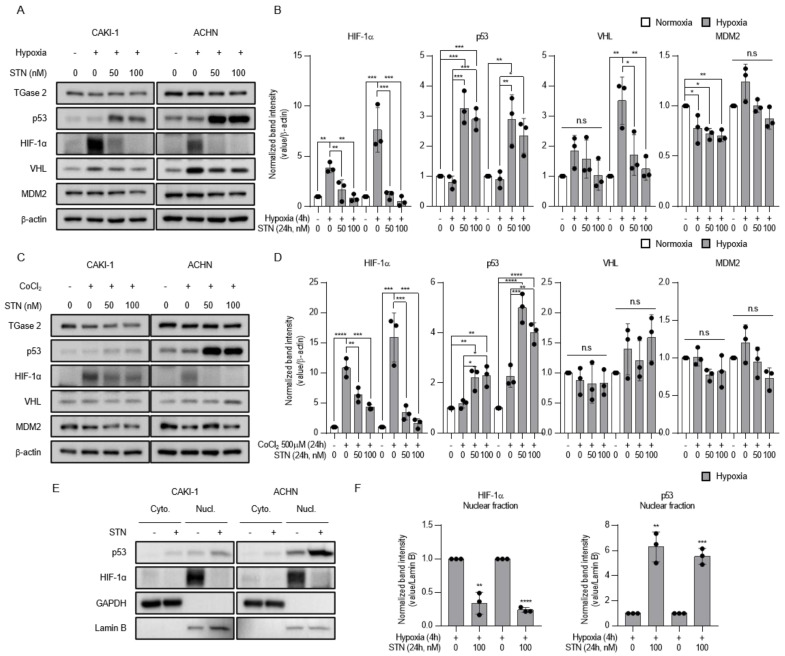
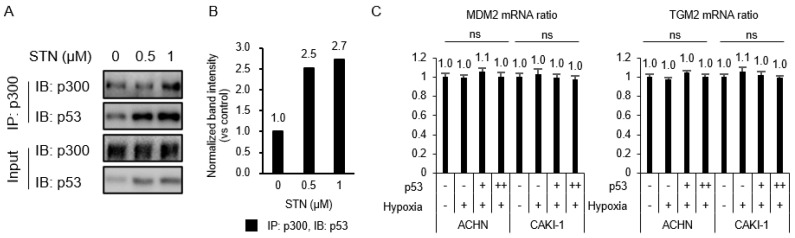
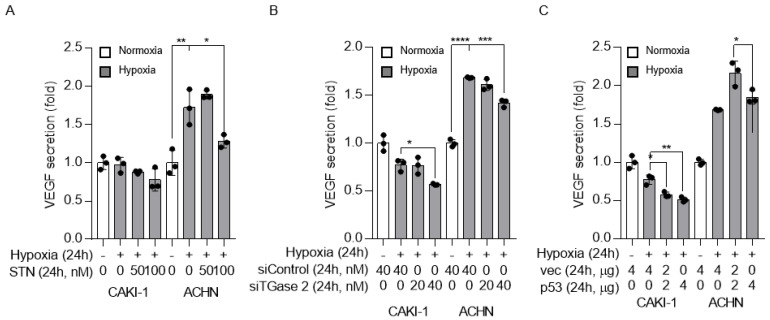
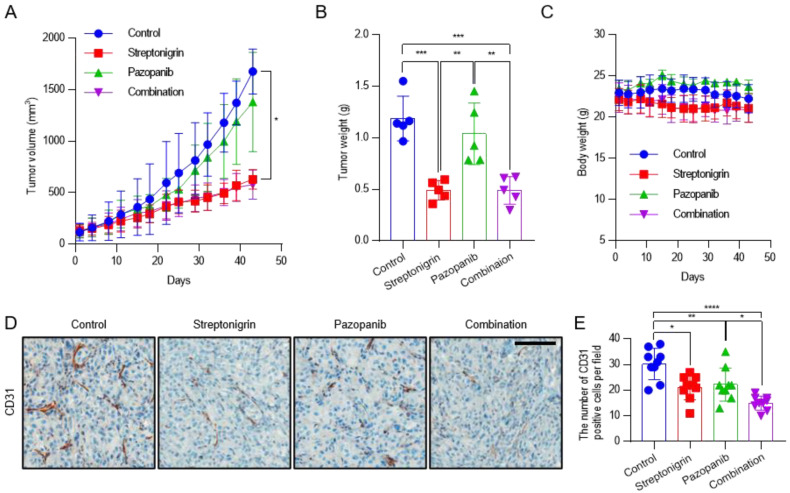
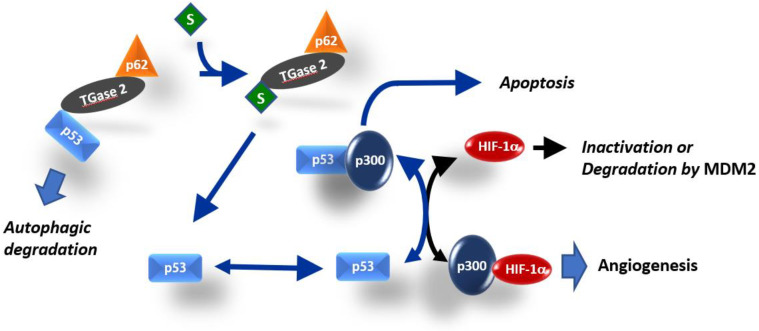
Angiogenesis and the expression of vascular endothelial growth factor (VEGF) are increased in renal cell carcinoma (RCC). Transglutaminase 2 (TGase 2), which promotes angiogenesis in endothelial cells during wound healing, is upregulated in RCC. Tumor angiogenesis involves three domains: cancer cells, the extracellular matrix, and endothelial cells. TGase 2 stabilizes VEGF in the extracellular matrix and promotes VEGFR-2 nuclear translocation in endothelial cells. However, the role of TGase 2 in angiogenesis in the cancer cell domain remains unclear. Hypoxia-inducible factor (HIF)-1α-mediated VEGF production underlies the induction of angiogenesis in cancer cells. In this study, we show that p53 downregulated HIF-1α in RCC, and p53 overexpression decreased VEGF production. Increased TGase 2 promoted angiogenesis by inducing p53 degradation, leading to the activation of HIF-1α. The interaction of HIF-1α and p53 with the cofactor p300 is required for stable transcriptional activation. We found that TGase 2-mediated p53 depletion increased the availability of p300 for HIF-1α-p300 binding. A preclinical xenograft model suggested that TGase 2 inhibition can reverse angiogenesis in RCC.

Keywords: HIF-1α; angiogenesis; p53; renal cell carcinoma; transglutaminase 2.


Conflict of interest statement

The authors declare no conflict of interest.

Figures

Figure 1
Figure 1
Increased expression of transglutaminase 2 (TGase 2) is associated with increased CD31. (A) Representative images of TGase 2 and CD31 (black arrows) staining in a human clear cell renal cell carcinoma (RCC) tissue microarray. (B) Representative images of TGase 2 and CD31 (black arrows) staining in human normal kidney tissue. TGase 2 expression was divided into low, high cytoplasm, high cytoplasmic membrane, and both high cytoplasm and cytoplasmic membrane, according to the staining results. (C) Average number of CD31-positive cells in the human normal kidney with low TGase 2 expression (n = 6), human RCC with low TGase 2 expression (n = 17), RCC with high TGase 2 expression in the cytoplasm (n = 3), RCC with high TGase 2 expression in the cytoplasmic membrane (n = 17), and RCC with high TGase 2 expression in both the cytoplasm and the cytoplasmic membrane (n = 4). (D) Correlation analysis of genes was conducting using the GEPIA tool. Expressions of TGM2 (TGase 2 gene) and PECAM1 (CD31 gene) were positively correlated (p-value = 3.5e-12, R = 0.3). TPM; transcripts per million reads. Error bars represent SD. GraphPad Prism software was used to perform one-way ANOVA, **** p < 0.0001. Scale bar = 50 μm.
Figure 2
Figure 2
TGase 2 inhibition induces p53-dependent inhibition of hypoxia-inducible factor (HIF)-1α in hypoxia. (A) Cells were treated with STN (streptonigrin, TGase 2 inhibitor) for 24 h and incubated for 4h in hypoxia (1% O2). (B) The image J analysis of Western blotting of Figure 2A. (C) Cells were treated with STN and CoCl2 (cobalt chloride, 500 μM) and incubated for 24 h in normoxia. Whole cell lysates were subjected to the immunoblotting with indicated antibodies. β-actin was used as a loading control. (D) The image J analysis of Western blotting of Figure 2C. (E) Cells were treated with or without STN (100 nM) for 24 h and incubated for 4 h in hypoxia (1% O2). GAPDH was used as a cytosolic fraction loading control and Lamin B was used as a nuclear fraction loading control. (F) The image J analysis of Western blotting of Figure 2E. Densitometry of proteins in nuclear fraction is used to normalize the Lamin B. Error bar represents SD. GraphPad Prism software used to perform one-way ANOVA or t-test, * p < 0.05, ** p < 0.01, *** p < 0.001, **** p < 0.0001. ns = not significant. Data are representative of three independent experiments.
Figure 3
Figure 3
p53–HIF-1α complex is inhibited by TGase 2 inhibition in hypoxia. (A) ACHN cells were treated with STN for 2 h and incubated for 4 h in hypoxia (1% O2). The proteins were immunoprecipitated from cell extracts using an anti-p300 antibody and subjected to immunoblotting. (B) The image J analysis of Western blotting of Figure 3A. (C) Cells were transfected with 3xFLAG p53 (p53 overexpression vector; 0, 2, 4 μg) for 8 h and incubated for 4 h in hypoxia. The total RNAs were isolated from cells and RT-PCRs against mouse double minute 2 homolog (MDM2), TGM2, and GAPDH were performed as described in the method. GAPDH was used as an internal control for the RT-PCR system. Error bar represents SD. GraphPad Prism software used to perform one-way ANOVA, ns = not significant. Data are representative of three independent experiments.
Figure 4
Figure 4
TGase 2 inhibition and p53 overexpression decrease vascular endothelial growth factor (VEGF) secretion under hypoxia. (A) VEGF (pg/mL) secretion into the cell culture supernatant was assessed by ELISA. Cells were treated with STN and incubated in serum-free medium under hypoxia (1% O2) for 24 h. (B) Cells were transfected with control or TGase 2 siRNA and incubated in serum-free medium under hypoxia (1% O2) for 24 h. VEGF levels were determined by ELISA. (C) Cells were transfected with plasmid encoding wild-type p53 cDNA and incubated in serum-free medium under hypoxia (1% O2) for 24 h. VEGF levels were determined by ELISA. The secreted VEGF amount (absorbance) is used to normalize the sulforhodamine B assay (absorbance). Sulforhodamine B assay in cell culture to investigate cell proliferation. Error bar represents SD. GraphPad Prism software used to perform one-way ANOVA, ** p < 0.01, *** p < 0.001, **** p < 0.0001. Data are representative of three independent experiments.
Figure 5
Figure 5
Antitumor activity of pazopanib in combination with TGase 2 inhibition against a CAKI-1 xenograft mouse model. After the subcutaneous injection of CAKI-1 cells (5 × 10⁶ cells), mice were randomized into four groups (n = 5) and were treated with vehicle (control), streptonigrin (0.1 mg/kg), or pazopanib (100 mg/kg) as single agents or in combination. Drugs were administered 3 times a week every other day. (A) Tumor growth curves during the treatment period. Each point is the mean tumor volume in the group. (B) Tumors were isolated from the mice and weighed. (C) Body weights of mice during the treatment period. Each point is the mean weight of mice in each group. (D) Representative areas of CD31 IHC staining slides in CAKI-1 tumor xenograft from mice. (E) Average number of CD31-positive cells in CAKI-1 tumor xenograft from mice (n = 9). Error bar represent SD. GraphPad Prism software used to perform one-way or two-way ANOVA, * p < 0.05, ** p < 0.01, *** p < 0.001, **** p < 0.0001. Scale bar = 100 μm.
Figure 6
Figure 6
Simplified model for the role of TGase 2 in HIF-1α activation. HIF-1α and p53 both require interaction with the transcriptional co-activator p300 for stable transcriptional activity. Interference of each protein with the transcriptional activity of the other is related to the availability of p300 [18,19]. TGase 2-mediated p53 depletion induces angiogenesis by promoting the HIF-1α–p300 interaction in RCC. The TGase 2 inhibition-mediated increase in apoptosis was attributed to increased p53–p300 binding.

References

    1. Mancilla-Jimenez R., Stanley R.J., Blath R.A. Papillary renal cell carcinoma: A clinical, radiologic, and pathologic study of 34 cases. Cancer. 1976;38:2469–2480. doi: 10.1002/1097-0142(197612)38:6<2469::AID-CNCR2820380636>3.0.CO;2-R. - DOI - PubMed
    1. Folkman J., Klagsbrun M. Angiogenic factors. Science. 1987;235:442–447. doi: 10.1126/science.2432664. - DOI - PubMed
    1. Takahashi A., Sasaki H., Kim S.J., Tobisu K., Kakizoe T., Tsukamoto T., Kumamoto Y., Sugimura T., Terada M. Markedly increased amounts of messenger RNAs for vascular endothelial growth factor and placenta growth factor in renal cell carcinoma associated with angiogenesis. Cancer Res. 1994;54:4233–4237. - PubMed
    1. Nicol D., Hii S.I., Walsh M., Teh B., Thompson L., Kennett C., Gotley D. Vascular endothelial growth factor expression is increased in renal cell carcinoma. J. Urol. 1997;157:1482–1486. doi: 10.1016/S0022-5347(01)65028-6. - DOI - PubMed
    1. Park M.J., Baek H.W., Rhee Y.Y., Lee C., Park J.W., Kim H.W., Moon K.C. Transglutaminase 2 expression and its prognostic significance in clear cell renal cell carcinoma. J. Pathol. Transl. Med. 2015;49:37–43. doi: 10.4132/jptm.2014.10.25. - DOI - PMC - PubMed

MeSH terms

Substances