. 2020 Jul 17;12(7):1939.
doi: 10.3390/cancers12071939.

Characterisation of Ovarian Cancer Cell Line NIH-OVCAR3 and Implications of Genomic, Transcriptomic, Proteomic and Functional DNA Damage Response Biomarkers for Therapeutic Targeting

Affiliations

Characterisation of Ovarian Cancer Cell Line NIH-OVCAR3 and Implications of Genomic, Transcriptomic, Proteomic and Functional DNA Damage Response Biomarkers for Therapeutic Targeting

Alice Bradbury et al. Cancers (Basel). .

Abstract

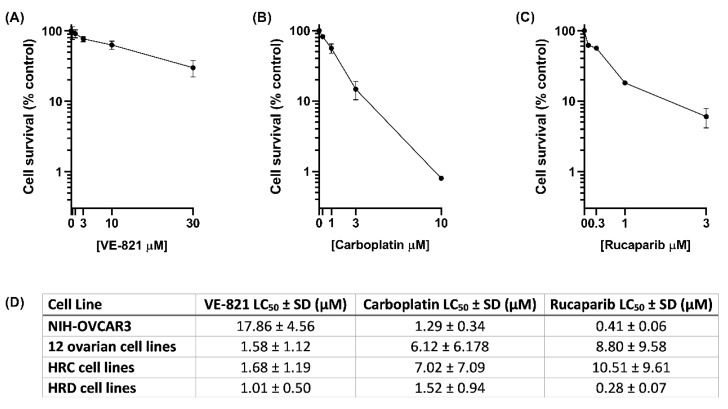
In order to be effective models to identify biomarkers of chemotherapy response, cancer cell lines require thorough characterization. In this study, we characterised the widely used high grade serous ovarian cancer (HGSOC) cell line NIH-OVCAR3 using bioinformatics, cytotoxicity assays and molecular/functional analyses of DNA damage response (DDR) pathways in comparison to an ovarian cancer cell line panel. Bioinformatic analysis confirmed the HGSOC-like features of NIH-OVCAR3, including low mutation frequency, TP53 loss and high copy number alteration frequency similar to 201 HGSOCs analysed (TCGA). Cytotoxicity assays were performed for the standard of care chemotherapy, carboplatin, and DDR targeting drugs: rucaparib (a PARP inhibitor) and VE-821 (an ATR inhibitor). Interestingly, NIH-OVCAR3 cells showed sensitivity to carboplatin and rucaparib which was explained by functional loss of homologous recombination repair (HRR) identified by plasmid re-joining assay, despite the ability to form RAD51 foci and absence of mutations in HRR genes. NIH-OVCAR3 cells also showed high non-homologous end joining activity, which may contribute to HRR loss and along with genomic amplification in ATR and TOPBP1, could explain the resistance to VE-821. In summary, NIH-OVCAR3 cells highlight the complexity of HGSOCs and that genomic or functional characterization alone might not be enough to predict/explain chemotherapy response.

Keywords: ATR; PARP; homologous recombination repair; non-homologous end-joining; ovarian cancer; platinum.


Conflict of interest statement

N.J.C. has contributed to the development of rucaparib and has had research funding from Agouron Pharmacurticals, Pfizer and Clovis. By virtue of the two active patents and an original agreement between Cancer Research Technology, Newcastle University and Agouron she is in receipt of royalty payments, which she does not take personally, in the past they have contributed to her research accounts and a recent large sum has been used to set up a charitable fund within the local Community Foundation.

Figures

Figure 1
Figure 1
Confirmation of the NIH-OVCAR3 cells as representative of HGSOC. (A) Mutation and copy number alteration data from the CCLE database was analysed. Mutations were categorised as homozygous (red) or heterozygous (blue) using a variant allele frequency cut-off of 0.8, mutations with variant allele frequency >0.8 were considered homozygous. The copy number alterations were categorised using their GISTIC scores of −2 or 2 (amplifications: GISTIC score of 2 (orange) and deletions: GISTIC score of −2 (purple). (B) RNA-seq read counts of 2426 genes from the CCLE database were correlated with the read counts for the same 2426 genes established from targeted RNA-sequencing to confirm authenticity of the NIH-OVCAR3 cells in our possession.
Figure 2
Figure 2
Sensitivity of NIH-OVCAR3 cells to VE-821, carboplatin and rucaparib. NIH-OVCAR3 cells were exposed to (A) VE-821 for 48 h, (B) carboplatin for 24 h or (C) rucaparib for 24 h. Media was replaced with drug free media for 21 days to allow colony formation. Data are the mean and standard deviation of at least three independent experiments. (D) Sensitivity of an additional 12 ovarian cancer cell lines to the three drugs was calculated in the same way and LC50 values were calculated. Sensitivity of NIH-OVCAR3 cells in comparison to the mean of 12 other ovarian cancer cell lines, and the cell lines grouped by their HRR status into HRR competent (HRC, 3 cell lines) or HRR defective (HRD, 2 cell lines). Data are pooled from 3 independent experiments per cell line. Western blot confirming the loss of TP53 function in NIH-OVCAR3 cells can be found at Figure S3.
Figure 3
Figure 3
Inhibition of ATR by VE-821 and the expression of potential determinants of sensitivity and resistance to VE-821 in the NIH-OVCAR3 cells. (A) NIH-OVCAR3 cells and 9 other ovarian cancer cell lines were exposed to 4NQO ± VE-821 as indicated for 1 hr before western blotting. Chemiluminescence was quantified using Syngene software and expression of pCHK1Ser345 was normalised to vinculin expression. Western blot image is from a single representative experiment with pooled data from 3 independent experiments per cell line used to calculate the mean VE-821 IC50 and percentage inhibition at 1 µM VE-821. (B) Bar chart represents log-transformed read counts obtained from RNA-Seq data for each gene normalized to ACTB mRNA expression for NIH-OVCAR3 cells (black bars) and the mean mRNA expression of each gene across 12 cell lines (white bars) where each black dot represents one cell line. (C) Bar chart represents protein expression normalised to Ponceau-s staining calculated using ImageJ software in NIH-OVCAR3 cells (black bars) and the mean protein expression of each gene across 12 cell lines (white bars) where each black dot represents one cell line. Data are from a single experimental repeat. [PRKDC: DNA-PKcs, XRCC5: Ku80, XRCC6: Ku70]. Western blot of ATR activation and inhibition by 4NQO ± VE-821 in NIH-OVCAR3 cells can be found at Figure S4. Western blot of baseline protein expression in panel of ovarian cancer cell lines can be found at Figure S5.
Figure 4
Figure 4
Assessment of HRR and NHEJ in the NIH-OVCAR3 cells. (A) Cells were exposed to 0.5% DMSO (control) or 10 µM rucaparib for 48 h before being fixed and stained as per the protocol outlined in the methods. After imaging, the number of γH2AX and RAD51 foci per nucleus was calculated using ImageJ software, data points represent number of foci in an individual nucleus. The fold change in number of foci per nuclei between control and 10 µM rucaparib was then calculated. (B) Cells were co-transfected with pDRGFP and pCBASceI plasmids and analysed for the presence of GFP-positive cells 48 h post-transfection. % HRR activity was calculated by normalizing to the untransfected control. Graph shows mean of 2 individual experiments. (C) Cells were co-transfected with pimEJ5GFP and pCBASceI plasmids and analysed for the presence of GFP-positive cells 48 h post-transfection. % NHEJ activity was calculated by normalizing to the untransfected control. Graph shows mean of two individual experiments. [* p < 0.05; ** p < 0.005; **** p < 0.0001 (unpaired t-test)].
Figure 5
Figure 5
Distribution of genomic and transcriptomic alterations of select DDR genes among 201 HGSOCs. Alteration frequencies of TP53 and DDR genes with amplification and deep deletion in NIH-OVCAR3 cell lines and additional DDR genes analysed as likely determinants of ATRi resistance in NIH-OVCAR3 cell line. Figure generated using cBioPortal (https://www.cbioportal.org/).

References

    1. Hanahan D., Weinberg R.A. Hallmarks of Cancer: The Next Generation. Cell. 2011;144:646–674. doi: 10.1016/j.cell.2011.02.013. - DOI - PubMed
    1. Curtin N.J. DNA repair dysregulation from cancer driver to therapeutic target. Nat. Rev. Cancer. 2012;12:801–817. doi: 10.1038/nrc3399. - DOI - PubMed
    1. Sachdev E., Tabatabai R., Roy V., Rimel B.J., Mita M.M. PARP Inhibition in Cancer: An Update on Clinical Development. Target. Oncol. 2019;14:657–679. doi: 10.1007/s11523-019-00680-2. - DOI - PubMed
    1. Cancer Genome Atlas Research Network Integrated genomic analyses of ovarian carcinoma. Nature. 2011;474:609–615. doi: 10.1038/nature10166. - DOI - PMC - PubMed
    1. Bray F., Ferlay J., Soerjomataram I., Siegel R.L., Torre L.A., Jemal A. Global cancer statistics 2018: GLOBOCAN estimates of incidence and mortality worldwide for 36 cancers in 185 countries. CA Cancer J. Clin. 2018;68:394–424. doi: 10.3322/caac.21492. - DOI - PubMed