. 2020 Jul 24;8(1):111.
doi: 10.1186/s40168-020-00885-y.

Catabolism and interactions of uncultured organisms shaped by eco-thermodynamics in methanogenic bioprocesses

Affiliations

Catabolism and interactions of uncultured organisms shaped by eco-thermodynamics in methanogenic bioprocesses

Masaru K Nobu et al. Microbiome. .

Abstract

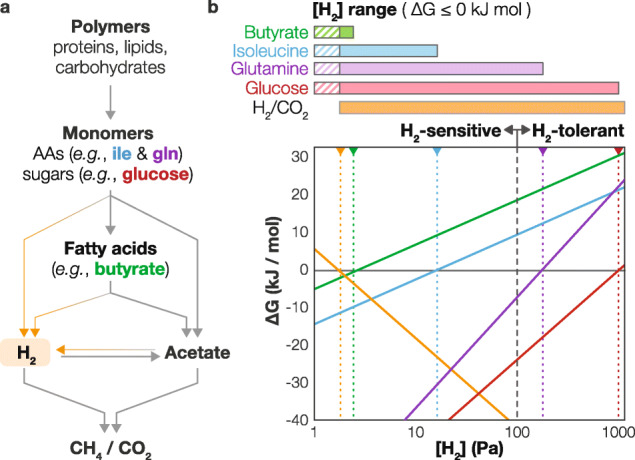
Background: Current understanding of the carbon cycle in methanogenic environments involves trophic interactions such as interspecies H2 transfer between organotrophs and methanogens. However, many metabolic processes are thermodynamically sensitive to H2 accumulation and can be inhibited by H2 produced from co-occurring metabolisms. Strategies for driving thermodynamically competing metabolisms in methanogenic environments remain unexplored.

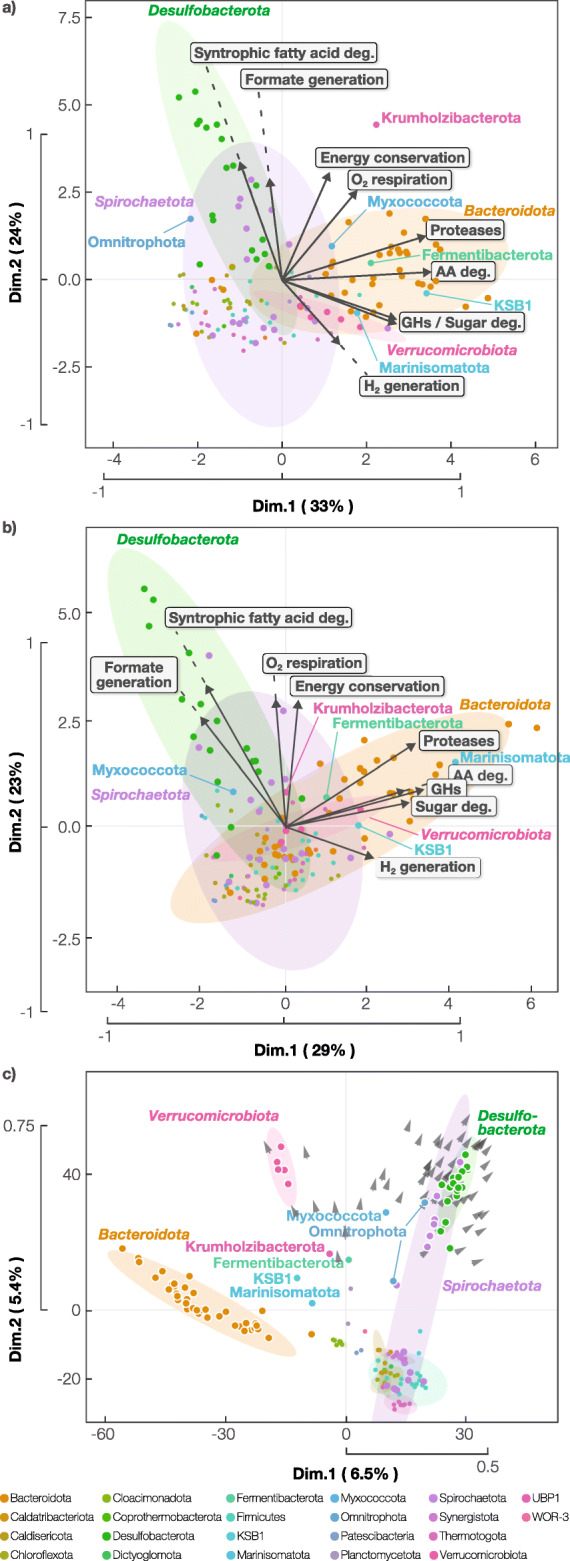
Results: To uncover how anaerobes combat this H2 conflict in situ, we employ metagenomics and metatranscriptomics to revisit a model ecosystem that has inspired many foundational discoveries in anaerobic ecology-methanogenic bioreactors. Through analysis of 17 anaerobic digesters, we recovered 1343 high-quality metagenome-assembled genomes and corresponding gene expression profiles for uncultured lineages spanning 66 phyla and reconstructed their metabolic capacities. We discovered that diverse uncultured populations can drive H2-sensitive metabolisms through (i) metabolic coupling with concurrent H2-tolerant catabolism, (ii) forgoing H2 generation in favor of interspecies transfer of formate and electrons (cytochrome- and pili-mediated) to avoid thermodynamic conflict, and (iii) integration of low-concentration O2 metabolism as an ancillary thermodynamics-enhancing electron sink. Archaeal populations support these processes through unique methanogenic metabolisms-highly favorable H2 oxidation driven by methyl-reducing methanogenesis and tripartite uptake of formate, electrons, and acetate.

Conclusion: Integration of omics and eco-thermodynamics revealed overlooked behavior and interactions of uncultured organisms, including coupling favorable and unfavorable metabolisms, shifting from H2 to formate transfer, respiring low-concentration O2, performing direct interspecies electron transfer, and interacting with high H2-affinity methanogenesis. These findings shed light on how microorganisms overcome a critical obstacle in methanogenic carbon cycles we had hitherto disregarded and provide foundational insight into anaerobic microbial ecology. Video Abstract.

Keywords: Catabolism; Eco-thermodynamics; Interactions; Methanogenic bioprocesses; Uncultured organisms.


Conflict of interest statement

The authors declare that they have no competing interests.

Figures

Fig. 1
Fig. 1
General scheme of methanogenic organic compound degradation and the “H2 conflict.” a Scheme for the degradation of organic macromolecules and the major intermediates, including AAs (blue or purple [see below]), sugars (red), FAs (green), and H2 (orange). b Gibbs free energy change for the degradation of representative AAs with low (isoleucine; blue) and high (glutamine; purple) calculated H2 tolerance, sugar (glucose), and fatty acid (FA) (butyrate) and H2-oxidizing CO2-reducing methanogenesis with varying H2 partial pressures. The vertical dotted lines indicate each pathway’s threshold H2 concentration at which ∆G becomes 0 kJ/mol. ∆G values are calculated as the ∆Greaction + (mol ATP generated/mol reaction)*∆GATPsynthesis (see details below). The H2 partial pressure range at which each metabolism is thermodynamically favorable is shown at the top (horizontal bars with corresponding colors). Hydrogen partial pressures that overlap with those for H2-oxidizing CO2-reducing methanogenesis are indicated (solid colors) and would be permissive for that reaction. Metabolisms with [H2]max less than 100 Pa and greater than 100 Pa are respectively defined as H2-sensitive and H2-tolerant. The following conditions were used for calculations—10 μM butyrate, 300 μM acetate, 0.1 μM amino acids and sugars, 1 mM NH4+, 50 mM HCO3-, 50 kPa CH4, pH of 7, and 37 °C. ∆GATPsynthesis is assumed to be 60 kJ/mol. For butyrate, isoleucine, glutamine, glucose, and H2/CO2 methanogenesis, ATP yields of 0.33, 1, 1.33, 4.67, and 0.2 were assumed. The ATP yields are calculated as follows: ATPgenerated – ATPconsumedx*(NADHgenerated –NADHconsumed) + x*(FdH2generated – FdH2consumed) – 2x*(ETFH2generated – ETFH2consumed) – 2x*(quinolgenerated – quinolconsumed), where x is the ATP synthase ATP:H+ ratio (assumed to be 1:3 for organotrophy and 1:5 for methanogenesis in this figure). Abbreviations: NADH—reduced nicotinamide adenine dinucleotide; FdH2—reduced ferredoxin; ETF—reduced electron transfer flavoprotein
Fig. 2
Fig. 2
Phylogenetic distribution of MAGs recovered and species (MAG clusters) associated with a high metatranscriptome-based activity. The phylogenetic classification was determined using GTDBtk (left). The number of MAGs associated with a cultured genus or uncultured lineages (at different taxonomic levels) is shown (right). Bacterial and archaeal species respectively associated with metatranscriptome-based activities ≥ 0.4% or ≥ 0.3% of the mapped transcriptomes in at least one reactor are shown
Fig. 3
Fig. 3
Phylum-level overall metabolic activities, the thermodynamics-based H2 thresholds of the activities, and expression of individual pathways. a For each phylum, the number of species clusters, average number of protease, glycosyl hydrolase, and lipase families expressed across species are shown (normalized to maximum observed average among phyla). Likewise, the average number of sugar-, AA-, and FA-degradation pathways expressed across species is shown. AA degradation pathways are split into those that are H2-tolerant (HT) and H2-sensitive (HS) based on panel b. b The maximum H2 concentration that each degradation pathway can tolerate is shown (i.e., ∆Greaction + x*∆GATPsynthesis = 0, where x is the amount of ATP synthesized per substrate degraded). The ATP yield for each pathway was based on the sum of (i) the ATP consumption/generation in the main carbon transformation pathway and (ii) vectorial H+ translocation associated with membrane-based electron transfer (e.g., Rnf, Hyb, Fdn), assuming the shortest electron flow route from substrate oxidation to H2/formate generation that involves electron bifurcation and reverse electron transport where possible; all of this was based on pathways that were observed to be expressed in this study. Reactions that would either lose much energy as heat (e.g., cytosolic Fdred-oxidizing H2 generation) or require energy input under in situ conditions (e.g., cytosolic NADH-oxidizing H2 generation) were not considered. For substrates whose degradation proceeds through pyruvate or acetyl-CoA, maximum H2 concentrations for oxidation to acetate are shown (see Supplementary Table S1 for a list of reactions). Note that fermentation pathways (e.g., acetyl-CoA reduction to butyrate) would increase the maximum H2 but reduce ATP yield. The Gibbs free energy yield at standard conditions and pH 7 (∆G°’) and estimated ATP yields are also shown. See Fig. 1 for details for calculating ATP yield and maximum tolerable H2 concentration. For each pathway, ∆Greaction was calculated assuming 300 μM acetate, 10 μM for other FAs, 1 mM NH4+, 50 kPa CH4, 50 mM HCO3-, 37 °C, 3.9 × 10⁻⁴ atm H2S, and 0.1 μM for all other compounds. ∆GATPsynthesis was assumed to be 60 kJ/mol. *Although more exergonic alternative pathways exist for these HS AA degradation pathways (e.g., through butyrate fermentation), species only expressing the HS pathway(s) were identified in situ, indicating that HS metabolism of these AAs is relevant in situ. 1For isovalerate degradation, an ATP synthase ATP:H+ ratio of 1:4 was assumed. 2For H2-oxidizing CO2-reducing methanogenesis, two H2 concentrations for two ATP yields assuming different ATP synthase ATP:H+ ratios. 3For propionate and acetate degradation, an ATP synthase ATP:H+ ratio of 1:5 was assumed. Pathways whose directionality cannot be determined by sequence data alone. c For each phylum, the percentage of species expressing individual degradation pathways are shown
Fig. 4
Fig. 4
Principal component analysis (PCA) of a metabolic capacities, b expressed pathways, and c individual genes/functions for active species. a PCA of active species and their metabolic capacities: proteases and glycosylhydrolases (GHs) as the number of families encoded in the genome; FA, AA, and sugar degradation as the number of pathways encoded in the genome; electron transfer/energy conservation pathways (i.e., Rnf, Nfn, Fix, Efd, and FloxHdr) as the number of pathways encoded in the genome; H2 and formate generation as presence/absence; and cytochrome bd oxidase-mediated O2 respiration as presence/absence. Individual species (points) and metabolic capacities (vectors) are shown. Confidence ellipses (95%) are shown for MAGs belonging to specific phyla. b PCA of active species and the metabolic behavior they expressed: proteases and glycosylhydrolases (GHs) as the number of families expressed in at least one reactor; FA, AA, and sugar degradation as the number of complete pathways expressed in at least one reactor; electron transfer/energy conservation pathways (i.e., Rnf, Nfn, Fix, Efd, and FloxHdr) as the number of pathways expressed in at least one reactor; H2 and formate generation as the highest hydrogenase/formatted dehydrogenase subunit expression level (calculated as RPKM normalized to specie’s non-zero median expression level); and cytochrome bd oxidase-mediated O2 respiration as the highest oxidase subunit expression level. Individual species (points) and metabolic capacities (vectors) are shown. c PCA of active species and their functional profiles predicted through eggNOG. Functions that are detected at a significantly higher frequency in Desulfobacterota and Spirochaetota than other phyla (p < 0.05) are shown as vectors. The functions associated with these vectors are shown in Table S16
Fig. 5
Fig. 5
Updated scheme of methanogenic organic matter mineralization. Known and novel metabolic interactions and behaviors are shown (black and orange arrows, respectively). For each ecological niche, representative phyla and total number of species (number) associated with these phyla are shown. Ecological niches involving lineages uncultured at the family level or higher are indicated (bold with a gray background). Cascading degradation of polymers to monomers (sugars—red, H2 tolerant AAs—purple, H2 sensitive AAs—blue) generates metabolic intermediates whose degradation is H2-tolerant or H2-independent (black) and H2-sensitive (green letters). Novel electron transfer and syntrophic interactions involve formate as a key intermediate (green background) and DIET-mediated electric interactions (yellow arrows facing outward for electrogens and yellow arrows facing inward for electron-consuming species). Abbreviations: Bacteroidota (Bactero), Verrucomicrobiota (Verruco), Fermentibacterota (Ferm), Marinisomatota (Marini), Desulfobacterota (Desulfo), Spirochaetota (Spiro), Halobacterota (Halobac), Euryarchaeota (Euryarc), formate (Fo), acetate (Ac), propionate (PR), butyrate (BT), isobutyrate (IB), isovalerate (IV)

References

    1. Buswell AM. Anaerobic fermentations. State of Illinois Department of Registration and Education. 1936;Bulletin No. 32.
    1. Speece RE. Anaerobic biotechnology for industrial wastewaters. Nashville, TN: Archae Press; 1996. - PubMed
    1. Bryant MP, Wolin EA, Wolin MJ, Wolfe RS. Methanobacillus omelianskii, a symbiotic association of two species of bacteria. Archiv fur Mikrobiologie. 1967;59(1):20–31. doi: 10.1007/BF00406313. - DOI - PubMed
    1. Reddy CA, Wolin MJ, Bryant MP. Characteristics of S-Organism isolated from Methanobacillus omelianskii. J Bacteriol. 1972;109(2):539-&. - PMC - PubMed
    1. McInerney MJ, Bryant MP, Pfennig N. Anaerobic bacterium that degrades fatty-acids in syntrophic association with methanogens. Arch Microbiol. 1979;122(2):129–135. doi: 10.1007/bf00411351. - DOI - PubMed

Publication types

LinkOut - more resources