. 2020 Aug;31(8):1762-1780.
doi: 10.1681/ASN.2019111163. Epub 2020 Jul 24.

Podocyte Integrin- β3 and Activated Protein C Coordinately Restrict RhoA Signaling and Ameliorate Diabetic Nephropathy

Affiliations

Podocyte Integrin- β3 and Activated Protein C Coordinately Restrict RhoA Signaling and Ameliorate Diabetic Nephropathy

Thati Madhusudhan et al. J Am Soc Nephrol. 2020 Aug.

Abstract

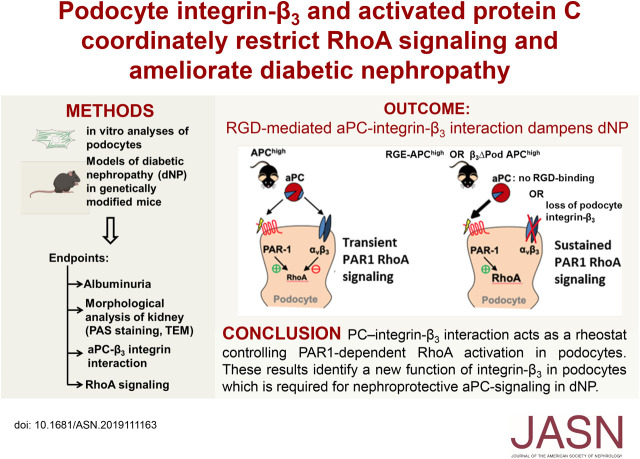
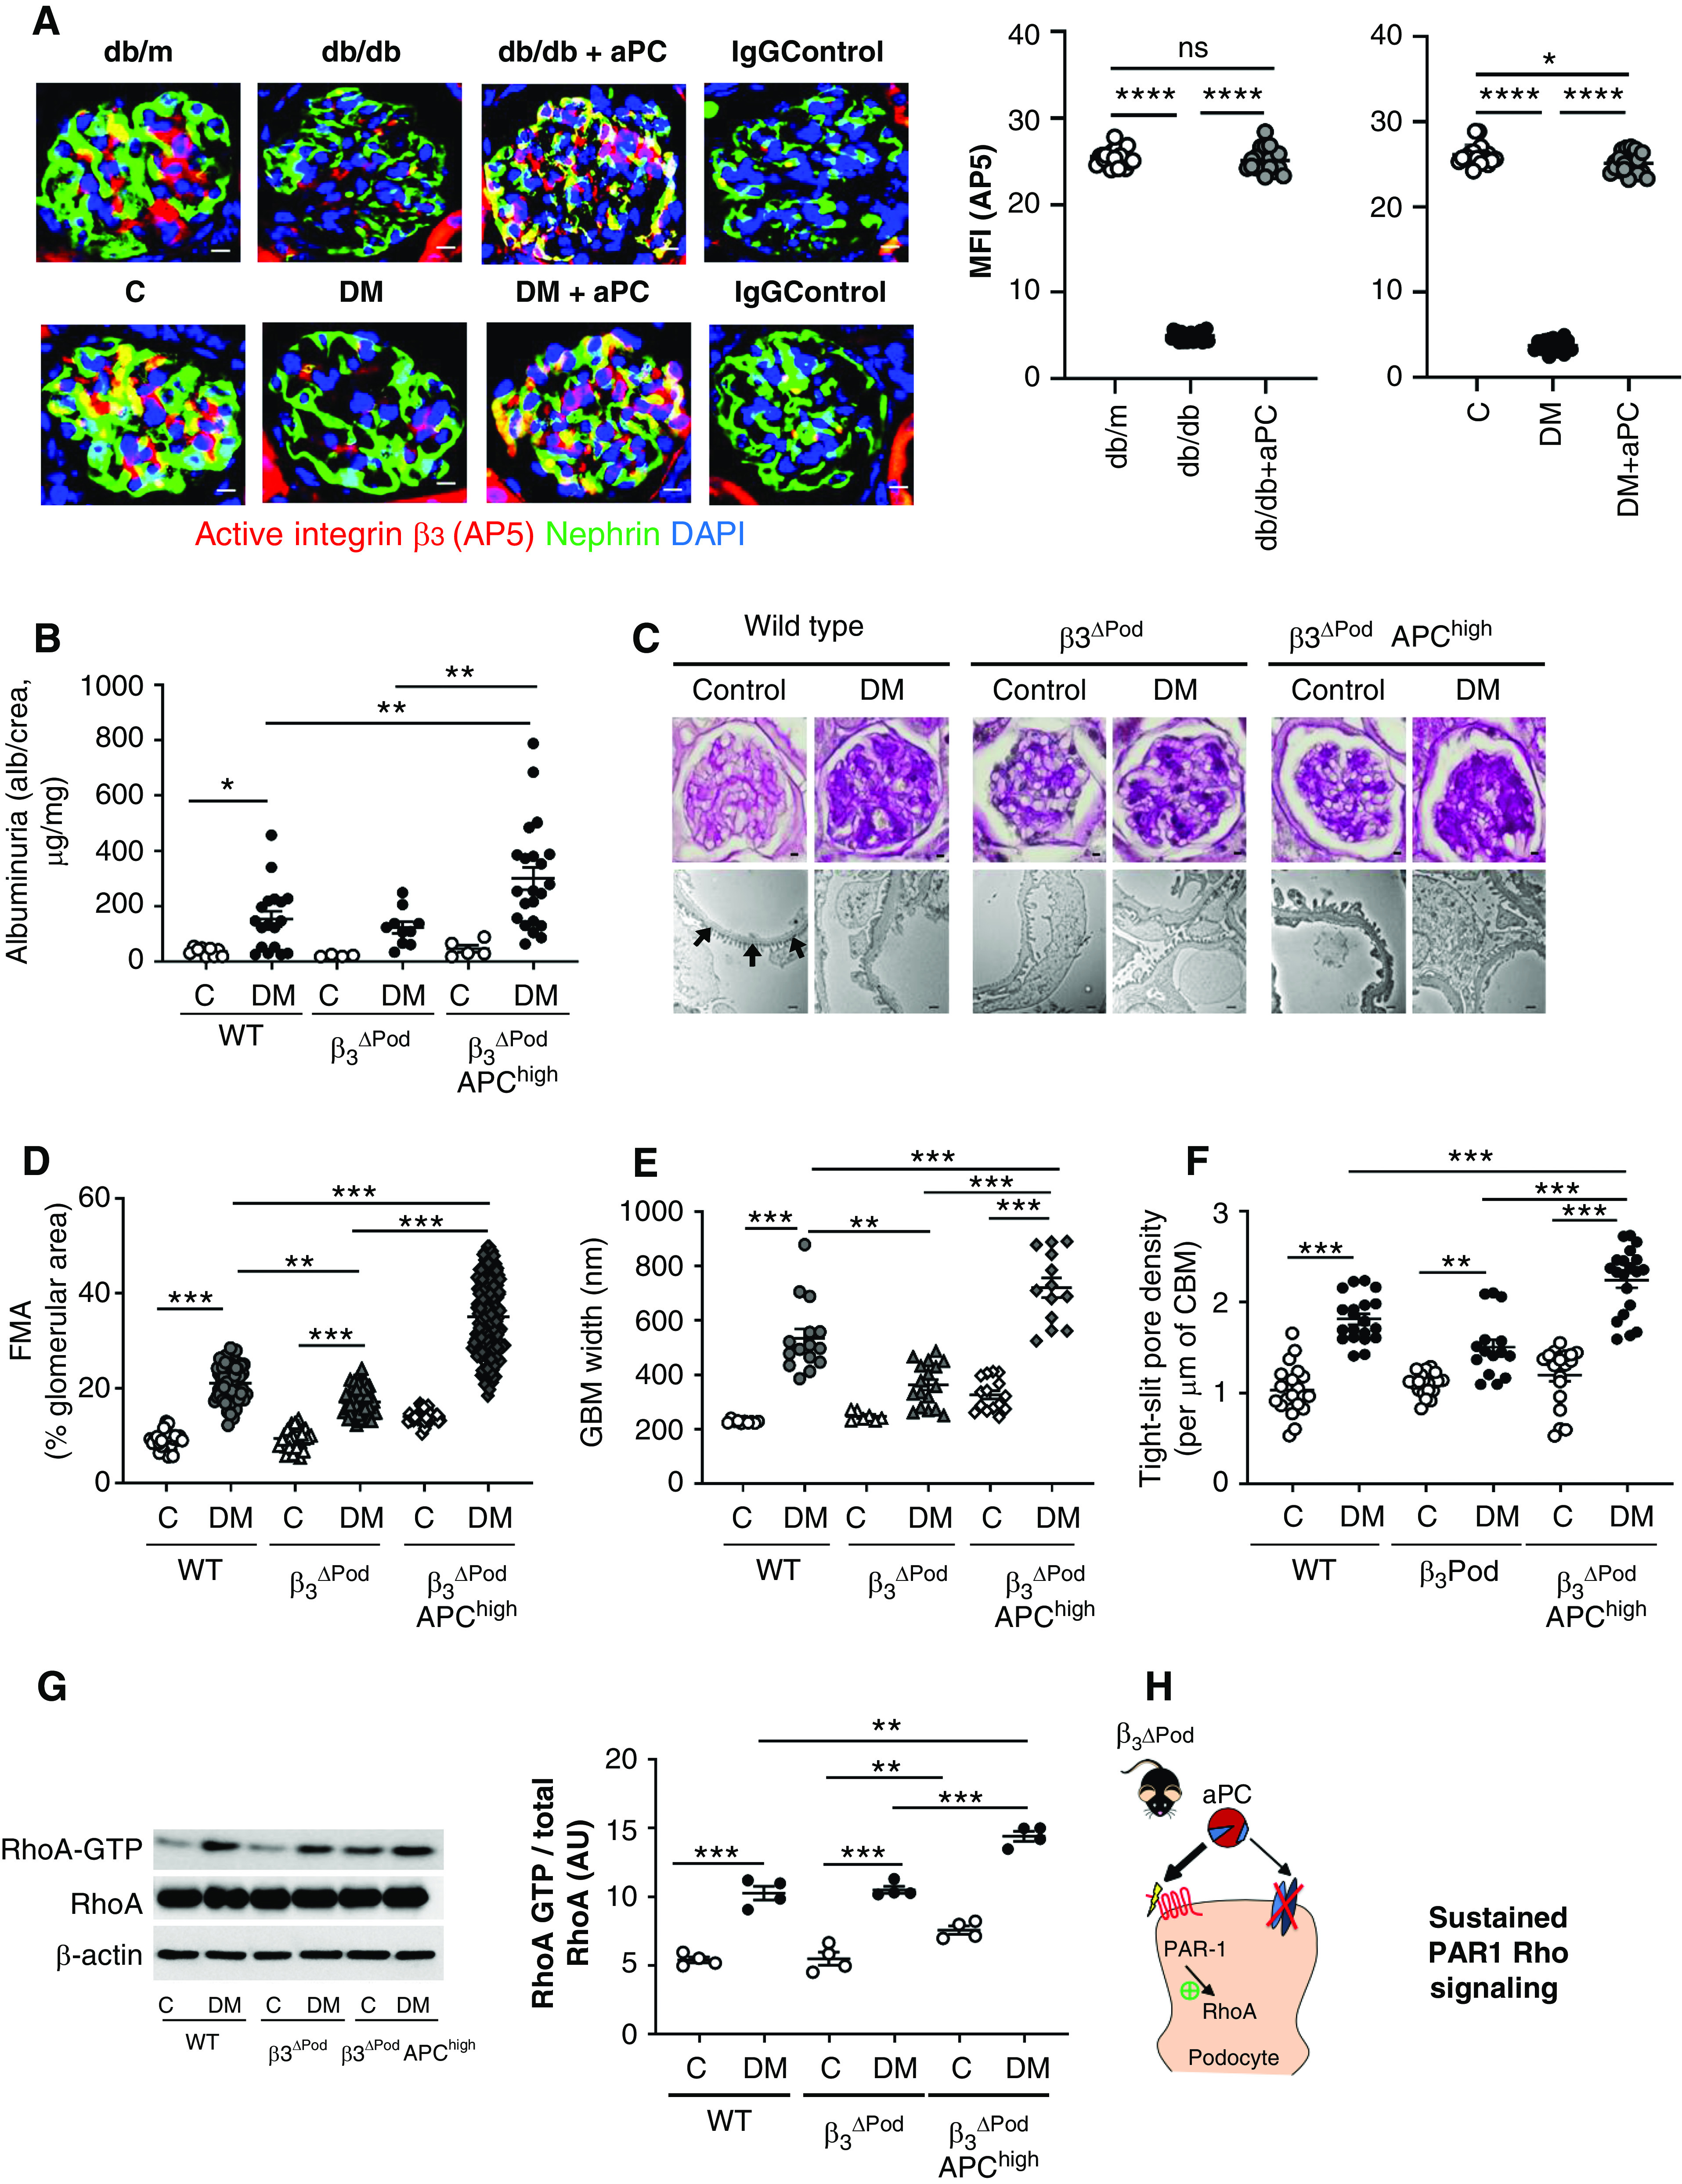
Background: Diabetic nephropathy (dNP), now the leading cause of ESKD, lacks efficient therapies. Coagulation protease-dependent signaling modulates dNP, in part via the G protein-coupled, protease-activated receptors (PARs). Specifically, the cytoprotective protease-activated protein C (aPC) protects from dNP, but the mechanisms are not clear.

Methods: A combination of in vitro approaches and mouse models evaluated the role of aPC-integrin interaction and related signaling in dNP.

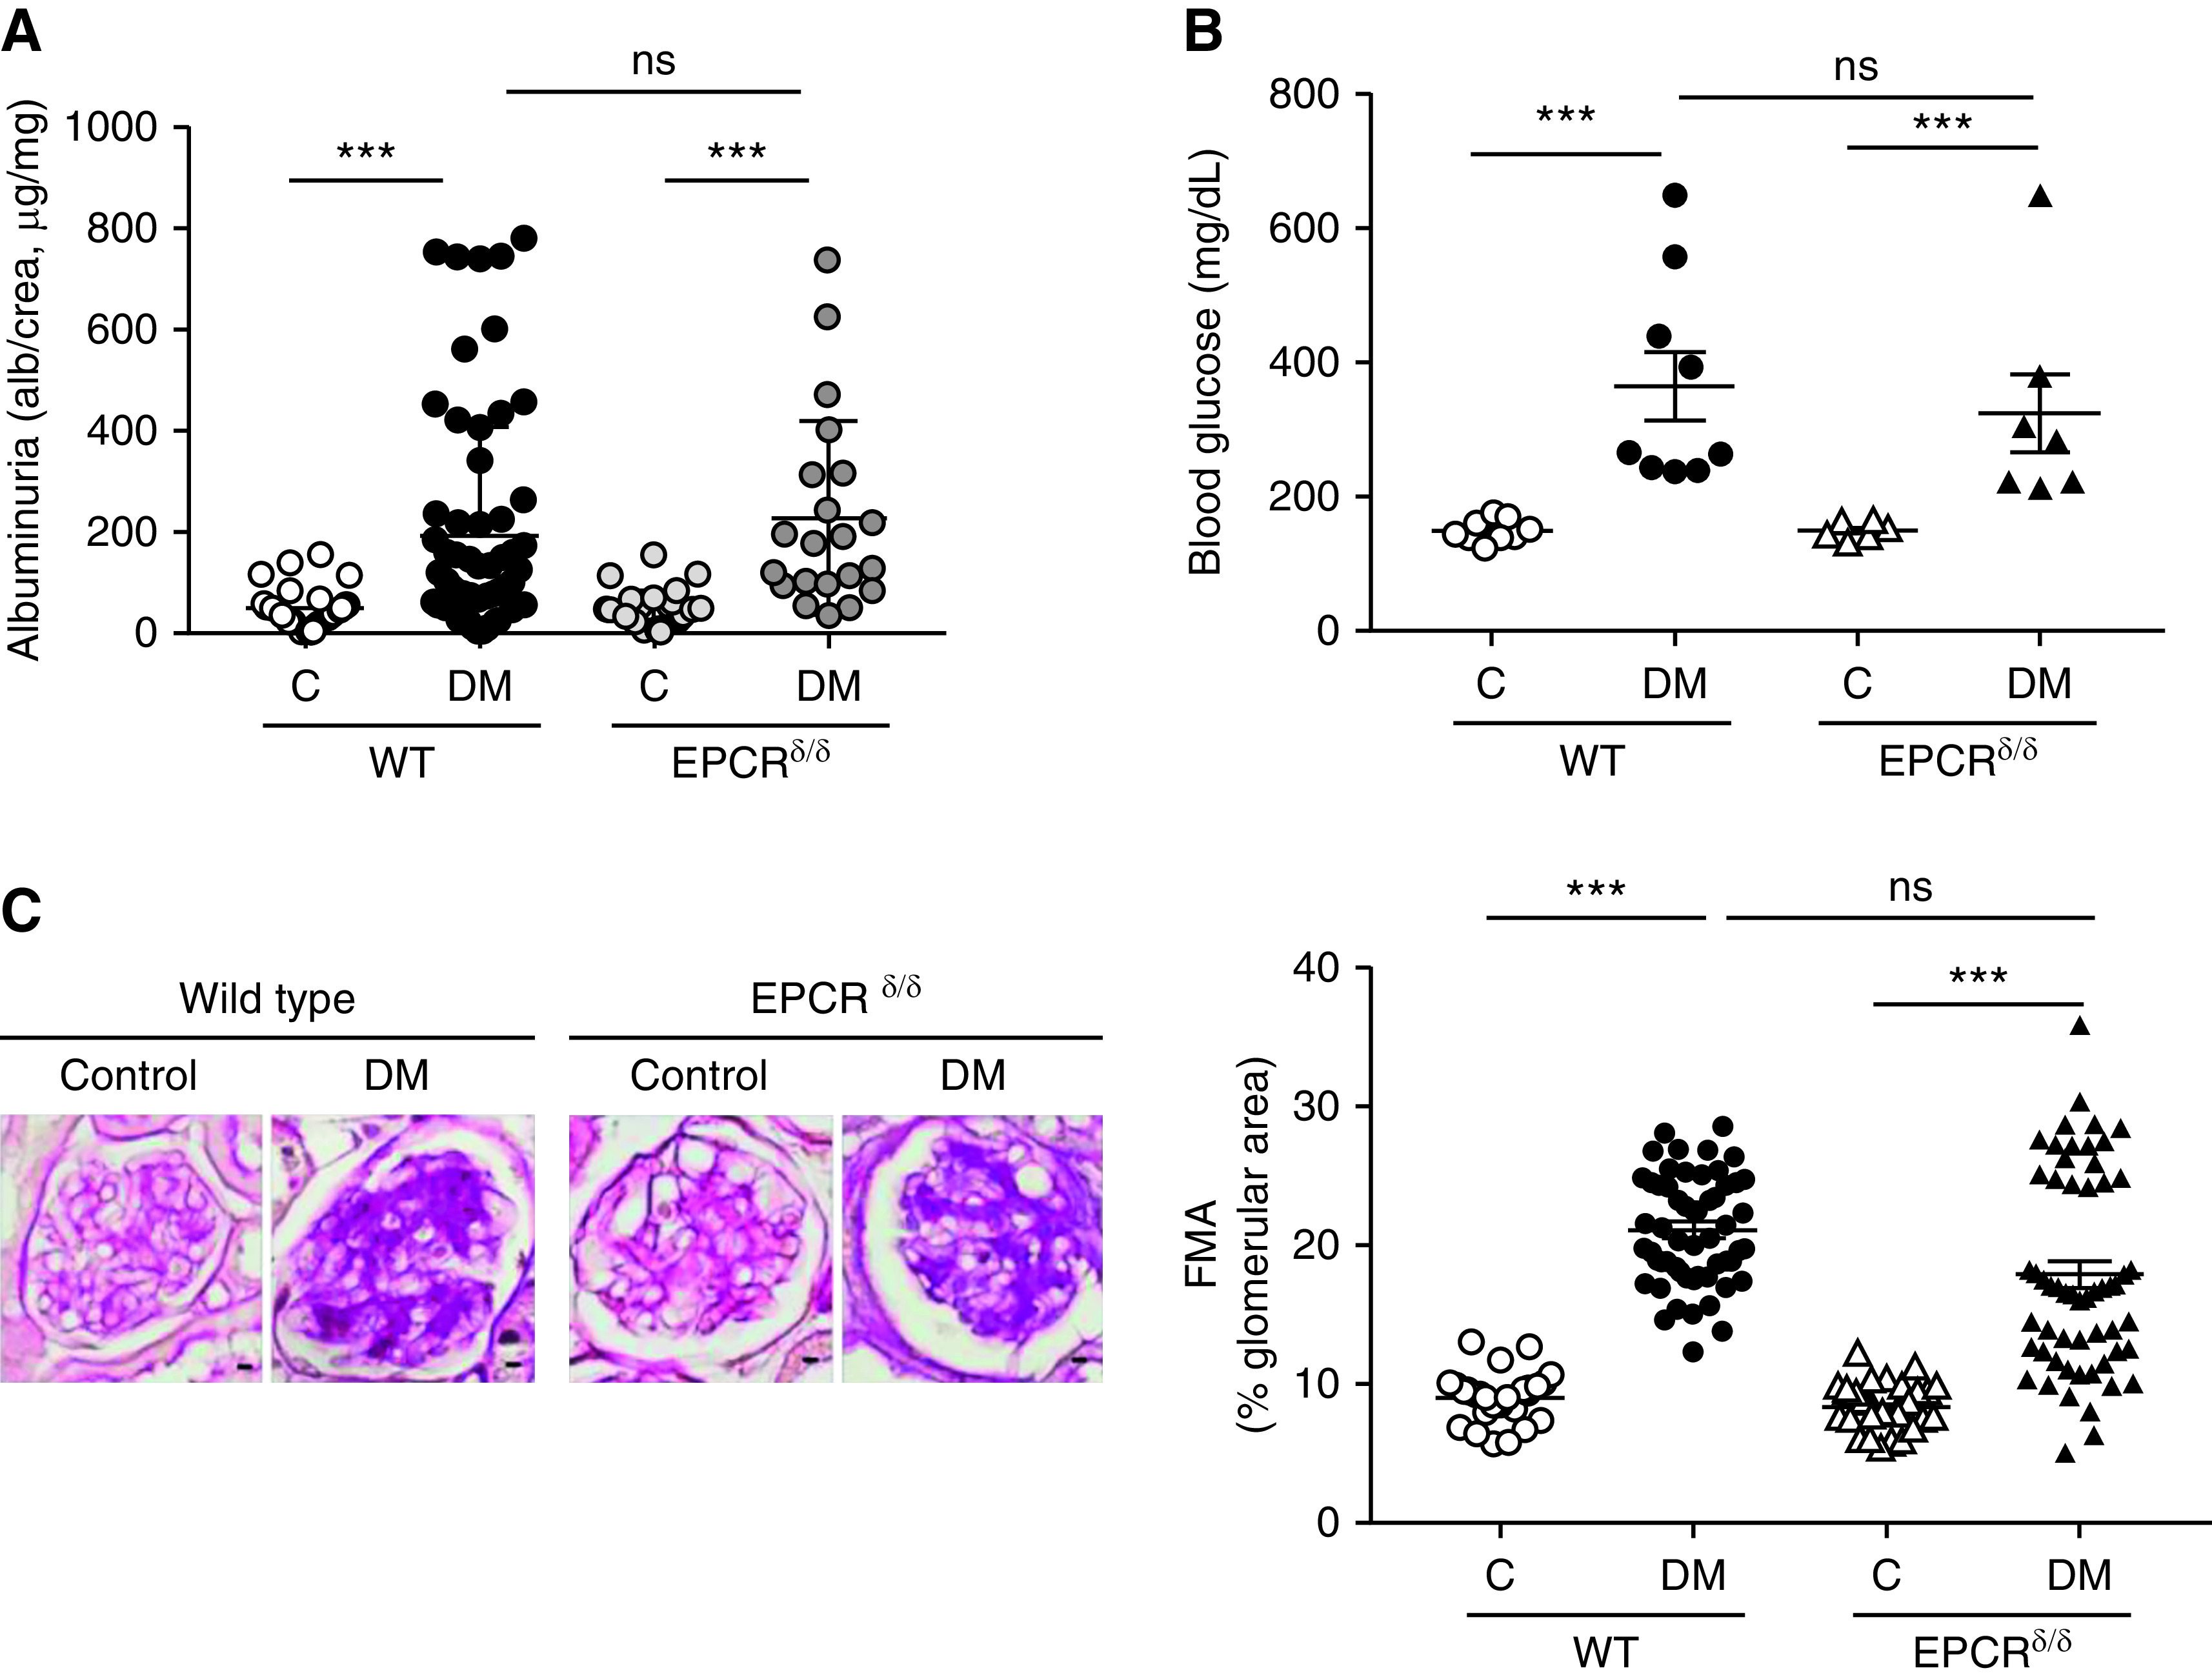
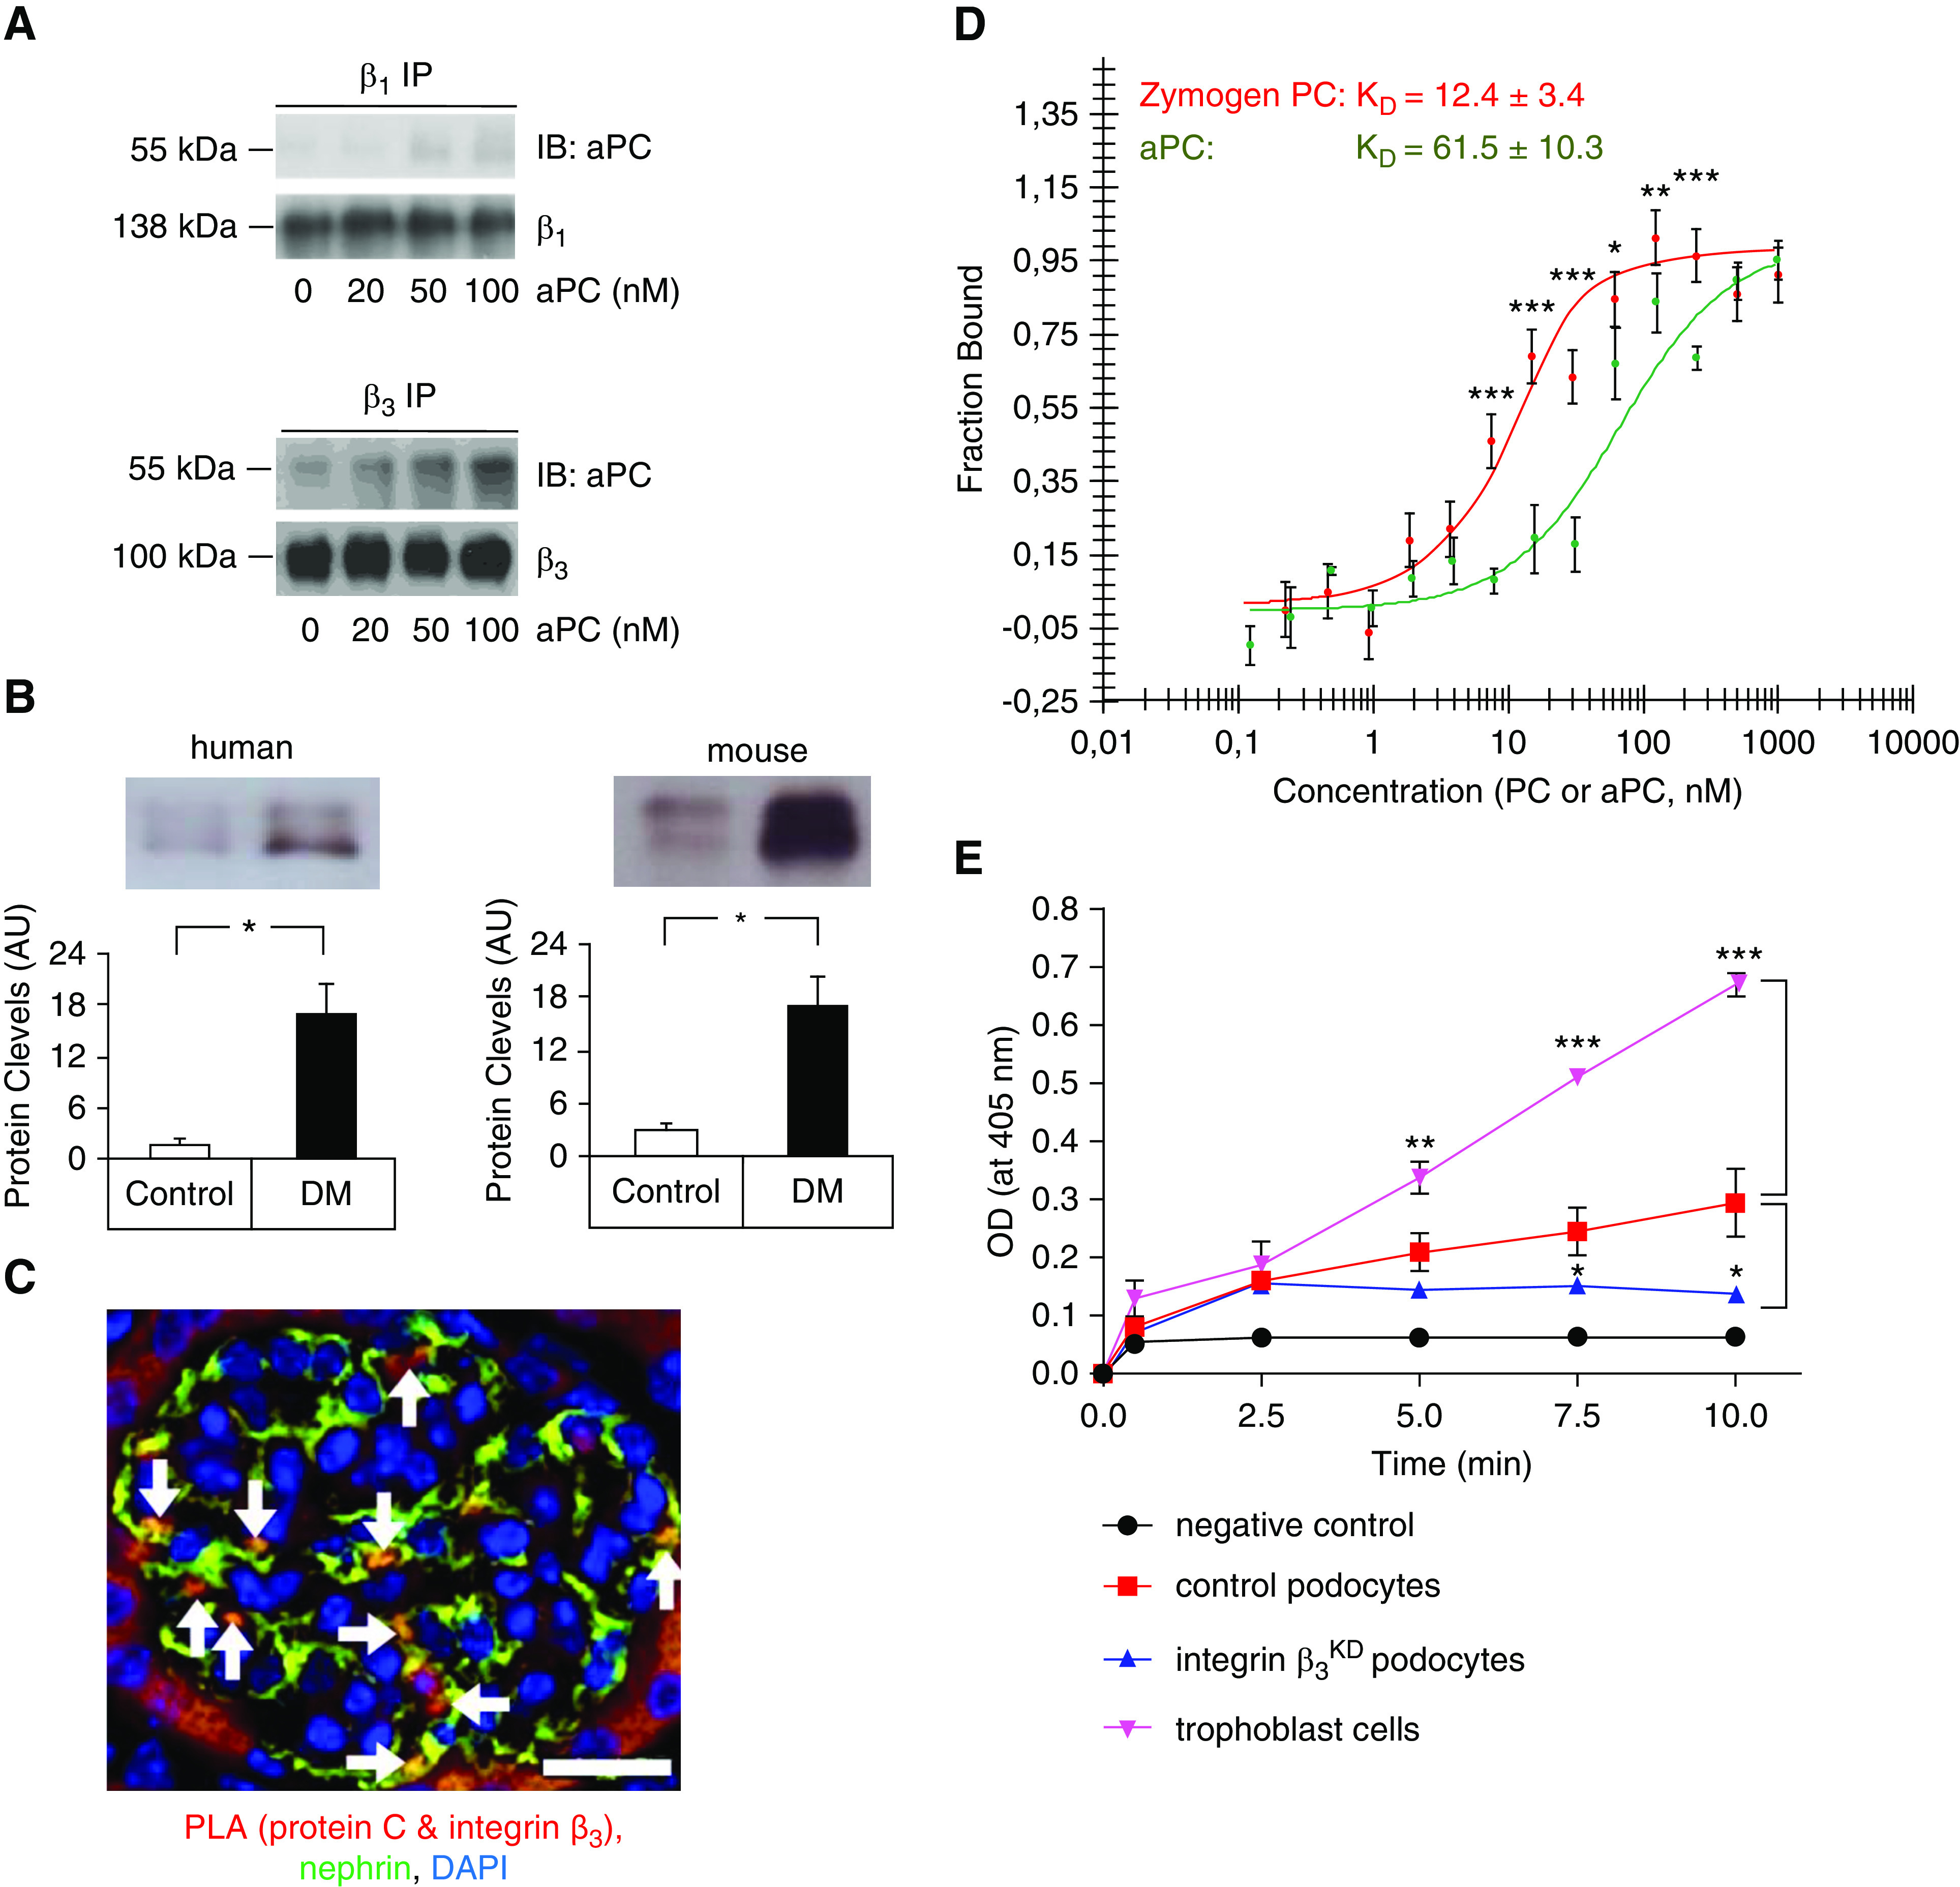
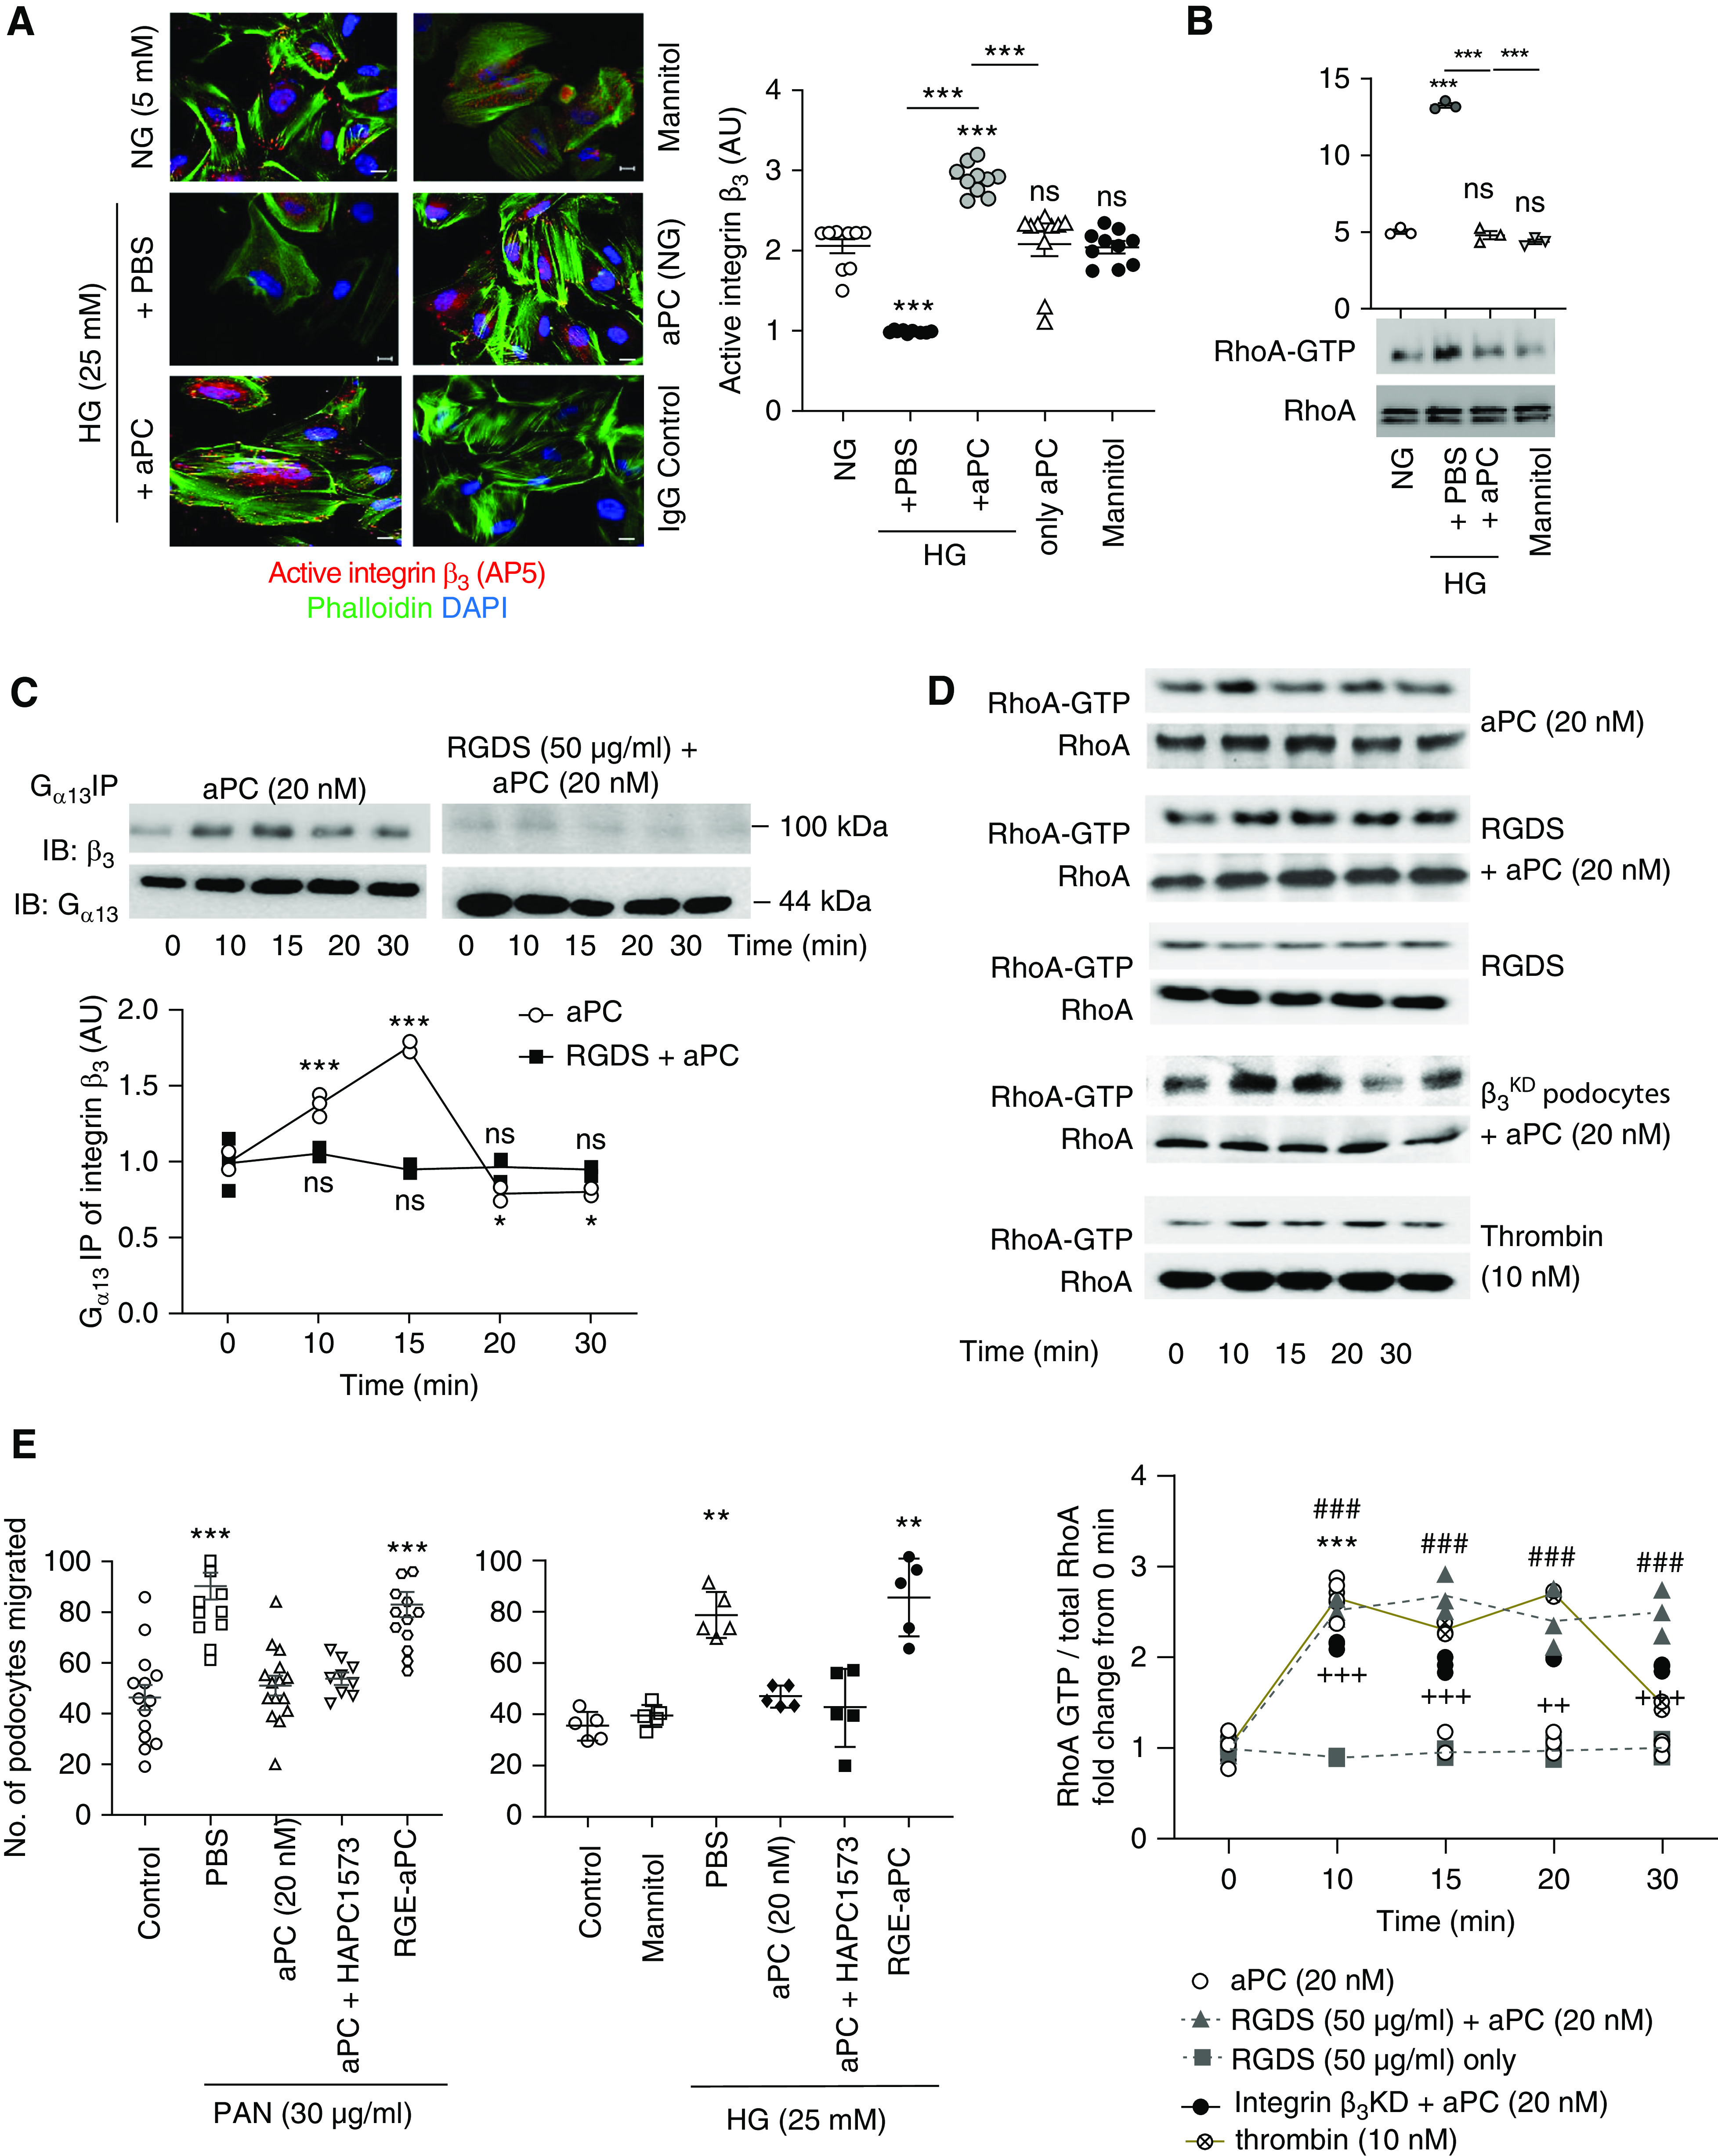
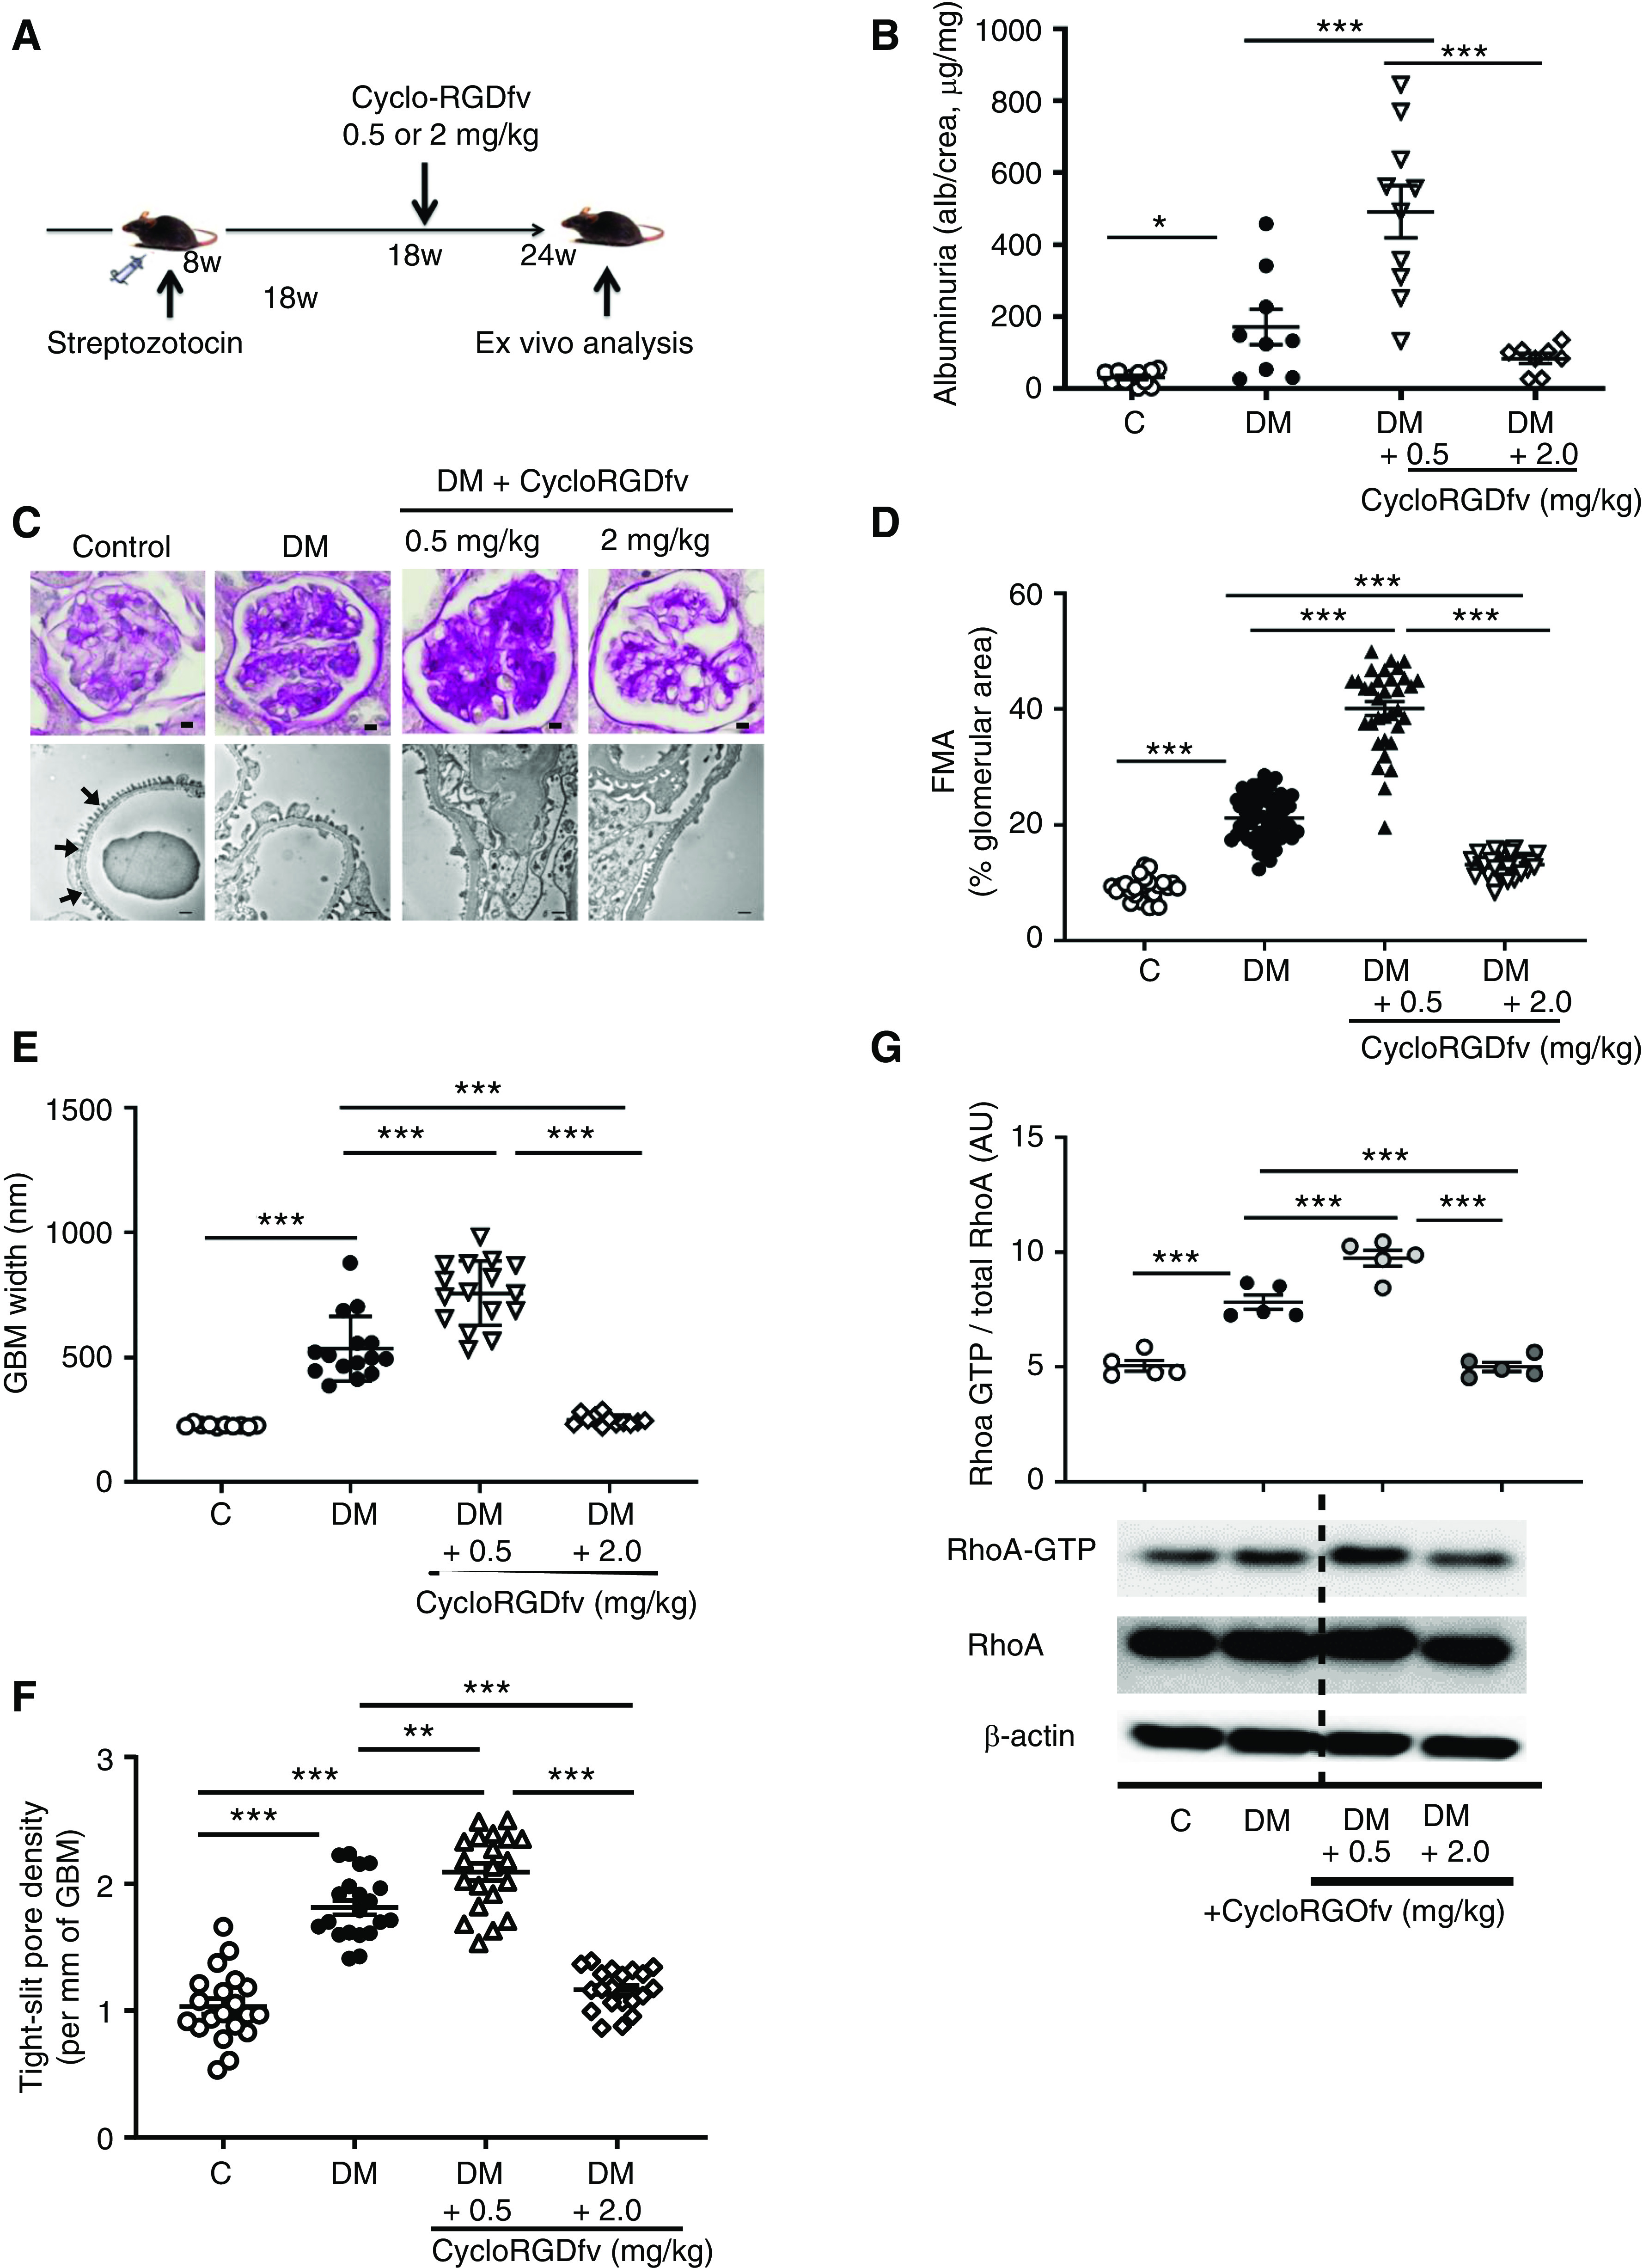
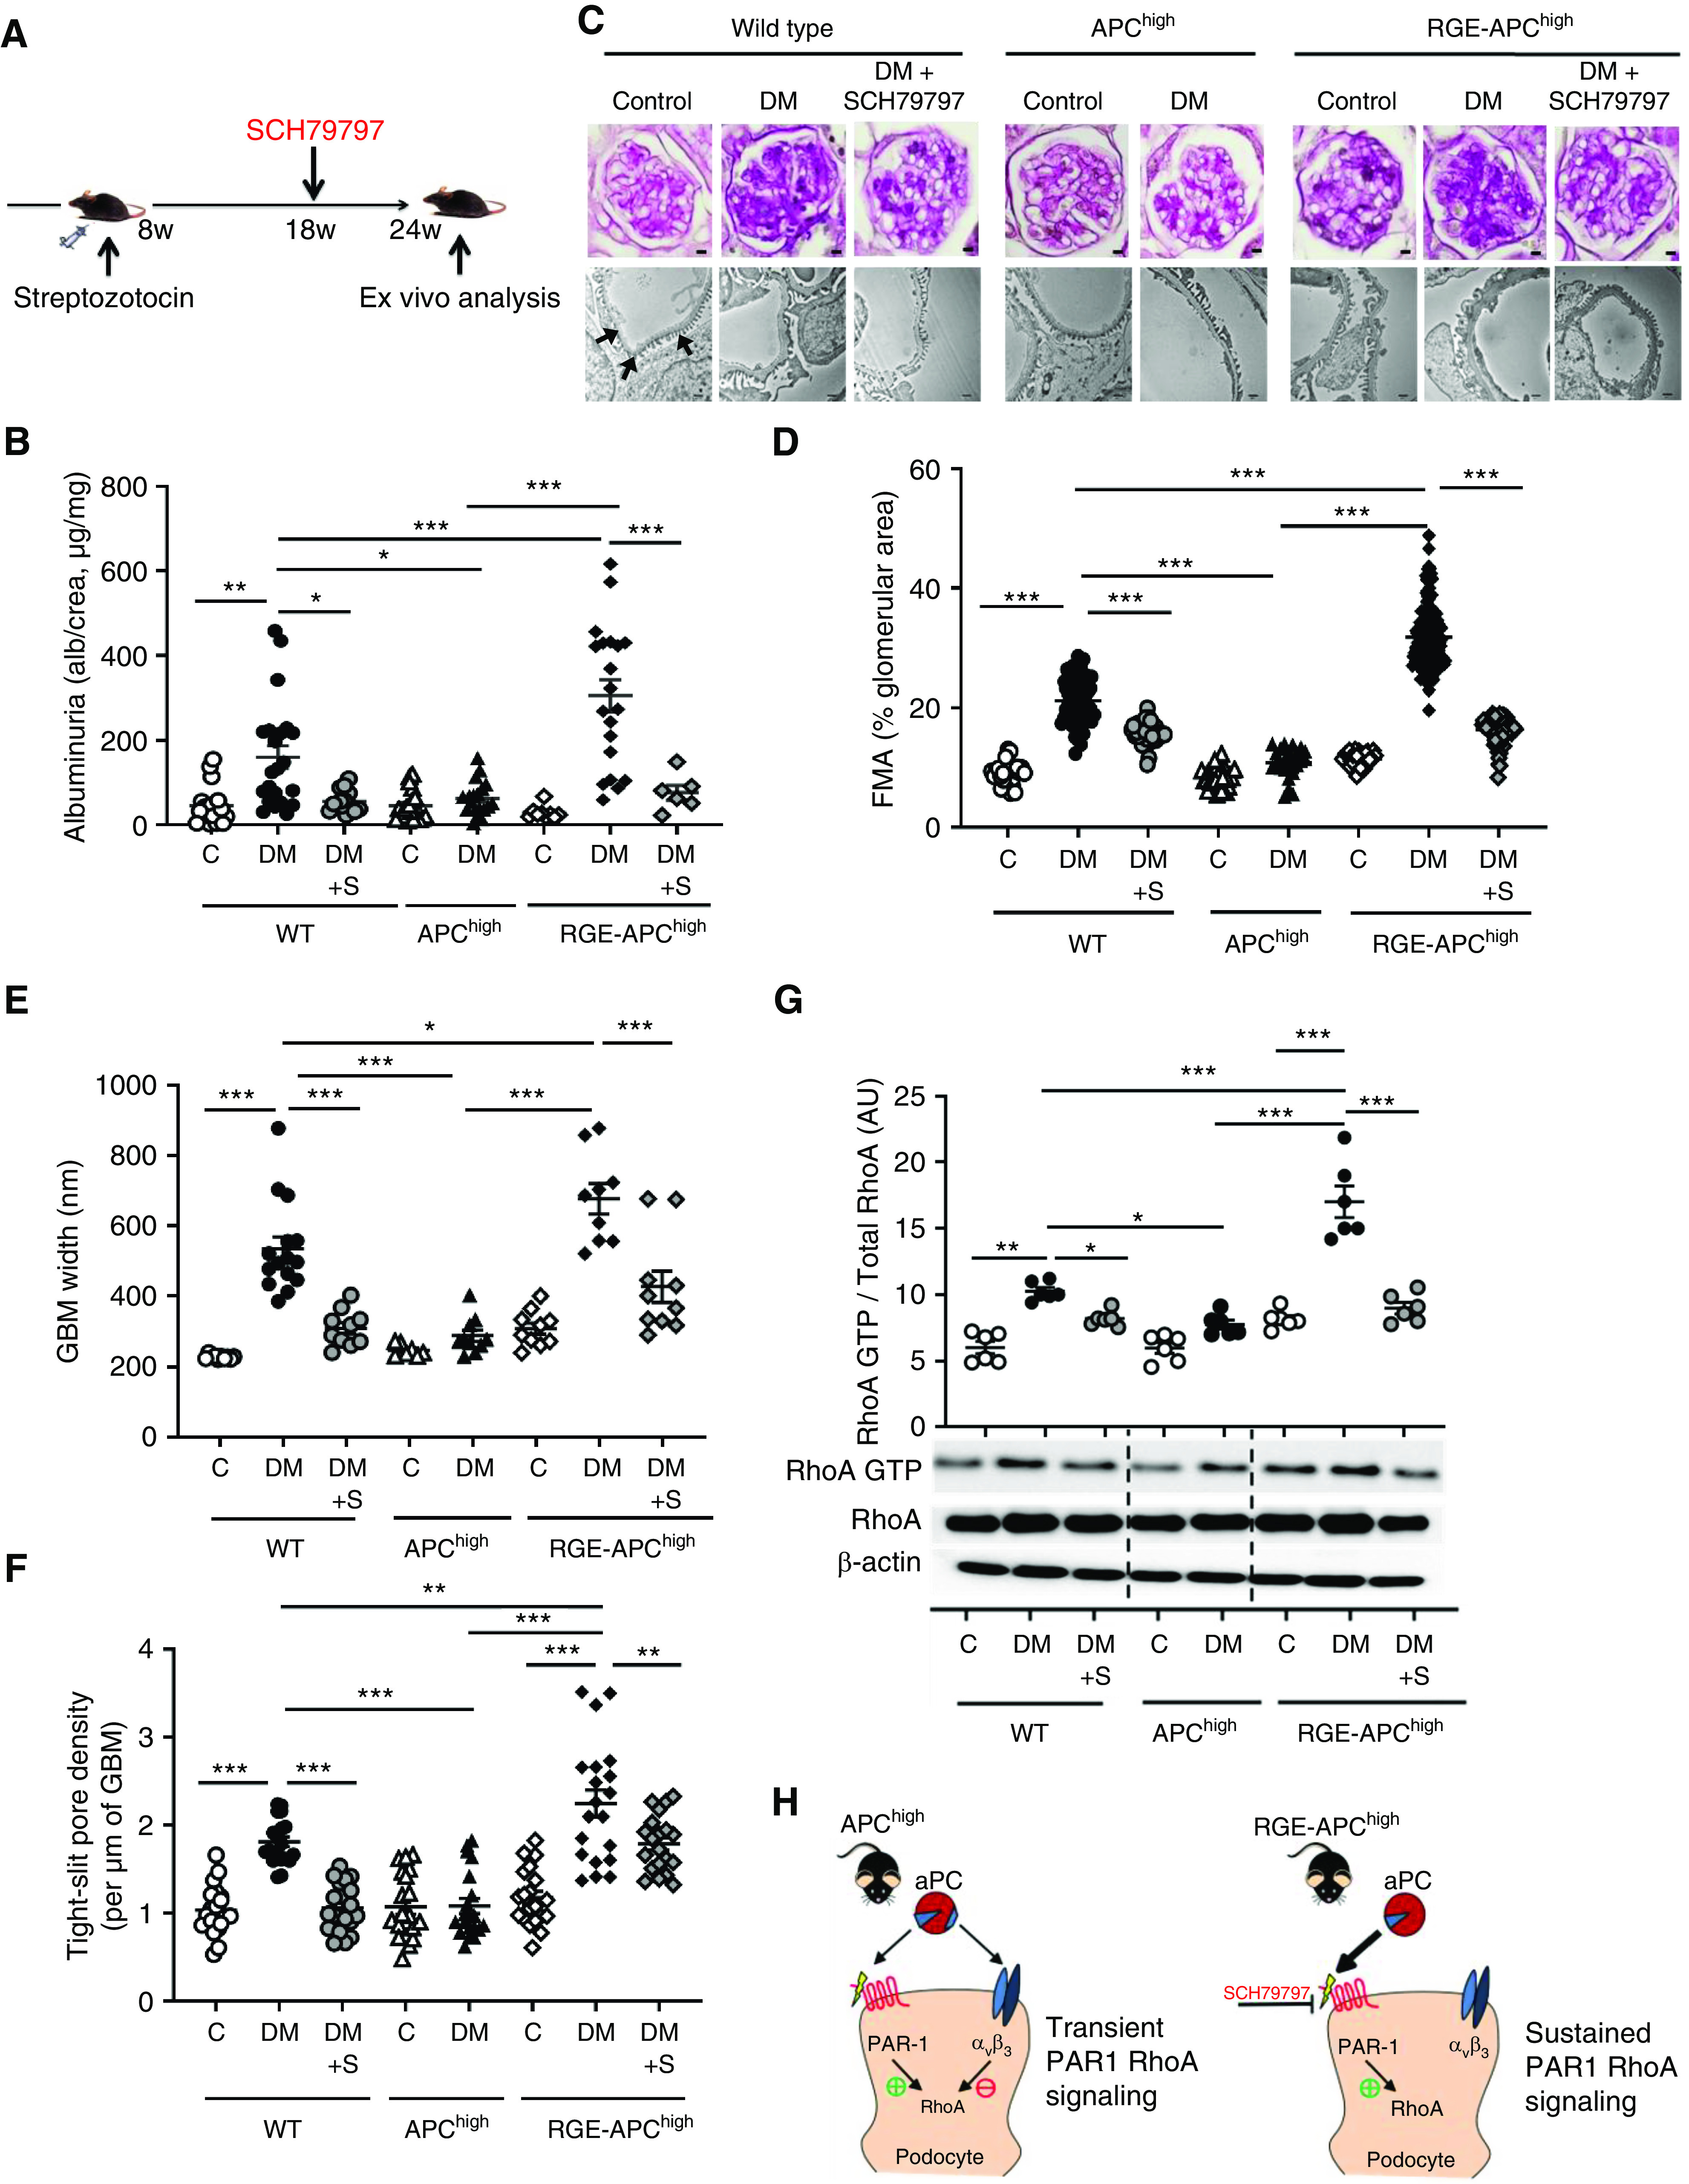
Results: The zymogen protein C and aPC bind to podocyte integrin-β3, a subunit of integrin-αvβ3. Deficiency of this integrin impairs thrombin-mediated generation of aPC on podocytes. The interaction of aPC with integrin-αvβ3 induces transient binding of integrin-β3 with G α13 and controls PAR-dependent RhoA signaling in podocytes. Binding of aPC to integrin-β3via its RGD sequence is required for the temporal restriction of RhoA signaling in podocytes. In podocytes lacking integrin-β3, aPC induces sustained RhoA activation, mimicking the effect of thrombin. In vivo, overexpression of wild-type aPC suppresses pathologic renal RhoA activation and protects against dNP. Disrupting the aPC-integrin-β3 interaction by specifically deleting podocyte integrin-β3 or by abolishing aPC's integrin-binding RGD sequence enhances RhoA signaling in mice with high aPC levels and abolishes aPC's nephroprotective effect. Pharmacologic inhibition of PAR1, the pivotal thrombin receptor, restricts RhoA activation and nephroprotects RGE-aPChigh and wild-type mice.Conclusions aPC-integrin-αvβ3 acts as a rheostat, controlling PAR1-dependent RhoA activation in podocytes in diabetic nephropathy. These results identify integrin-αvβ3 as an essential coreceptor for aPC that is required for nephroprotective aPC-PAR signaling in dNP.

Keywords: RhoA signaling; activated protein C; coagulation proteases; diabetic nephropathy; integrin αvβ3.


Figures

None
Graphical abstract
Figure 1.
Figure 1.
EPCR deficiency has no effect on dNP. (A and B) Dot plot summarizing (A) urine albumin levels (albumin-creatinine ratio) or (B) blood glucose levels in control and diabetic wild-type (WT) and EPCR-deficient (EPCRδ/δ) mice. Albuminuria and blood glucose levels are not different between control or diabetic EPCRδ/δ mice as compared with control or diabetic wild-type mice, respectively. (C) Representative images of glomeruli (left; PAS staining of paraffin-fixed sections; scale bar, 5 μm) and dot plot summarizing data for the FMA (right). Data shown as dot plots represent mean±SEM of at least six mice per group. ***P<0.005. (A and B) ANOVA with Tukey-adjusted post hoc comparison; diabetic mice (DM) were compared with corresponding (WT or EPCRδ/δ) nondiabetic control mice and diabetic WT mice were compared with diabetic EPCRδ/δ mice. C, control; DM, mice with persistent hyperglycemia after STZ injection.
Figure 2.
Figure 2.
The PC–integrin-αvβ3 interaction enhances aPC generation in podocytes. (A) Representative immunoblot images of aPC (55 kDa, top) after immunoprecipitation of integrin-β1 (β1 IP, left, 138 kDa) or integrin-β3 (β3 IP, right, 100 kDa) in human podocytes. Human aPC binds in particular to integrin-β3 on human podocytes; the antibody used to detect aPC recognizes both the zymogen and the activated form. The lower gel shows the loading control (integrin-β1 or integrin-β3). The concentration of aPC is shown at the bottom in nanomolar, and the incubation time was 10 minutes. (B and C) Experimental evidence that PC/aPC is glomerularily filtered and interacts with β3 integrin on podocytes. (B) PC is detectable in the urine of nondiabetic humans and mice (control) and markedly increases in patients with diabetes (DM) and diabetic mice (db/db mice, DM). Representative immunoblot images and bar graph summarizing results of at least five humans or mice per group. *P<0.05, t test comparing DM versus control. (C) Representative image, showing colocalization (yellow, white arrows) of the PC–integrin-β3 complex (red, detected by PLA) with nephrin (green, podocyte marker, immunofluorescence staining) in mouse kidney sections. Scale bar, 20 μm. (D) Binding of the serine protease aPC (green) or the zymogen PC (red) to integrin-αvβ3 as analyzed by microscale thermophoresis. The data are presented as the mean±SEM for three independent repeat experiments. *P<0.05, **P<0.01, ***P<0.005 comparing PC versus aPC; t test with Bonferroni correction. (E) Cell-based in vitro aPC generation assay. Thrombin (10 nM)-mediated PC activation was determined in the presence of trophoblast cells (positive control, purple), control mouse podocytes (red), or integrin-β3–deficient (integrin-β3KD, blue) podocytes. aPC generation in the absence of cells served as a negative control (black). The data are presented as the mean±SEM for three independent repeat experiments. Comparative results were obtained with an independent integrin-β3KD cell line. *P<0.05, **P<0.01, ***P<0.005 versus control podocytes; one-way ANOVA with Bonferroni-adjusted post hoc comparison of trophoblast cells or integrin-β3KD podocytes with control podocytes.
Figure 3.
Figure 3.
aPC–integrin-αvβ3 temporally regulates RhoA activation in podocytes. (A) Representative immunofluorescence images (left) of active integrin-β3, as determined by the conformation-specific antibody AP5, in human podocytes without (normal glucose concentration, 5 mM glucose, NG) or with high glucose (HG, 25 mM) stimulation in the absence (PBS) or presence of aPC (20 nM). Mannitol is used as an osmotic control. Cells stained with nonspecific IgG served as staining controls. The dot plot at the right summarizes the results. All groups were compared with control and HG+PBS to HG+aPC. Scale bar, 20 μm. (B) Representative immunoblot images showing levels of RhoA-GTP (21 kDa) and total RhoA (21 kDa) obtained from the RhoA pull-down assay and dot blot summarizing the data. Compared with control (5 mM glucose, NG) and the osmotic control mannitol (25 mM), high glucose concentrations (25 mM, HG, 3 hours) induce RhoA activation in human podocytes, which is prevented by concomitant exposure to aPC (aPC, 20 nM). (C) Representative integrin-β3 immunoblot images (top; IB: β3) of Gα13 immunoprecipitate showing time-dependent interaction of Gα13 with integrin-β3 upon stimulation of human podocytes with aPC. Gα13 (44 kDa) immunoblots were used as loading controls (top; IB: Gα13). Preincubation of cells with RGDS abolished the aPC-induced time-dependent interaction of Gα13 with integrin-β3. The line graph summarizes the results from three repeat experiments (bottom), with each dot representing an individual measurement. All groups were compared with control. (D) Representative immunoblot images (top) showing the levels of RhoA-GTP (21 kDa) and total RhoA (21 kDa) obtained from the RhoA pull-down assay and line graphs summarizing the kinetic data (bottom). RhoA activation was transient (peaking at 10 minutes) in human podocytes stimulated with aPC only (aPC), whereas sustained RhoA activation over 30 minutes was observed in podocytes stimulated with aPC and RGDS (aPC+RGDS), in integrin-β3–deficient podocytes stimulated with aPC (after lentiviral short hairpin RNA–mediated knockdown of integrin-β3, aPC-β3KD), or in thrombin-stimulated podocytes. RGDS alone had no effect (RGDS). All groups were compared with control. (E) Dot plot summarizing how PAN or high glucose (HG, 25 mM) induced podocyte migration (as determined by scratch assay) after treatment with PBS (PBS, control), aPC, aPC preincubated with the antibody HAPC1573 (a mouse mAb that blocks aPC’s anticoagulant effect), or RGE-aPC. In addition, mannitol as an osmotic control is shown for the glucose stimulation experiment. All groups were compared with control. The data are shown as dots of at least three (A–D) or five (E) independent repeat experiments in the dot plot, including mean and SEM in (A, B, and E), or as dots representing individual data points from three independent repeat experiments in the line graphs in (C and D). *P<0.05, **P<0.01, ***P<0.005 (A, B, and E). ***P<0.005 (aPC versus time point 0 minute), ### P<0.005 (RGDS + aPC versus time point 0 minute), ++P<0.01, +++P<0.005 (integrin β3KD + aPC versus time point 0 minute) in D. (A, B, D, and E) one-way ANOVA with Tukey-adjusted post hoc comparison of treated cells with untreated cells (time point, 0 minute).
Figure 4.
Figure 4.
Podocyte-specific deletion of integrin-β3 abrogates the cytoprotective effect of aPC in dNP. (A) Representative immunofluorescence images (left) of glomeruli of nondiabetic mice (db/m or control [C]), diabetic mice (db/db or STZ-induced diabetes [DM]), or diabetic mice treated with aPC (db/db+aPC or DM+aPC). The conformation-specific antibody AP5 was used to detect active integrin-β3 (red). Podocytes were identified by nephrin staining (green); yellow reflects the colocalization of AP5 and nephrin. The nuclei were stained with DAPI (blue). Dot plots summarizing the results are shown at the right. Diabetic mice without or with aPC treatment were compared with nondiabetic control mice (db/m or C) and among each other (db/db versus db/db+aPC and DM versus DM+aPC). Scale bar, 10 μm. (B) Dot plot summarizing urine albumin levels (the albumin-creatinine ratio) in control (C) and diabetic (DM) wild-type (WT) mice, β3ΔPod mice and β3ΔPod mice crossed with APChigh mice (β3ΔPod APChigh). (C) Representative images of glomeruli (top; PAS staining of paraffin-fixed sections; scale bar, 5 μm) and the glomerular filtration barrier (bottom, transmission electron microscopy; scale bar, 0.2 μm) and dot plots summarizing (D) the data for the FMA, (E) the width of the GBM (representative of arrows in the far-left image of [C] only), and (F) tight slit pore density, reflecting foot process effacement. (G) Representative immunoblots (left) of RhoA-GTP (21 kDa), total RhoA (21 kDa), and β-actin (42 kDa) from renal tissue lysates from experimental mice and dot plots summarizing the data from the experimental groups (right). (H) Schematic representation of the working model: aPC cannot interact with integrin-αvβ3 in β3ΔPod mice, resulting in unopposed PAR1-RhoA signaling, aggravating podocyte dysfunction and hence promoting dNP in mice with increased aPC levels. The data shown in dot plots represent the mean±SEM of at least ten mice (A), five mice (B and D–F), or four mice (G) per group. *P<0.05, **P<0.01, ***P<0.005. (A and C–E) ANOVA with Tukey-adjusted post hoc comparison; for each genotype diabetic mice were compared do nondiabetic mice, and diabetic mutant mice were compared with diabetic wild-type mice. C, nondiabetic control mice; DM, mice with persistent hyperglycemia after STZ injection; MFI, mean fluorescent intensity.
Figure 5.
Figure 5.
Integrin-αvβ3 antagonism dose-dependently modulates dNP. (A) Scheme showing the experimental approach and dosing of the integrin-αvβ3 antagonist Cyclo-RGDfv in wild-type mice with STZ-induced persistent hyperglycemia (DM). (B) Dot plot summarizing urine albumin levels (albumin-creatinine ratio) in control (C) and diabetic (DM) mice; diabetic control mice received PBS. (C) Representative images of glomeruli (top; PAS staining of paraffin-fixed sections; scale bar, 5 μm) and the glomerular filtration barrier (bottom, transmission electron microscopy; scale bar, 0.2 μm) and dot plots summarizing the data for (D) the FMA, (E) the width of the GBM (representative of arrows in the far-left image of [C] only), and (F) tight slit pore density, reflecting foot process effacement. (G) Representative immunoblots of RhoA-GTP (21 kDa), total RhoA (21 kDa), and β-actin (42 kDa) from renal tissue lysates from experimental mice and a dot plot summarizing the data. The data shown in the dot plots represent the mean±SEM of at least eight mice (B–F) or five mice (G) per group; each dot represents data from one mouse. *P<0.05, **P<0.01, ***P<0.001. (B and D–F) ANOVA with Tukey-adjusted post hoc comparison; diabetic mice were compared do nondiabetic mice, and diabetic mice treated with Cyclo-RGDfv were compared with diabetic control mice. C, nondiabetic control mice; DM, mice with persistent hyperglycemia after STZ injection.
Figure 6.
Figure 6.
aPC protects against dNP via its RGD sequence. (A) Experimental design. SCH79797 was used as a PAR1 antagonist in a subgroup of mice to counteract excess PAR1 signaling. (B) Dot plot summarizing urine albumin levels (albumin-creatinine ratio) in control (C) and diabetic (DM) mice. Some diabetic mice received additional SCH79797 treatment (DM+S). (C) Representative images of glomeruli (top; PAS staining of paraffin-fixed sections; scale bar, 5 μm) and the glomerular filtration barrier (bottom; transmission electron microscopy; scale bar, 0.2 μm) and dot plots summarizing the data for (D) the FMA, (E) the width of the GBM (representative of arrows in the far-left image only), and (F) tight-slit pore density, reflecting foot process effacement. (G) Representative immunoblots (bottom) of RhoA-GTP (21 kDa), total RhoA (21 kDa), and β-actin (42 kDa) from renal tissue lysates from experimental mice and a dot plot summarizing the data (top). (H) Schematic representation of the working model: in APChigh mice, aPC activates PAR1 via its proteolytic activity, thus promoting RhoA activation, but at the same time binds to integrin-β3, restricting RhoA activity and resulting in transient RhoA signaling. In contrast, in RGE-APChigh mice, aPC cannot bind to integrin-β3, resulting in sustained RhoA signaling (bottom). SCH79797, a PAR1 antagonist, counteracts the enhanced PAR1 and RhoA signaling in RGE-APChigh mice. The data shown in dot plots represent the mean±SEM of at least six mice per group. *P<0.05, **P<0.01, ***P<0.001. (B and D–F) ANOVA with Tukey-adjusted post hoc comparison; for each genotype diabetic mice were compared do nondiabetic mice, diabetic mutant mice were compared with diabetic wild-type mice, and diabetic mice treated with SCH79797 were compared with untreated diabetic mice of the same genotype. C, nondiabetic control mice; DM, mice with persistent hyperglycemia after STZ injection; DM+S, diabetic mice treated with the PAR1 antagonist SCH79797.

Similar articles

Cited by

References

    1. Fouli GE, Gnudi L: The future: experimental therapies for renal disease in diabetes. Nephron 143: 3–7, 2019. - PubMed
    1. Gaede P, Tarnow L, Vedel P, Parving HH, Pedersen O: Remission to normoalbuminuria during multifactorial treatment preserves kidney function in patients with type 2 diabetes and microalbuminuria. Nephrol Dial Transplant 19: 2784–2788, 2004. - PubMed
    1. Bock F, Shahzad K, Vergnolle N, Isermann B: Activated protein C based therapeutic strategies in chronic diseases. Thromb Haemost 111: 610–617, 2014. - PubMed
    1. Isermann B: Homeostatic effects of coagulation protease-dependent signaling and protease activated receptors. J Thromb Haemost 15: 1273–1284, 2017. - PubMed
    1. Arakaki AKS, Pan WA, Trejo J: GPCRs in cancer: protease-activated receptors, endocytic adaptors and signaling. Int J Mol Sci 19: 1886, 2018. - PMC - PubMed

Publication types