. 2020 Aug 11;117(32):19475-19486.
doi: 10.1073/pnas.2002481117. Epub 2020 Jul 24.

Absence of cGAS-mediated type I IFN responses in HIV-1-infected T cells

Affiliations

Absence of cGAS-mediated type I IFN responses in HIV-1-infected T cells

Carina Elsner et al. Proc Natl Acad Sci U S A. .

Abstract

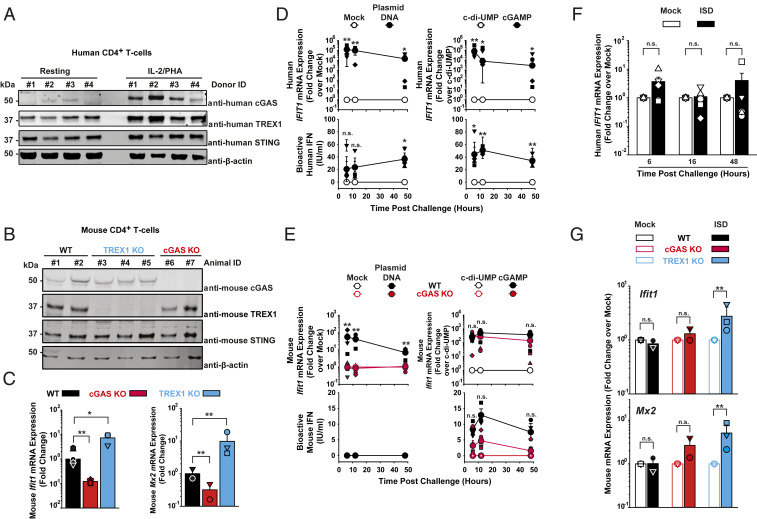
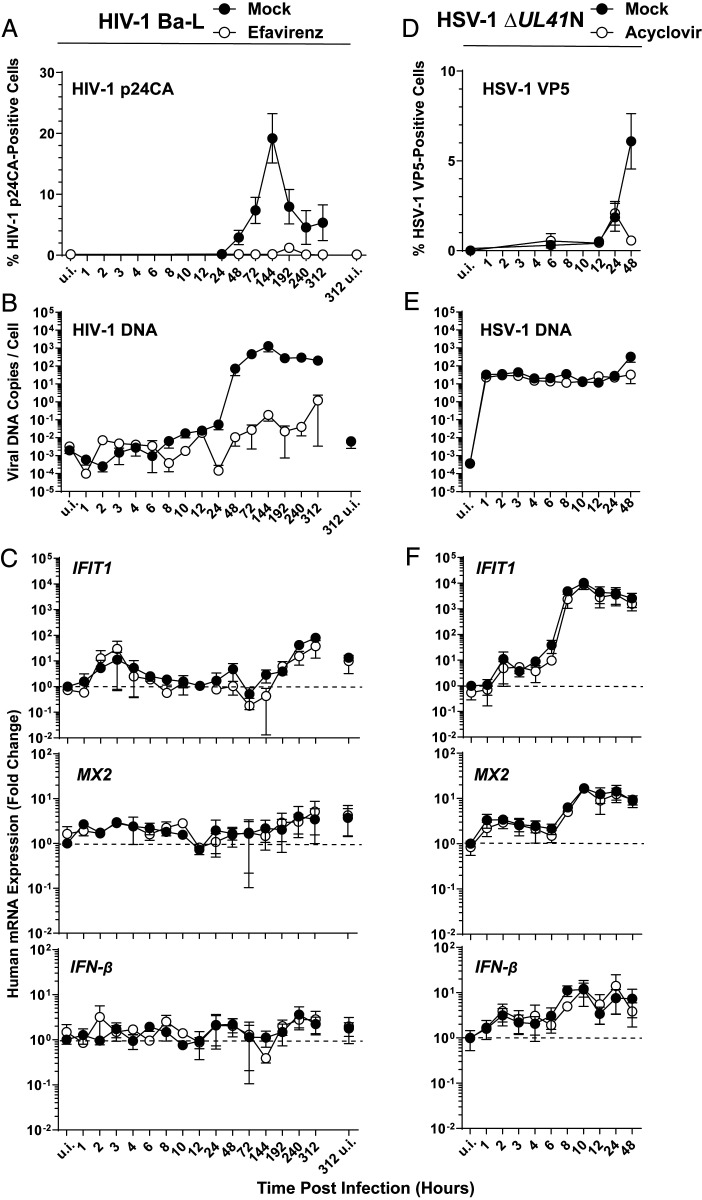
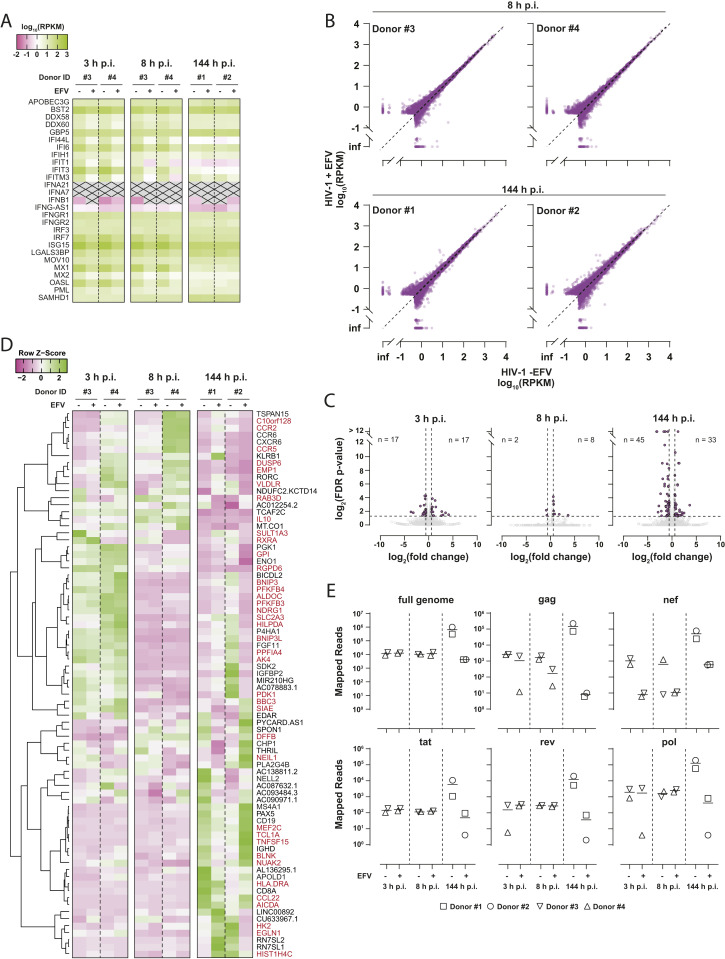
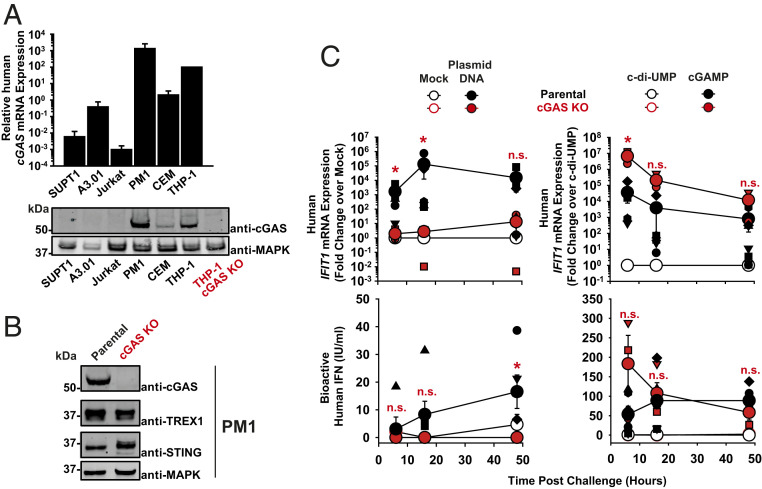
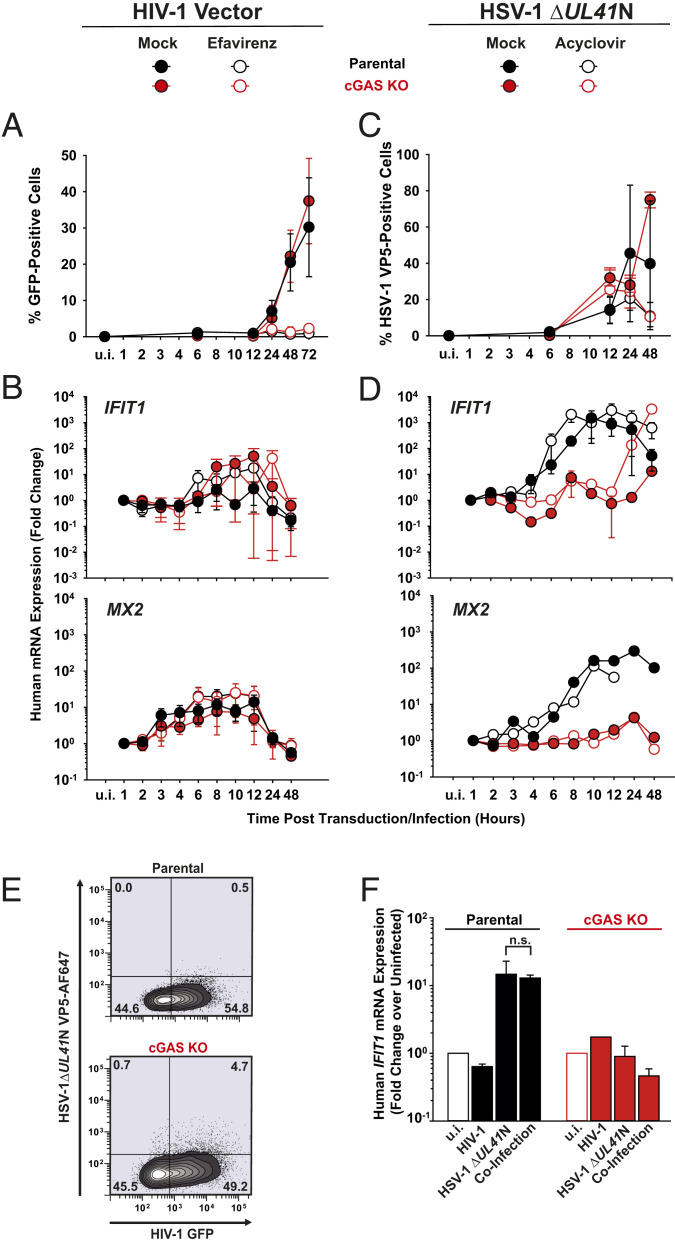
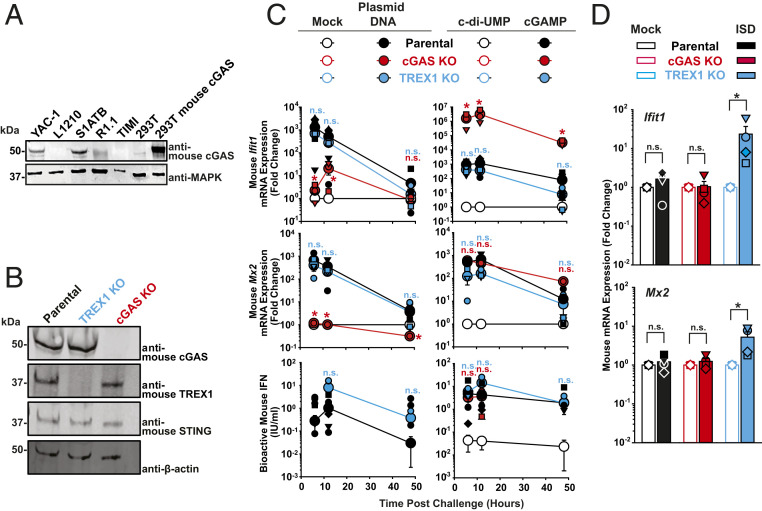
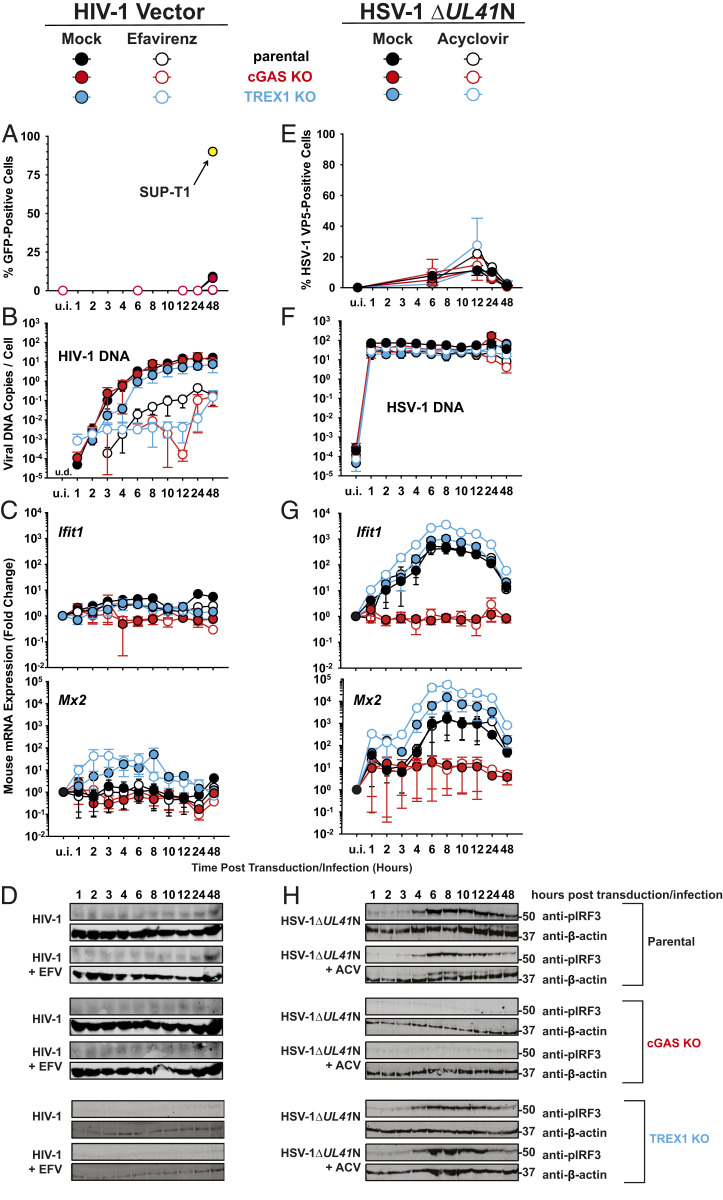
The DNA sensor cGAS catalyzes the production of the cyclic dinucleotide cGAMP, resulting in type I interferon responses. We addressed the functionality of cGAS-mediated DNA sensing in human and murine T cells. Activated primary CD4+ T cells expressed cGAS and responded to plasmid DNA by upregulation of ISGs and release of bioactive interferon. In mouse T cells, cGAS KO ablated sensing of plasmid DNA, and TREX1 KO enabled cells to sense short immunostimulatory DNA. Expression of IFIT1 and MX2 was downregulated and upregulated in cGAS KO and TREX1 KO T cell lines, respectively, compared to parental cells. Despite their intact cGAS sensing pathway, human CD4+ T cells failed to mount a reverse transcriptase (RT) inhibitor-sensitive immune response following HIV-1 infection. In contrast, infection of human T cells with HSV-1 that is functionally deficient for the cGAS antagonist pUL41 (HSV-1ΔUL41N) resulted in a cGAS-dependent type I interferon response. In accordance with our results in primary CD4+ T cells, plasmid challenge or HSV-1ΔUL41N inoculation of T cell lines provoked an entirely cGAS-dependent type I interferon response, including IRF3 phosphorylation and expression of ISGs. In contrast, no RT-dependent interferon response was detected following transduction of T cell lines with VSV-G-pseudotyped lentiviral or gammaretroviral particles. Together, T cells are capable to raise a cGAS-dependent cell-intrinsic response to both plasmid DNA challenge or inoculation with HSV-1ΔUL41N. However, HIV-1 infection does not appear to trigger cGAS-mediated sensing of viral DNA in T cells, possibly by revealing viral DNA of insufficient quantity, length, and/or accessibility to cGAS.

Keywords: HIV-1; HSV-1; T cells; cGAS; innate sensing.


Conflict of interest statement

Competing interest statement: W.B. is an employee of IFM Therapeutics.

Figures

Fig. 1.
Fig. 1.
Plasmid DNA challenge elicits a type I IFN response in activated human and murine primary CD4+ T cells. (A) Immunoblotting of lysates of primary human CD4+ T cells using indicated antibodies. (B) Immunoblotting of lysates of primary anti-CD3/28–activated and IL-2–activated CD4+ T cells from WT, TREX1 KO, and cGAS KO mice using indicated antibodies. (C) Relative steady-state Ifit1 and Mx2 mRNA levels were determined by qRT-PCR in activated CD4+ T cells of mice of indicated genotype (n = 2–3). Error bars indicate SEM from values obtained from cell cultures of two to three individual animals of each genotype. Small symbols represent levels obtained in individual animals; bars represent the arithmetic mean of values of all cell cultures of a given condition. (D) Activated human CD4+ T cells were either mock-electroporated or electroporated with plasmid DNA (Left), and electroporated either with c-di-UMP or cGAMP (Right). Cultures were monitored at indicated time points postchallenge for relative IFIT1 mRNA expression by qRT-PCR (Upper) and release of bioactive type I IFN using a luminometric HL116-based assay (Lower). Error bars indicate SEM from values obtained from cells from four individual donors whose values are depicted as small symbols. Large symbols represent the arithmetic mean of values of all cell cultures of a given condition. (E) Activated mouse CD4+ T cells of WT and cGAS KO animals were either mock-electroporated or electroporated with plasmid DNA (Left), and electroporated either with c-di-UMP or cGAMP (Right). Cultures were monitored at indicated time points postchallenge for Ifit1 mRNA expression by qRT-PCR (Upper) and release of bioactive type I IFN using a luminometric MEF-based assay (Lower). Error bars indicate SEM from values obtained from cells from three individual animals of each genotype whose values are depicted as small symbols. Large symbols represent the arithmetic mean of values of all cell cultures of a given condition. Statistical significance was calculated for T cells from cGAS KO versus WT animals. (F) Activated human CD4+ T cells were mock-electroporated or electroporated with short ISD and monitored at indicated hours postchallenge for IFIT1 mRNA expression by qRT-PCR. Error bars indicates SEM from values obtained from cells from four to five individual donors whose values are depicted as small symbols; bars represent the arithmetic mean of values of all cell cultures of a given condition. (G) Activated mouse CD4+ T cells of indicated animals were mock-electroporated or electroporated with short ISD and monitored at 6 h postchallenge for Ifit1 mRNA expression by qRT-PCR. Error bars indicates SEM from cells of three individual animals of each genotype whose values are depicted as small symbols; bars represent the arithmetic mean of values of all cell cultures of a given condition. P values <0.05 were considered significant (*) and <0.01 very significant (**); n.s. = not significant (≥0.05).
Fig. 2.
Fig. 2.
De novo HIV-1 infection, as opposed to HSV-1 infection, fails to trigger a type I IFN response in human CD4+ T cells. (AC) Primary human CD4+ T cells were infected with HIV-1Ba-L in the absence and presence of EFV and monitored, at indicated time points, for: (A) HIV-1 p24 capsid expression by intracellular immunostaining followed by FACS analysis. (B) De novo synthesis of HIV-1 late RT products by absolute qPCR. (C) Relative expression of IFIT1, MX2, and IFN-β by qRT-PCR. (DF) Primary human CD4+ T cells were inoculated with HSV-1 ΔUL41N in the absence and presence of ACV and monitored, at indicated time points, for: (D) HSV-1 VP5 capsid protein expression by intracellular immunostaining followed by FACS analysis. (E) Genomic HSV-1 DNA copy numbers by absolute qPCR. (F) Relative expression of IFIT1, MX2, and IFN-β by qRT-PCR. Error bars show SEM from values obtained from CD4+ T cells from three to five individual donors.
Fig. 3.
Fig. 3.
Global analysis of the cellular transcriptome of HIV-1Ba-L–infected primary CD4+ T cells. (A) RPKM values of 28 individual genes implicated in or induced by the IFN signaling pathway are depicted as heatmap. Shown is the temporal expression in ex vivo HIV-1Ba-L–infected CD4+ T cells at 3, 8, and 144 h postinfection (p.i.), in the presence or absence of EFV treatment. Transcripts with RPKM < 0.01 are crossed out. (B) Plot of raw RPKM values greater than 0.5 of RNAs of all donors obtained from productively infected cells (HIV-1 -EFV) versus cells treated with EFV (HIV-1 +EFV) prior to and during infection. (C) Plot of fold change (untreated versus EFV-treated cells) versus FDR P value of all mapped human genes at indicated time points p.i. with HIV-1Ba-L (gray circles). The numbers of transcripts deregulated more than twofold with FDR P values <0.05 (purple circles) are shown in the plots. (D) Heatmap displaying row z-scores of the 78 genes that were statistically significantly deregulated in untreated versus EFV-treated infected cells at 144 h p.i. Complete linkage clustering of genes using the Pearson distance measurement method was performed with heatmapper 2 (www2.heatmapper.ca). Genes labeled in red are known ISGs according to interferome v2.01 (www.interferome.org; search parameters were set to “any”, except, Species: “Homo sapiens” and System: “Haemopoietic/Immune”). (E) Number of RNA-seq reads mapping to HIV-1Ba-L reference sequence at indicated time points postinfection.
Fig. 4.
Fig. 4.
The human T cell line PM1 expresses functional cGAS. (A) Relative levels of cGAS mRNA expression in indicated cell lines (bar diagram). The level detected in THP-1 cells is set to 100. Immunoblotting of indicated cell lysates using anti-cGAS and anti-MAPK antibodies. Lysates of parental and cGAS KO THP-1 cells serve as specificity control for the anti-human cGAS antibody. (B) Immunoblotting of lysates of parental and cGAS KO PM1 T cell lines using indicated antibodies. (C) Parental and cGAS KO PM1 T cells were either mock-electroporated or electroporated with plasmid DNA (Left), or electroporated either with c-di-UMP or cGAMP (Right). Cultures were monitored at indicated time points postchallenge for relative IFIT1 mRNA expression by qRT-PCR (Upper) and release of bioactive type I IFN using a luminometric HL116-based assay (Lower). Error bars show SEM from three to four independent experiments whose values are shown as small symbols. The arithmetic means of values of all cell cultures of a given condition are shown as large symbols. Statistical significance was calculated for cGAS KO versus parental T cells. P values <0.05 were considered significant (*) and <0.01 very significant (**); n.s. = not significant (≥0.05).
Fig. 5.
Fig. 5.
Absence of cGAS-mediated innate immune responses in PM1 T cells upon lentiviral vector transduction as opposed to HSV-1 infection. (A and B) Parental and cGAS KO PM1 T cells were transduced with VSV-G–pseudotyped HIV-1 GFP vectors in the absence and presence of EFV and monitored, at indicated time points, for: (A) Reporter GFP expression by FACS analysis. (B) Relative expression of IFIT1 and MX2 by qRT-PCR. (C and D) Parental and cGAS KO PM1 T cells were inoculated with HSV-1 ΔUL41N in the absence and presence of ACV and monitored, at indicated time points, for: (C) HSV-1 VP5 capsid protein expression by intracellular immunostaining followed by FACS analysis. (D) Relative expression of IFIT1 and MX2 by qRT-PCR. (E) Parental and cGAS KO T cells were transduced with HIV-1 vectors, followed by inoculation with HSV-1 ΔUL41N 24 h later. Shown is a representative dot plot of dually infected cells at 48 h post-HSV-1 inoculation. (F) Relative IFIT1 mRNA expression in indicated cells 48 h post-HSV-1 inoculation. P values <0.05 were considered significant (*) and <0.01 very significant (**); n.s. = not significant (≥0.05).
Fig. 6.
Fig. 6.
cGAS and TREX1 modulate sensing of plasmid DNA and of ISD, respectively. (A) Immunoblotting of indicated cell lysates using anti-mouse cGAS and anti-MAPK antibodies. Lysates of parental HEK293T and mouse cGAS-expressing HEK293T serve as specificity controls for the anti-mouse cGAS antibody. (B) Immunoblotting of lysates of parental and cGAS KO YAC-1 T cell lines using indicated antibodies. (C) Parental, cGAS KO and TREX1 KO YAC-1 T cells were either mock-electroporated or electroporated with plasmid DNA (Left), or electroporated either with c-di-UMP or cGAMP (Right). Cultures were monitored at indicated time points postchallenge for relative Ifit1 and Mx2 mRNA expression by qRT-PCR (Top and Middle) and release of bioactive type I IFN using a luminometric MEF-based assay (Bottom). (D) Indicated YAC-1 T cell lines were mock-electroporated or electroporated with short ISD and monitored at 6 h postchallenge for Ifit1 and Mx2 mRNA expression by qRT-PCR. P values <0.05 were considered significant (*) and <0.01 very significant (**); n.s. = not significant (≥0.05).
Fig. 7.
Fig. 7.
Lack of cGAS-mediated innate immune sensing of HIV-1 and MLV transduction in mouse YAC-1 T cells. (AD) Parental, cGAS KO, and TREX1 KO T cell lines were inoculated with VSV-G HIV-1 GFP vectors in the absence and presence of EFV and monitored, at indicated time points, for: Reporter GFP expression by FACS analysis (A), de novo synthesis of HIV-1 late RT products by absolute qPCR (B), relative expression of Ifit1 and Mx2 by qRT-PCR (C), and phosphorylated IRF3 by immunoblotting using a phospho-IRF3 antibody (D). (EH) Parental, cGAS KO, and TREX1 KO T cell lines were inoculated with HSV-1 ΔUL41N in the absence and presence of ACV and monitored, at indicated time points, for: HSV-1 VP5 capsid protein expression by intracellular immunostaining followed by FACS analysis (E), genomic HSV-1 DNA copy numbers by absolute qPCR (F), relative expression of Ifit1 and Mx2 by qRT-PCR (G), phosphorylated IRF3 by immunoblotting using a phospho-IRF3 antibody (H).

References

    1. Ablasser A., et al. , cGAS produces a 2′-5′-linked cyclic dinucleotide second messenger that activates STING. Nature 498, 380–384 (2013). - PMC - PubMed
    1. Gao P., et al. , Cyclic [G(2′,5′)pA(3′,5′)p] is the metazoan second messenger produced by DNA-activated cyclic GMP-AMP synthase. Cell 153, 1094–1107 (2013). - PMC - PubMed
    1. Ablasser A., et al. , TREX1 deficiency triggers cell-autonomous immunity in a cGAS-dependent manner. J. Immunol. 192, 5993–5997 (2014). - PubMed
    1. Yan N., Regalado-Magdos A. D., Stiggelbout B., Lee-Kirsch M. A., Lieberman J., The cytosolic exonuclease TREX1 inhibits the innate immune response to human immunodeficiency virus type 1. Nat. Immunol. 11, 1005–1013 (2010). - PMC - PubMed
    1. Ma Z., et al. , Modulation of the cGAS-STING DNA sensing pathway by gammaherpesviruses. Proc. Natl. Acad. Sci. U.S.A. 112, E4306–E4315 (2015). - PMC - PubMed

Publication types

MeSH terms