. 2020 Aug 11;117(32):19007-19016.
doi: 10.1073/pnas.2002821117. Epub 2020 Jul 24.

Thinner biological tissues induce leaflet flutter in aortic heart valve replacements

Affiliations

Thinner biological tissues induce leaflet flutter in aortic heart valve replacements

Emily L Johnson et al. Proc Natl Acad Sci U S A. .

Abstract

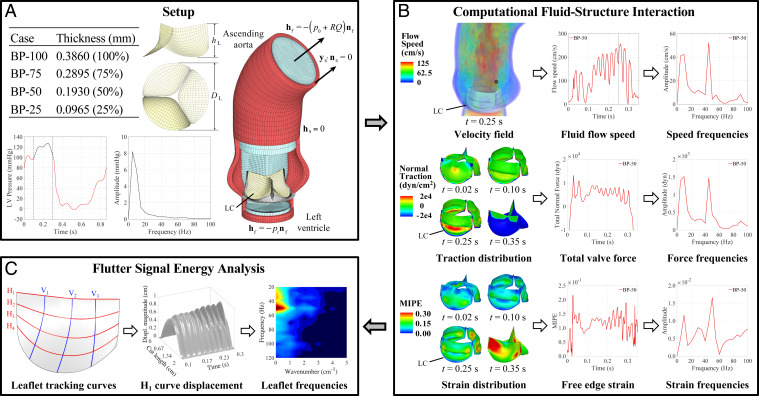
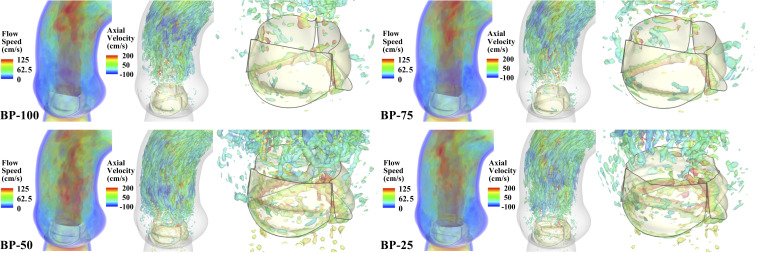
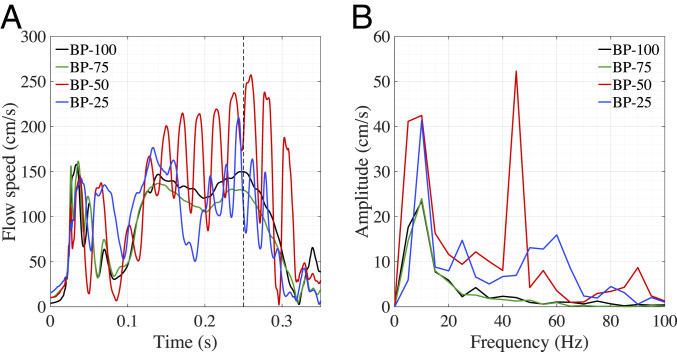
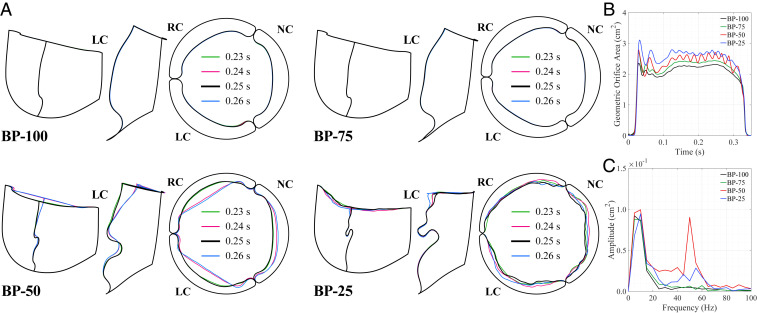
Valvular heart disease has recently become an increasing public health concern due to the high prevalence of valve degeneration in aging populations. For patients with severely impacted aortic valves that require replacement, catheter-based bioprosthetic valve deployment offers a minimally invasive treatment option that eliminates many of the risks associated with surgical valve replacement. Although recent percutaneous device advancements have incorporated thinner, more flexible biological tissues to streamline safer deployment through catheters, the impact of such tissues in the complex, mechanically demanding, and highly dynamic valvular system remains poorly understood. The present work utilized a validated computational fluid-structure interaction approach to isolate the behavior of thinner, more compliant aortic valve tissues in a physiologically realistic system. This computational study identified and quantified significant leaflet flutter induced by the use of thinner tissues that initiated blood flow disturbances and oscillatory leaflet strains. The aortic flow and valvular dynamics associated with these thinner valvular tissues have not been previously identified and provide essential information that can significantly advance fundamental knowledge about the cardiac system and support future medical device innovation. Considering the risks associated with such observed flutter phenomena, including blood damage and accelerated leaflet deterioration, this study demonstrates the potentially serious impact of introducing thinner, more flexible tissues into the cardiac system.

Keywords: fluid–structure interaction; heart valves; immersogeometric analysis; leaflet flutter; thin biological tissues.


Conflict of interest statement

The authors declare no competing interest.

Figures

Fig. 1.
Fig. 1.
Overall schematic of the FSI-simulation and flutter-quantification methodologies. All results and analyses show the BP-50 case. The left coronary leaflet (LC) is indicated on each geometry. Further details can be found in Materials and Methods. (A) Valve thicknesses, ventricular pressure waveform, and problem setup for the computational simulation of the aorta and valve geometry. (B) FSI results and signal analysis procedure for the velocity field, leaflet normal tractions, and leaflet strains. The time signals of each quantity are analyzed using DFT operations. (C) Flutter-analysis methodology for the leaflet displacement. The tracking curves on the leaflet indicate the horizontal and vertical locations along which the flutter behavior is quantified. High-resolution version of this figure is available in the SI Appendix.
Fig. 2.
Fig. 2.
FSI-simulation results for each valve thickness case. Volume-rendering visualization of the velocity field, colored by the flow speed, and vorticity isosurfaces, colored by the axial (normal to the aortic annulus) velocity, at peak opening (t=0.25 s) are shown for each case. High-resolution version of this figure is available in the SI Appendix.
Fig. 3.
Fig. 3.
Flow-speed results for each valve thickness case. (A) The speed is evaluated for each valve at the point indicated in Fig. 1B. (B) Frequency domain from the DFT operations for t=0.1 to 0.3 s of the flow speed.
Fig. 4.
Fig. 4.
Leaflet shapes at selected time instances for each valve thickness case. (A) Side and top views of the shape at the free edge (H1) and at the central vertical tracking curve (V2). The top view shows the orientation of the right coronary leaflet (RC) and noncoronary leaflet (NC) relative to the left coronary leaflet (LC). (B) Projected geometric orifice area computed for each valve. (C) Frequency domain from the DFT operations for t=0.1 to 0.3 s of the geometric orifice area.
Fig. 5.
Fig. 5.
Pressure field and transvalvular pressure gradient. (A) Pressure contours superimposed with streamlines at peak opening (t=0.25 s). The transvalvular pressure gradient is evaluated for each case as the difference between the left-ventricular pressure (0.1 cm below the annulus) and the aortic pressure (1.3 cm above the annulus) at the indicated points on each side of the valve. (B) Transvalvular pressure gradient across each valve. (C) Frequency domain from the DFT operations for t=0.1 to 0.3 s of the transvalvular pressure. High-resolution version of this figure is available in the SI Appendix.
Fig. 6.
Fig. 6.
Frequency analysis of force and strain information on the leaflets. (A1) Leaflet normal traction at peak opening (t=0.25 s). (A2) Integrated normal traction on the left coronary leaflet (LC). (A3) Frequency domain from the DFT operations for t=0.1 to 0.3 s of the integrated traction force. (B1) Leaflet maximum in-plane principal Green–Lagrange strain (MIPE) at peak opening (t=0.25 s) evaluated on the aortic side of the leaflets. (B2) MIPE at the center of the free edge on the left coronary leaflet. (B3) Frequency domain from the DFT operations for t=0.1 to 0.3 s of the MIPE. High-resolution version of this figure is available in the SI Appendix.
Fig. 7.
Fig. 7.
Frequency analysis of the leaflet displacement. Data are tracked on horizontal tracking curve H1 (A1A3) and vertical tracking curve V2 (B1B3) on the left coronary leaflet, as shown in Fig. 1C. A1 and B1 show the displacement magnitude visualization of the leaflet tracking curves throughout the t=0.1- to 0.3-s portion of the valve-opening period. Cut length denotes the length of each tracking curve. A2A3 and B2B3 show the 3D view and 2D top view of the frequency domain visualization from the DFT operations for t=0.1 to 0.3 s of the displacement magnitude data, respectively. The data below 20 Hz are excluded for the computation of the flutter signal energy. High-resolution version of this figure is available in the SI Appendix.
Fig. 8.
Fig. 8.
Quantified results of the flutter signal energy for tracking curves H1 (Left) and V2 (Right). ELCleaflet indicates the signal energy on the left coronary leaflet for a single cardiac cycle. ERCleaflet and ENCleaflet indicate the signal energy on the right coronary and noncoronary leaflets, respectively. H1 and V2 indicate the free edge and the central vertical tracking curve on the leaflets, respectively, as shown in Fig. 1C.

References

    1. Nkomo V. T., et al. , Burden of valvular heart diseases: A population-based study. Lancet 368, 1005–1011 (2006.) - PubMed
    1. Soares J. S., et al. , Biomechanical behavior of bioprosthetic heart valve heterograft tissues: Characterization, simulation, and performance. Cardiovasc. Eng. Technol. 7, 309–351 (2016). - PMC - PubMed
    1. Vesely I., The evolution of bioprosthetic heart valve design and its impact on durability. Cardiovasc. Pathol. 12, 277–286 (2003). - PubMed
    1. Ishihara T., Ferrans V. J., Boyce S. W., Jones M., Roberts W. C., Structure and classification of cuspal tears and perforations in porcine bioprosthetic cardiac valves implanted in patients. Am. J. Cardiol. 48, 665–678 (1981). - PubMed
    1. Pomar J. L., Bosch X., Chaitman B. R., Pelletier C., Grondin C. M.. Late tears in leaflets of porcine bioprostheses in adults. Ann. Thorac. Surg. 37, 78–83 (1984). - PubMed

Publication types