. 2020 Jul 24;11(1):3730.
doi: 10.1038/s41467-020-17489-7.

Long-lasting severe immune dysfunction in Ebola virus disease survivors

Collaborators, Affiliations

Long-lasting severe immune dysfunction in Ebola virus disease survivors

Aurélie Wiedemann et al. Nat Commun. .

Abstract

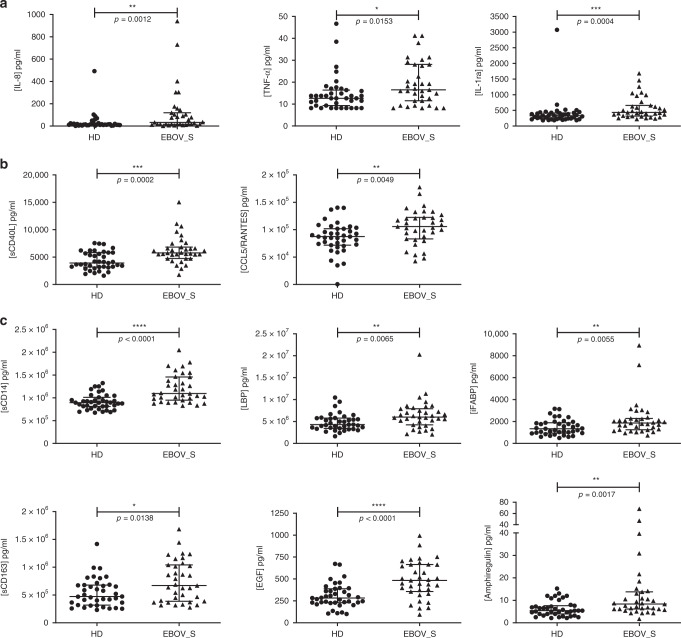
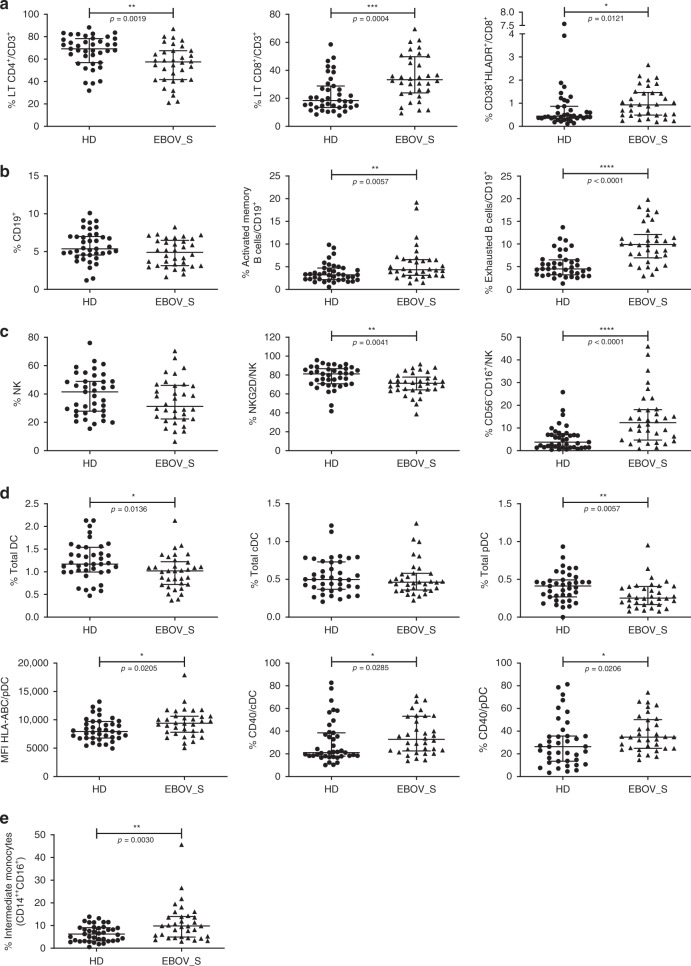
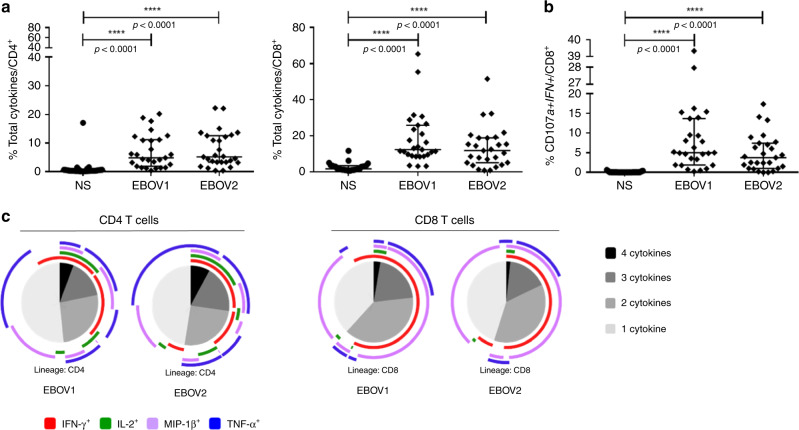
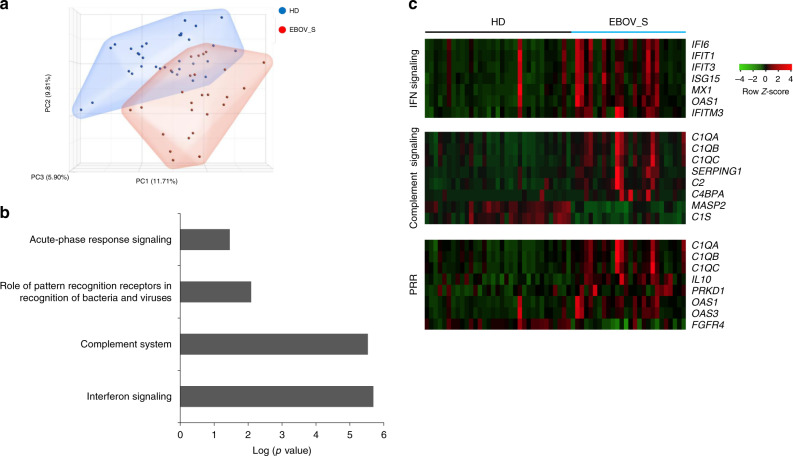
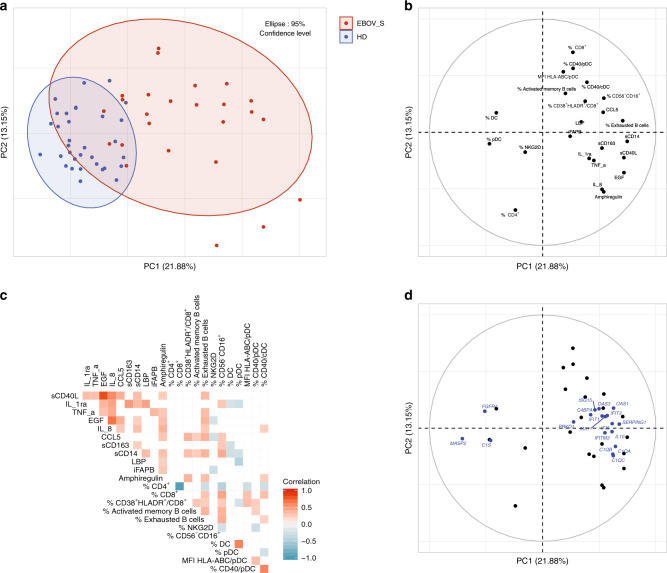
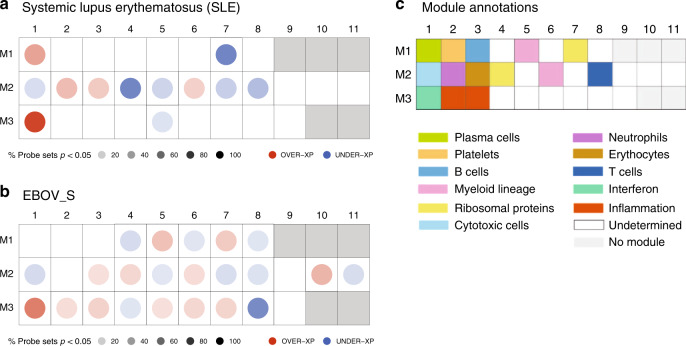
Long-term follow up studies from Ebola virus disease (EVD) survivors (EBOV_S) are lacking. Here, we evaluate immune and gene expression profiles in 35 Guinean EBOV_S from the last West African outbreak, a median of 23 months (IQR [18-25]) after discharge from treatment center. Compared with healthy donors, EBOV_S exhibit increases of blood markers of inflammation, intestinal tissue damage, T cell and B cell activation and a depletion of circulating dendritic cells. All survivors have EBOV-specific IgG antibodies and robust and polyfunctional EBOV-specific memory T-cell responses. Deep sequencing of the genes expressed in blood reveals an enrichment in 'inflammation' and 'antiviral' pathways. Integrated analyses identify specific immune markers associated with the persistence of clinical symptoms. This study identifies a set of biological and genetic markers that could be used to define a signature of "chronic Ebola virus disease (CEVD)".


Conflict of interest statement

The authors declare no competing interests.

Figures

Fig. 1
Fig. 1. Quantification of serum-soluble mediators differentially expressed in HDs and EBOV_S.
Measurement of serum-soluble mediators (pg/ml) from n = 39 HDs and n = 35 EBOV_S with the Bio-Plex 200 SystemTM (Bio-Rad). Pro-inflammatory and anti-inflammatory cytokines (a). Markers of T cell function (b). Markers of gastric tissue integrity (c). The differences between HDs and EBOV_S were evaluated in nonparametric Mann–Whitney U tests. Median values ± IQR are shown. Source data are provided as a Source Data file.
Fig. 2
Fig. 2. Modifications in immune cell subset frequencies in EBOV_S.
Cumulative T cell frequency and CD8 T cell activation analyses (a), B cell subsets (b), NK cell subsets (c), dendritic cell subsets and activation (d), and monocyte subsets (e) from n = 34 EBOV_S and n = 39 HDs. DC gating strategy is shown in Supplementary Fig. 4. The differences between HDs and EBOV_S were evaluated with nonparametric Mann–Whitney U tests. Median values ± IQR are shown. Source data are provided as a Source Data file.
Fig. 3
Fig. 3. Robust and polyfunctional responses in EBOV_S.
EBOV GP-specific CD4+ T cell (left panel) and CD8+ T cell (right panel) responses of EBOV_S (n = 27) after 9 days of EBOV GP-specific (EBOV1 and EBOV2 peptide pools) T cell expansion in vitro (all cytokines) (a). Analysis of the co-expression of CD107a and IFN-γ by EBOV GP-specific CD8 T cells from EBOV_S (n = 27) after 9 days of antigen-specific T cell expansion in vitro (b). Median values ± IQR are shown, and Friedman’s test was used for comparisons. Functional composition of EBOV GP-specific CD4+ and CD8+ T cell responses (c). Responses are color coded according to the combinations of cytokines produced. The arcs identify cytokine-producing subsets (IFN-γ, IL-2, MIP-1β, and TNF) within the CD4+ and CD8+ T cell populations. Source data are provided as a Source Data file.
Fig. 4
Fig. 4. Enrichment of genes associated with inflammation and antiviral response in EBOV_S.
Unsupervised principal component analysis (PCA) of EBOV_S (n = 26) and HDs (n = 33). EBOV_S are indicated in red and HDs in blue (a). Ingenuity Pathway software analysis of the genes involved in immune responses differentially expressed in EBOV_S and HDs (b). Heatmap of genes from the main pathways associated with differentially expressed genes in EBOV_S and HDs, including IFN signaling, the complement system and PRR signaling pathways. Each column depicts one subject (HD or EBOV_S) (c).
Fig. 5
Fig. 5. Persistence of innate immunity dysfunction in EBOV_S.
Unsupervised principal component analysis of serum-soluble mediators and cell phenotypic data, including n = 26 EBOV_S and n = 33 HDs. EBOV_S are indicated in red and HDs in blue (a). Variables used for the construction of the components (b). Spearman’s correlation matrix between serum-soluble mediators and cell phenotypes from n = 39 HDs and n = 34 EBOV_S. Colors indicated Spearman’s correlation coefficient. Only significant correlations (p < 0.05) are represented (unadjusted for test multiplicity) (c). Unsupervised PCA including genes (blue) from the main pathways associated with differentially expressed genes in EBOV_S and HDs, including IFN signaling, the complement system and PRR signaling pathways (d).
Fig. 6
Fig. 6. Similarities between EBOV_S and SLE and acute EBOV immune signatures.
Mapping global transcriptional changes with the use of Chaussabel’s modules for which at least 15% of the transcripts are significantly changed between controls (n = 12) and patients with SLE (n = 22) (a) or HDs (n = 33) and EBOV_S (n = 26) (p value <0.05 for the Mann–Whitney/Wilcoxon’s test) (b). Module annotations (c). Spots indicate the proportion of genes significantly changed for each module (p value <0.05 for SLE as per Chaussabel et al., fold change >1.5, and FDR <0.05 for EBOV_S). Coordinates indicate module ID (e.g., M2.8 is row M2, column 8). Overexpressed modules are indicated in red and underexpressed modules are indicated in blue, in comparison to control groups. Functional interpretation is indicated on a grid by a color code.

References

    1. WHO. Ebola Data and Statistics. Situation Summary.http://apps.who.int/gho/data/view.ebola-sitrep.ebola-summary-20160511?la... (2016).
    1. Baize S, et al. Emergence of Zaire Ebola virus disease in Guinea. N. Engl. J. Med. 2014;371:1418–1425. - PubMed
    1. Etard J-F, et al. Multidisciplinary assessment of post-Ebola sequelae in Guinea (Postebogui): an observational cohort study. Lancet Infect. Dis. 2017;17:545–552. - PubMed
    1. Group PIS, et al. A longitudinal study of Ebola sequelae in Liberia. N. Engl. J. Med. 2019;380:924–934. - PMC - PubMed
    1. Msellati P, et al. Revival after Ebola: multidisciplinary assessment at 1 year, prospect and follow-up study of surviving patients from Ebola in Guinea (PostEboGui cohort)] Bull. Soc. Pathol. Exot. 2016;109:236–243. - PubMed

Publication types

MeSH terms