. 2020 Jul 24;11(1):3715.
doi: 10.1038/s41467-020-17492-y.

Single-cell transcriptomic analysis in a mouse model deciphers cell transition states in the multistep development of esophageal cancer

Affiliations

Single-cell transcriptomic analysis in a mouse model deciphers cell transition states in the multistep development of esophageal cancer

Jiacheng Yao et al. Nat Commun. .

Abstract

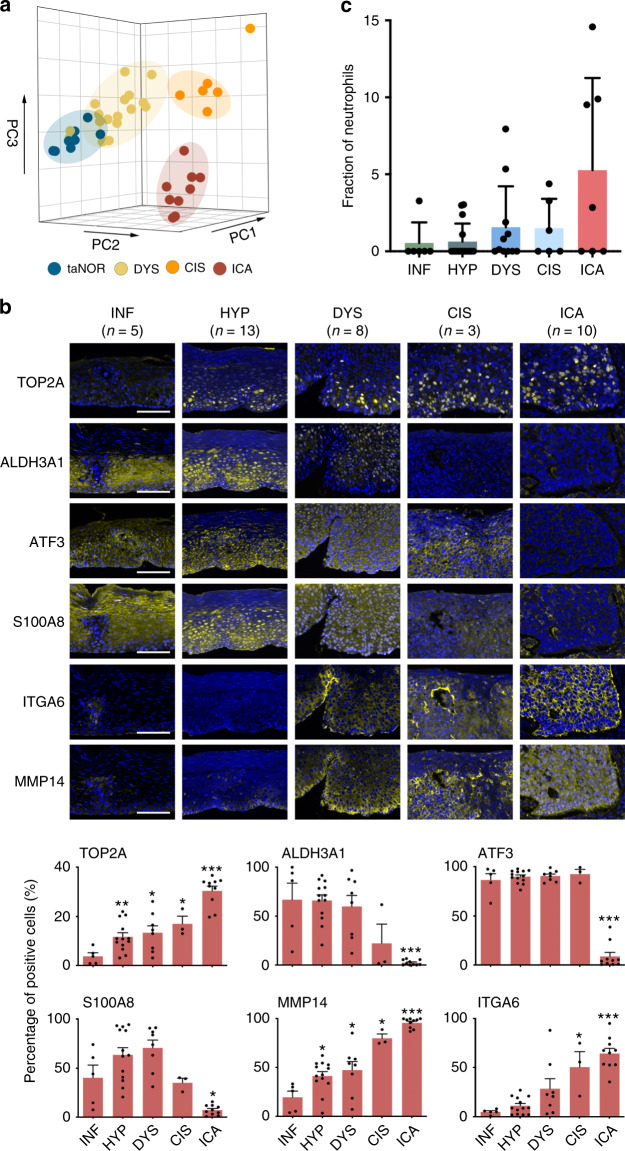
Esophageal squamous cell carcinoma (ESCC) is prevalent in some geographical regions of the world. ESCC development presents a multistep pathogenic process from inflammation to invasive cancer; however, what is critical in these processes and how they evolve is largely unknown, obstructing early diagnosis and effective treatment. Here, we create a mouse model mimicking human ESCC development and construct a single-cell ESCC developmental atlas. We identify a set of key transitional signatures associated with oncogenic evolution of epithelial cells and depict the landmark dynamic tumorigenic trajectories. An early downregulation of CD8+ response against the initial tissue damage accompanied by the transition of immune response from type 1 to type 3 results in accumulation and activation of macrophages and neutrophils, which may create a chronic inflammatory environment that promotes carcinogen-transformed epithelial cell survival and proliferation. These findings shed light on how ESCC is initiated and developed.


Conflict of interest statement

The authors declare no competing interests.

Figures

Fig. 1
Fig. 1. Experimental design of RNA-seq on 4NQO-induced esophageal lesions in mice.
a Induction of esophageal precancerous and cancerous lesions in mice. Mice were treated with 4NQO in drinking water (100 μg/ml) for 16 weeks and then kept without 4NQO treatment for another 10 weeks (upper panel). Mice were killed before (week 0), during (week 12) and after treatment (weeks 20, 22, 24, or 26), respectively. Hematoxylin–eosin (H&E) staining and immunohistochemistry (IHC) analysis of Mki67 on esophageal epithelium slides clearly identified six different pathological lesions, i.e., normal (NOR), inflammation (INF), hyperplasia (HYP), dysplasia (DYS), carcinoma in situ (CIS), and invasive carcinoma (ICA) (lower panel). Similar staining results were observed in over three visual fields from each stage of esophageal lesions (more staining image in Supplementary Fig. 2d). Scale bar, 100 μm. b Plot of principal component analysis (PCA) of mini-bulk tissue RNA-seq on different pathological lesions indicated by different colors. M month of mouse age. c Overview of the experimental design of scRNA-seq. Pathological lesions of the esophagus were dissected and digested into single-cell suspensions for further separation using FITC-CD45 antibody via FACS (1–4). CD45+ and CD45 cells whose numbers in different lesions are shown on right panel were scRNA-sequenced, respectively.
Fig. 2
Fig. 2. Distinct epithelial cell populations and their expression signatures.
a tSNE plot of 1756 epithelial cells based on their different expression. b Heatmap showing pathway activities scored per cluster by GSVA. c Stacked histogram showing epithelial cell composition across the six pathological stages. d Diffusion map of all epithelial cells using the first two diffusion components. Dot represents single cell and arrows indicate five branches starting from stage NOR to the other stages. e Histograms of scale normalized expression levels of six representative genes in each pathological stage. f Left: IHC staining of protein levels produced by the six genes in mouse esophageal tissues with different lesion. Scale bars, 100 μm. Right: stacked histograms showing quantification of IHC staining scores (0, negative; 1+, weak positive; 2+, median positive; 3+, strong positive). Each column was summarized from at least three visual fields.
Fig. 3
Fig. 3. Characterization of epithelial cell transitions and key pathway changes.
a Pseudotime trajectory over epithelial cells in a two-dimensional statespace. Cell orders are inferred from the expression of the most dispersed genes across epithelial cell populations. b Violin plots of the distribution of the component 1 values across epithelial clusters. c Correlation between EMT pathway enrichment scores and component 1 values of single cells. d Normalized expression of six selected ESCC driver genes, methylation dysregulation genes, and transcription factors, smoothed over pseudotime component 1 using LOESS regression. Shaded regions indicate 95% confidence interval with a line indicating the mean gene expression. e Violin plots of the distribution of the component 2 values among sub-clusters. f Correlation between G2/M pathway enrichment scores and component 2 values of single cells. g Bubble plot showing expression levels of the genes related to response to 4NQO treatment across six cluster. Size of dots represents the percentage of cells expressing the gene; color scale shows the average expression level. h Heatmap displaying scale normalized expression level of genes in NF-κB signaling across the six epithelial clusters.
Fig. 4
Fig. 4. Identification of fibroblast clusters and their expression features.
a tSNE plot of 31,654 fibroblasts, colored by cluster. b Expression-based pathway activities scored by GSVA per fibroblast cluster. c Stacked histogram showing fibroblasts composition across the 6 pathological stages. d Line chart displaying changing trend of proportion of the four selected clusters across the six pathological stages. e Bubble plot showing scale normalized expression of representative genes involved in cytokine secretion, complement activity, and antigen presentation. Size of dots represents percentage of cells expressing corresponding genes in the cluster.
Fig. 5
Fig. 5. Characterization of multiple changes in T cell subtypes.
ac tSNE plots of 8032 T cells, 3812 CD8+ T cells, and 2635 CD4+ T cells. Color indicates cluster. d Histogram showing CD8+ T cell composition across the six pathological stages. Color indicates cluster designated in b. e Violin plots of marker gene expression among CD8+ T cell clusters. f Histogram showing CD4+ T cell composition across the six pathological stages. Color indicates cluster designated in c. g Line chart displaying changing trend of the four selected cluster proportions across the six pathological stages. h Bubble plot showing scale normalized expression of three representative genes involved in type 1, 2, and 3 immune response, respectively, from stage INF to stage ICA. Size of dots represents percentage of cells expressing corresponding genes in the stage.
Fig. 6
Fig. 6. Compositional changes of myeloid cells and their interactions with other cells.
a tSNE plots of 6177 myeloid cells, colored by cluster. b Histogram showing myeloid cells composition across the six pathological stages. Color indicates cluster designated in a. c Line chart displaying changing trend of the five selected cluster proportions across the six pathological stages. d Heatmap showing scale normalized expression of the immune co-stimulation (left panel) or suppression (right panel) genes in the 11 clusters of myeloid cells. e Heatmap showing scale normalized expression of selected Ccl and Cxcl chemokines, and their corresponding receptors in representative clusters of epithelial cells, fibroblasts, myeloid cells, and T cells. f Bubble plot showing scale normalized expression of the selected genes along tumorigenesis process in various cell types. Size of dots represents percentage of cells expressing corresponding genes across pathological stages.
Fig. 7
Fig. 7. Validation of expression features in human epithelial tissues with different lesions.
a PCA plot of mini-bulk tissue RNA-seq on human esophageal tissues with different lesions as indicated by different colors and each dot represents a sample. b Immunofluorescence image (upper panel; scale bar, 100 μm) and quantification of selected gene expression levels (lower panel) for human epithelia tissue samples with different lesions. Independent samples from stage INF to ICA are n = 5, 13, 8, 3, and 10, respectively. Data represent mean ± S.E.M. *P < 0.05, **P < 0.01, ***P < 0.001, ****P < 0.0001 for two-sided Wilcoxon rank-sum test, compared with stage INF. P-values for TOP2A: 0.0098 (HYP), 0.0295 (DYS), 0.0357 (CIS), 0.0007 (ICA); ALDH3A1: 0.0007 (ICA); ATF3: 0.0007 (ICA); S100A8: 0.0127 (ICA); MMP14: 0.0140 (HYP), 0.0451 (DYS), 0.0357 (CIS), 0.0007 (ICA); ITGA6: 0.0357 (CIS), 0.0007 (ICA). c Proportion of neutrophils (relative to stage INF) in different precancerous and cancerous lesions based on bulk tissue RNA-seq using CIBERSORT. Each dot represents a sample, data represent mean ± S.D. P = 0.066, determined by two-sided Mantel–Haenszel chi-square test for linear trend. Independent patient samples from stage INF to ICA are n = 6, 15, 11, 6 and 7, respectively.

References

    1. Chen XX, et al. Genomic comparison of esophageal squamous cell carcinoma and its precursor lesions by multi-region whole-exome sequencing. Nat. Commun. 2017;8:524. - PMC - PubMed
    1. Chang J, et al. Genomic analysis of oesophageal squamous-cell carcinoma identifies alcohol drinking-related mutation signature and genomic alterations. Nat. Commun. 2017;8:15290. - PMC - PubMed
    1. Gao Y, et al. Genetic landscape of esophageal squamous cell carcinoma. Nat. Genet. 2014;46:1097–1102. - PubMed
    1. Martincorena I, et al. Somatic mutant clones colonize the human esophagus with age. Science. 2018;362:911–917. - PMC - PubMed
    1. Navin N, et al. Tumour evolution inferred by single-cell sequencing. Nature. 2011;472:90–94. - PMC - PubMed

Publication types

MeSH terms

Substances