. 2020 Jul 24;11(1):3723.
doi: 10.1038/s41467-020-17531-8.

DNA sequence-dependent activity and base flipping mechanisms of DNMT1 regulate genome-wide DNA methylation

Affiliations

DNA sequence-dependent activity and base flipping mechanisms of DNMT1 regulate genome-wide DNA methylation

Sabrina Adam et al. Nat Commun. .

Abstract

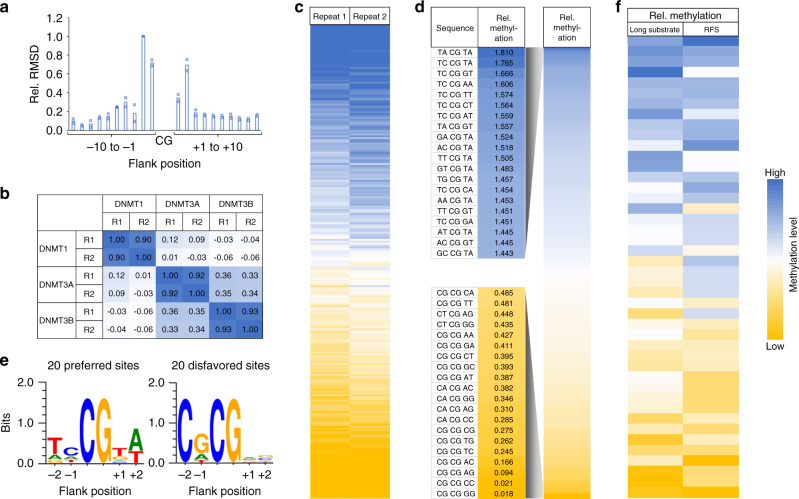
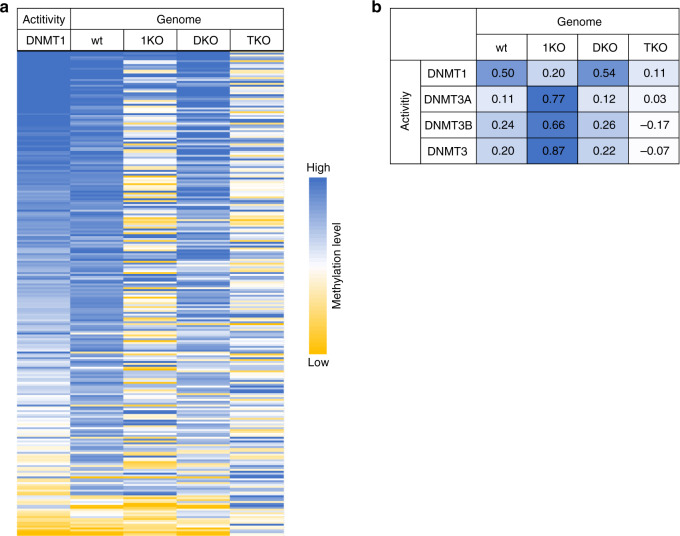
DNA methylation maintenance by DNMT1 is an essential process in mammals but molecular mechanisms connecting DNA methylation patterns and enzyme activity remain elusive. Here, we systematically analyzed the specificity of DNMT1, revealing a pronounced influence of the DNA sequences flanking the target CpG site on DNMT1 activity. We determined DNMT1 structures in complex with preferred DNA substrates revealing that DNMT1 employs flanking sequence-dependent base flipping mechanisms, with large structural rearrangements of the DNA correlating with low catalytic activity. Moreover, flanking sequences influence the conformational dynamics of the active site and cofactor binding pocket. Importantly, we show that the flanking sequence preferences of DNMT1 highly correlate with genomic methylation in human and mouse cells, and 5-azacytidine triggered DNA demethylation is more pronounced at CpG sites with flanks disfavored by DNMT1. Overall, our findings uncover the intricate interplay between CpG-flanking sequence, DNMT1-mediated base flipping and the dynamic landscape of DNA methylation.


Conflict of interest statement

The authors declare no competing interests.

Figures

Fig. 1
Fig. 1. Deep enzymology methylation data of the hemimethylated 349 bp substrate.
a Time course of the overall methylation levels. b Time dependence of the methylation profile of the 44 CpG sites. c Enrichment and depletion of individual bases at different flanking positions in the most preferred and most disfavored CpG sites in (b). d Single molecule analysis showing the fraction of DNA molecules with different number of methylated CpG sites. The bars in (a), (b), and (d) display the average of two independent experiments. Source data are provided as a Source Data file.
Fig. 2
Fig. 2. Fitting of the experimental methylation data reveals a processive methylation mechanism.
Schematic drawing of the kinetics models of the DNA methylation mechanism of DNMT1 used for fitting of experimental data. We used a purely distributive model (Model 1, a) or a mixed model including distributive and processive methylation (Model 2, b). The corresponding reactions are indicated below the schemes. Comparison of the experimental data (colored areas) and best fit (colored lines) for the distributive (c) and mixed (d) models. Model parameters after fitting for the distributive (e) and mixed (f) models. AIC, Akaike Information Criterion.
Fig. 3
Fig. 3. Deep enzymology analysis of the flanking sequence preferences of DNMT1.
a Relative base preferences of DNMT1 at the −10 to +10 flanking positions surrounding the CpG site. The numbers refer to the root mean squared deviations (RMSD) of the observed/expected base composition at each site among the methylated sequence reads, normalized to the highest effect observed at position −2. The bars show averages of two independent experiments. b Methylation levels were obtained from two experimental repeats (R1 and R2), averaged for all NNCGNN flanking sites and the Pearson correlation coefficients (r values) of the pairwise comparison of the data sets were determined. DNMT3A and DNMT3B data were taken from our previous study for comparison. c The methylation levels of NNCGNN sites of both repeats of the DNMT1 methylation reaction displayed as heatmap to show the strong correlation of both data sets (see also Supplementary Fig. 3b). d Heatmap of the methylation levels of NNCGNN flanking sites ordered by decreasing DNMT1 activity. The outlines show the 20 most favored or disfavored flanking sites. e Sequence logos of the 20 flanking sites most favored or disfavored by DNMT1. f Comparison of the NNCGNN methylation levels determined for the 44 CpG sites on the long substrate (long substrate) with the methylation levels determined for the corresponding NNCGNN sites in random flank library methylation experiment (random flank substrate—RFS). The image shows the methylation levels of individual NNCGNN sites as heatmap. The p value of the correlation is 1.25 × 10−4. The p value is based on the Pearson correlation coefficient (r-factor) and the Z-statistics of the distribution of r-factors determined after randomization of one of the data sets. See also Supplementary Fig. 4b for a box plot comparison. Source data are provided as a Source Data file.
Fig. 4
Fig. 4. Structural analysis of the murine DNMT731–1602-DNA complexes.
a Structural overlay of the CCG and ACG complexes (this study) and the GCG complex (PDB 4DA4) with the catalytic helix highlighted in expanded view. The disordered regions N-terminal to the catalytic helix are shown as dashed lines in the respective CCG and ACG complexes. The AdoHcy molecule is shown in sphere representation. b Structural overlay of the CCG DNA, ACG DNA and GCG DNA in DNMT1-bound form. The color scheme is the same as in (a). Schematic views of the DNMT1- bound DNAs in the GCG complex (c), adopted from a previous report, and ACG (d) and CCG (e) complexes. Close-up comparison of the protein-DNA interactions at the CpG sites between the GCG (f), ACG (g) and CCG (h) complexes. The 5-methyl group of the mC6 is shown as green sphere. The hydrogen-bonding and electrostatic interactions are shown as dashed lines in red and black, respectively. Note that in the ACG complex, the side chain of R1237 is non-traceable due to missing electron density.
Fig. 5
Fig. 5. Conformational transition of the catalytic helix of murine DNMT1.
Close-up views of the conformation of the catalytic helix in the GCG (PDB 4DA4) (a), ACG (b), and CCG (c) complexes. The side chains of the DNA-interacting residues R1241 and Y1243 are shown in stick representation in the GCG complex (a). These two residues are either completely (in the ACG complex) or partially (CCG complex) non-traceable in the other two complexes. The hydrogen-bonding interaction is shown as dashed line in red. The minor groove width at the +2 flank sites (C4′/A4′) is indicated by dashed lines in black. The disordered segments in (b) and (c) are shown by dashed lines in slate and cyan, respectively. Close-up view of the catalytic helix overlaid between a DNMT1 structure with no DNA bound to the catalytic domain (PDB 3PT9) and the CCG complex (d) or the ACG complex (e). Fo-Fc omit map of residues 1242–1249 of mDNMT1731–1602 in the GCG DNA complex (PDB 4DA4). The straight conformation and associated map (2.0 σ level) are colored in silver and magenta, respectively. The kinked conformation and associated map (1.9 σ level) are colored in aquamarine and green, respectively. Enlargement of the AdoMet-binding pockets in the GCG (g), CCG (h) and ACG (i) complexes. The distances between the N7 atom of AdoHcy (SAH) and the side chain or the backbone of residue K1247 are indicated by dashed lines. Note that the side chain of K1247 is non-traceable in (hi) due to missing electron density.
Fig. 6
Fig. 6. Comparison of DNMT1 flanking preferences with genomic DNA methylation.
a Correlation of the DNMT1 flanking sequence preference (DNMT1) with genome-wide CpG methylation patterns in human cells (Genome) determined by whole genome bisulfite analysis in human ES cells. The top image shows the average methylation levels of CpG sites with different NNCGNN flanks as heatmap. The p value of the correlation is 6.77 × 10−13. The lower image shows a box plot of the genomic methylation levels of CpG sites in defined ranges of DNMT1 preferences. The lines show the medians, the boxes show the 1st and 3rd quartile and the whiskers display the data maximum and minimum. b Correlation of the DNMT1 flanking sequence preference (DNMT1) with genome-wide CpG methylation patterns (Genome) determined by reduced representation genome bisulfite analysis in lung cancer cells. The image shows the average methylation levels of CpG sites with different NNCGNN flanks as heatmaps and the corresponding box plot as described in (a). The p value of the correlation is 1.98 × 10−10. c Anticorrelation of the DNMT1 flanking sequence preference with genome-wide CpG demethylation after treatment of lung cancer cell with 5-azacytidine. The image shows the DNMT1 preferences of NNCGNN flanks (DNMT1) and average levels of genome demethylation of CpG sites in NNCGNN flanks (Genome) as heatmaps and the corresponding box plot. Relative DNA demethylation is calculated as Δmethylation/initial methylation. The p value of the anticorrelation is 7.63 × 10−5. The p values of (anti)correlations in (ac) were based on the Pearson correlation coefficients (r-factor) and the Z-statistics of the distribution of r-factors determined after randomization of one of the data sets. Source data are provided as a Source Data file.
Fig. 7
Fig. 7. Comparison of DNMT1 flanking sequence preferences with genomic DNA methylation.
a Correlation of the DNMT1 NNCGNN flanking sequence preferences (Activity DNMT1) with average genome-wide methylation levels of CpG sites in NNCGNN flanking contexts (Genome). Genomic methylation data were determined by whole genome bisulfite analysis in wild type mouse ES cells (wt), DNMT1 knock-out ES cells (1KO), DNMT3A/DNMT3B double knock-out ES cells (DKO) and DNMT1/DNMT3A/DNMT3B triple knock-out ES cells (TKO). The image shows the average methylation levels of individual NNCGNN sites as heatmaps. b Pearson correlation factors of the NNCGNN genome methylation patterns (Genome) of the different mouse ES cell lines with the flanking sequence preferences (Activity) of DNMT1, DNMT3A and DNMT3B (Fig. 3b) and an average of DNMT3A and DNMT3B (DNMT3). DNMT3A and 3B flanking preferences were taken from Gao et al..

References

    1. Jones PA. Functions of DNA methylation: islands, start sites, gene bodies and beyond. Nat. Rev. Genet. 2012;13:484–492. - PubMed
    1. Schubeler D. Function and information content of DNA methylation. Nature. 2015;517:321–326. - PubMed
    1. Jeltsch A, Broche J, Bashtrykov P. Molecular processes connecting DNA methylation patterns with DNA methyltransferases and histone modifications in mammalian genomes. Genes. 2018;9:566. - PMC - PubMed
    1. Jabbari K, Bernardi G. Cytosine methylation and CpG, TpG (CpA) and TpA frequencies. Gene. 2004;333:143–149. - PubMed
    1. Okano M, Xie S, Li E. Cloning and characterization of a family of novel mammalian DNA (cytosine-5) methyltransferases. Nat. Genet. 1998;19:219–220. - PubMed

Publication types

MeSH terms