. 2020 Jul 24;11(1):3726.
doi: 10.1038/s41467-020-17127-2.

Combining PARP with ATR inhibition overcomes PARP inhibitor and platinum resistance in ovarian cancer models

Affiliations

Combining PARP with ATR inhibition overcomes PARP inhibitor and platinum resistance in ovarian cancer models

Hyoung Kim et al. Nat Commun. .

Abstract

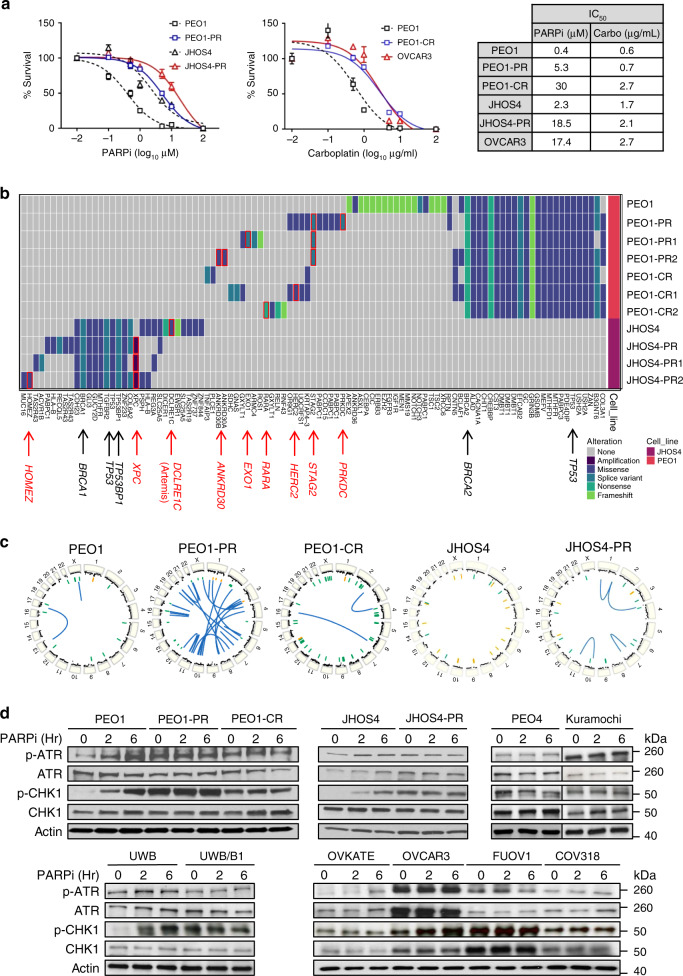
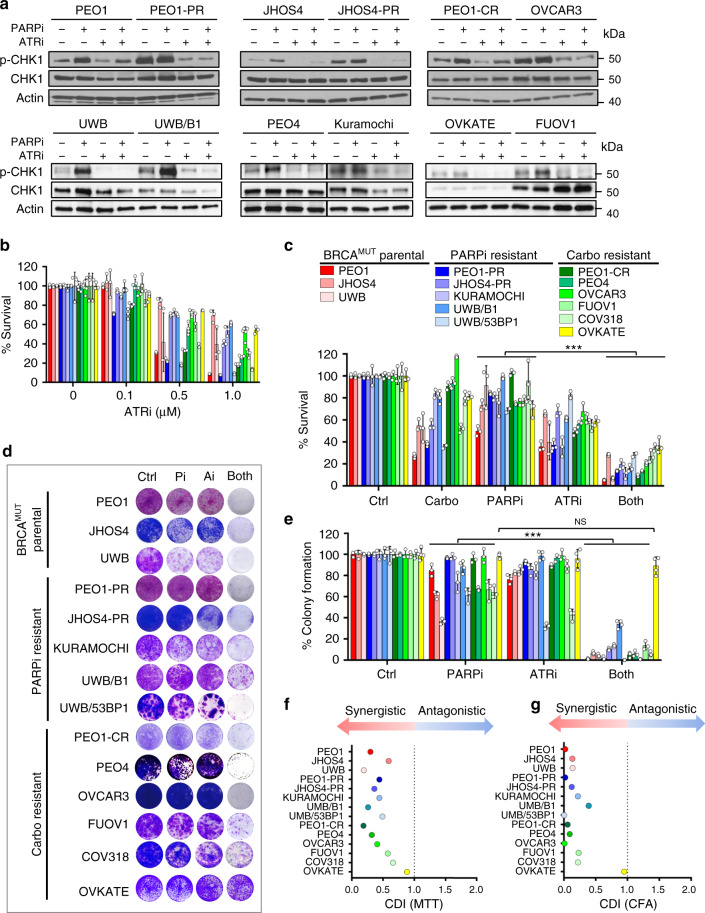
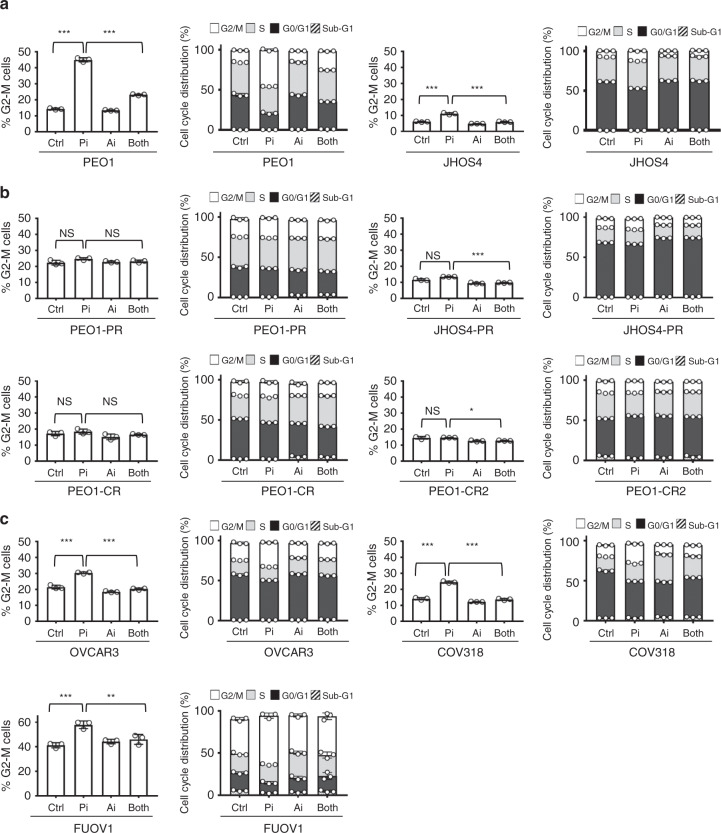
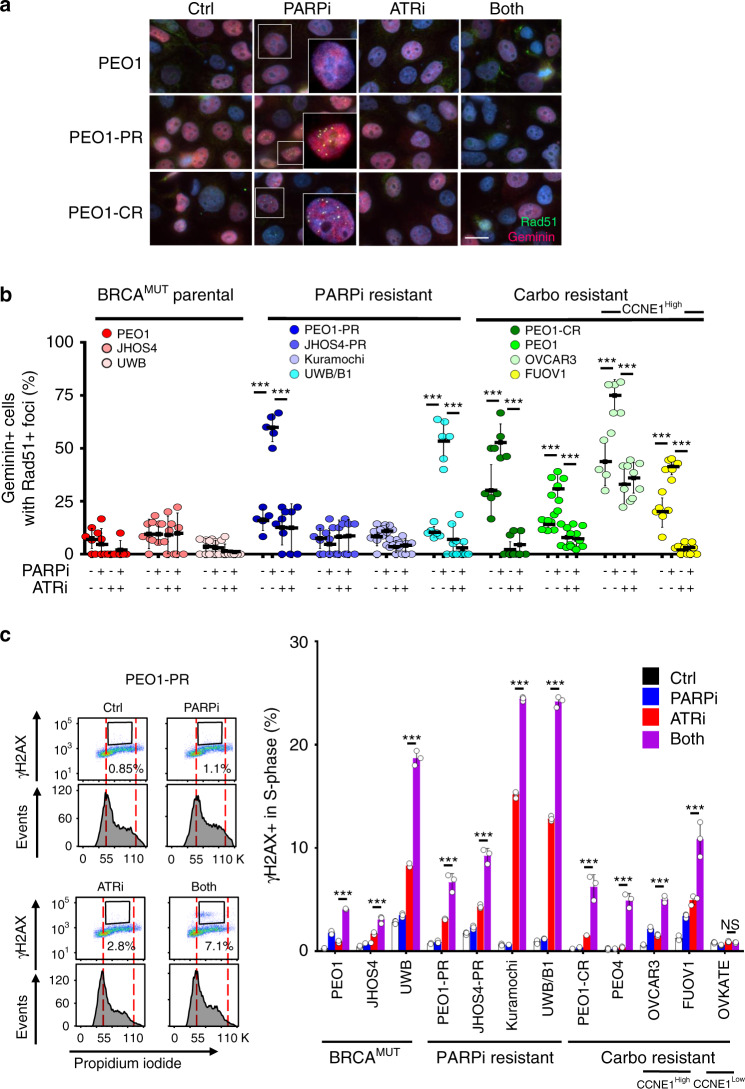
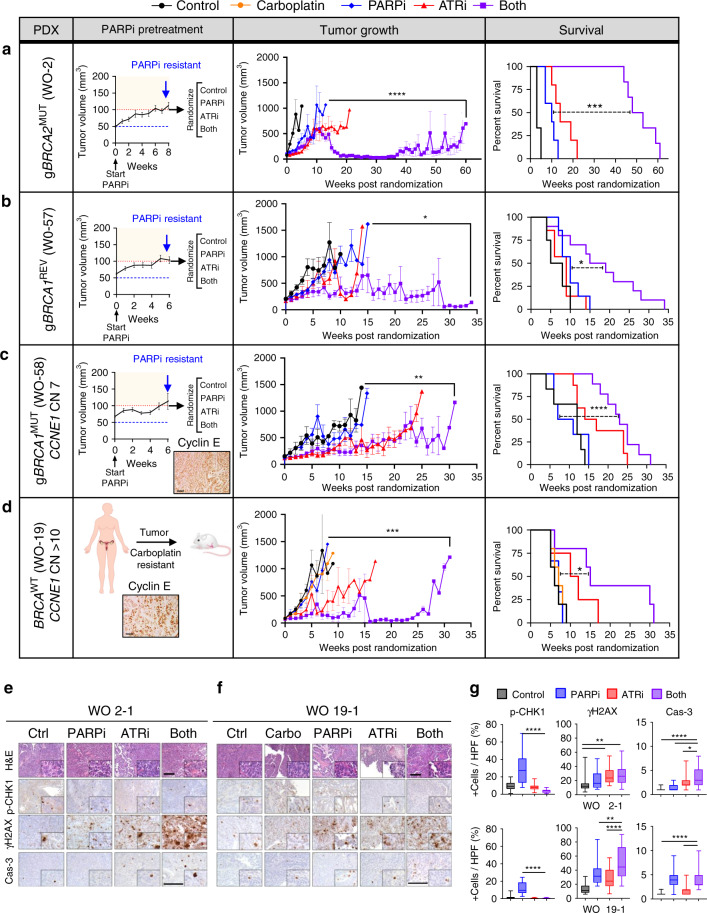
Ovarian cancer (OVCA) inevitably acquires resistance to platinum chemotherapy and PARP inhibitors (PARPi). We show that acquisition of PARPi-resistance is accompanied by increased ATR-CHK1 activity and sensitivity to ATR inhibition (ATRi). However, PARPi-resistant cells are remarkably more sensitive to ATRi when combined with PARPi (PARPi-ATRi). Sensitivity to PARPi-ATRi in diverse PARPi and platinum-resistant models, including BRCA1/2 reversion and CCNE1-amplified models, correlate with synergistic increases in replication fork stalling, double-strand breaks, and apoptosis. Surprisingly, BRCA reversion mutations and an ability to form RAD51 foci are frequently not observed in models of acquired PARPi-resistance, suggesting the existence of alternative resistance mechanisms. However, regardless of the mechanisms of resistance, complete and durable therapeutic responses to PARPi-ATRi that significantly increase survival are observed in clinically relevant platinum and acquired PARPi-resistant patient-derived xenografts (PDXs) models. These findings indicate that PARPi-ATRi is a highly promising strategy for OVCAs that acquire resistance to PARPi and platinum.


Conflict of interest statement

The following authors declare competing interests. F.S. serves on the scientific advisory board for AstraZeneca (unpaid). E.J.B. serves on the scientific advisory board of Atrin Pharmaceuticals and has been an advisor for Sierra Oncology. RAG has consulted for Agios Pharmaceuticals and MoMa Therapeutics. V.E.V. is a founder of Personal Genome Diagnostics, a member of its Scientific Advisory Board and Board of Directors, and owns Personal Genome Diagnostics stock, which are subject to certain restrictions under university policy. V.E.V. is an advisor to Takeda Pharmaceuticals. Within the last 5 years, V.E.V. has been an advisor to Daiichi Sankyo, Janssen Diagnostics, and Ignyta. R.B.S. is a founder of and holds equity in Delfi Diagnostics. He also serves as the Head of Data Sciences at Delfi Diagnostics. The terms for these arrangements for V.E.V. and R.B.S. has been reviewed and approved by the Johns Hopkins University in accordance with its conflict of interest policies. G.B.M. receives support or acts as a consultant for AstraZeneca, ImmunoMET, Ionis, Nanostring, PDX Pharmaceuticals, Signalchem Lifesciences, Symphogen, and Tarveda and has transferred technology to Myriad and Nanostring. The remaining authors declare no competing interests.

Figures

Fig. 1
Fig. 1. Drug-resistant cells acquire genetic alterations and increase ATR/CHK1 signaling.
a Drug-response curves of survival after PARPi (olaparib, left) and carboplatin (right) treatment in HR-deficient parental cells (PEO1, BRCA2MUT; JHOS4, BRCA1MUT), acquired PARPi-resistant cells (PEO1-PR; JHOS4-PR), and carboplatin-resistant cells (PEO1-CR, and OVCAR3 with CCNE1AMP) at 5 days. Nonlinear regression curve was generated using MTT data (dose–response inhibition). IC50 was calculated by Graph Pad Prism. The fitted midpoints (lC50) of the two curves statistically compared by Extra sum-of squares F test (one-way). Mean ± SD shown (n = 3 independent biological replicates per treatment; experiment repeated at least thrice). PEO1 vs PEO1-PR, P < 0.0001; JHOS4 vs JHOS4-PR, P < 0.0001; PEO1 vs PEO1-CR, P < 0.0001; PEO1 vs OVCAR3, P < 0.0001. b Heatmap of genes and structural alterations present in samples from parental BRCAMUT (JHOS4 and PEO1), acquired PARPi-resistant (PEO1-PR, PR1, PR2; JHOS4-PR, PR1, and PR2), and acquired carboplatin-resistant cell line (PEO1-CR, CR1, and CR2). Each column represents a separate alteration by either sequence or structural change, while each row represents a cell line. c Circos plots depict copy-number alterations as well as intra- and inter-chromosomal rearrangements. Focal amplifications in yellow, and focal deletions in green. Inter- and intra-chromosomal rearrangements in blue. d Parental (BRCAMUT PEO1, JHOS4, and UWB; CCNE1 copy normal, OVKATE), acquired PARPi-resistant (PEO1-PR and JHOS4-PR), de novo PARPi-resistant (PEO4, Kuramochi, and UWB/BRCA1+/−), and platinum-resistant cells (PEO1-CR; CCNE1Amp OVCAR3, FUOV1, and COV318) were treated with PARPi 1 μM and lysates were collected at 0, 2, 6 h. Cells were selected in PARPi or carboplatin and tested after a 10-day drug washout (except CCNE1AMP cells). Western blot for the indicated phospho and total proteins was performed. Representative data shown are one of three independent biological repeat experiments. Source data are provided as a source data file.
Fig. 2
Fig. 2. PARPi–ATRi treatment decreases cell viability and colony formation.
a Western analysis of ATR target, pCHK1/CHK1 in parental BRCAMUT (BRCA2MUT: PEO1; BRCA1MUT: JHOS4 and UWB), acquired PARPi-resistant (PEO1-PR, JHOS4-PR), de novo PARPi resistant (PEO4, Kuramochi, UWB/B1, B1 denotes BRCA1+/−), and platinum-resistant (PEO1-CR, PEO4; CCNE1Amp: OVCAR3, FUOV1 with OVKATE CCNE1 copy normal) cells after treatment with PARPi (1 μM), ATRi (1 μM), or Both. Representative of three independent biological assays is shown. Band density is normalized to corresponding Actin band (ImageJ). b Viability after ATRi treatment in parental BRCA mutant, PARPi-resistant cells, and carboplatin-resistant cells by MTT at 5 days. c Viability after treatment with carboplatin (1 μg/ml all lines), PARPi (0.1 μM: UWB, UWB/B1, COV318; 0.5 μM: PEO1, PEO4, OVCAR3, FUOV1, JHOS4-PR; 1 μM: PEO1-PR, PEO1-CR, JHOS4, UWB/53BP1, Kuramochi, and OVKATE), ATRi (0.1 μM, UWB/53BP1; 0.5 μM: PEO1, PEO1-CR, JHOS4, COV318, PEO4, PEO1-PR JHOS4-PR, Kuramochi, FUOV1; 1 μM: OVCAR3, UWB, UWB/B1, OVKATE) assessed by MTT at 5 days. Viability in PARPi–ATRi group was lower than PARPi monotherapy for all lines (COV318, OVKATE, P = 0.0006, other lines ***P < 0.0001), and ATRi monotherapy for all lines (UWB, Kuramochi, COV318, P = 0.04; OVKATE, P = 0.008; FUOV1, P = 0.0003; remaining lines, P < 0.0001). d, e Colony formation (CF) after treatment with lowest doses demonstrating synergy for PARPi (0.1 μM: PEO1, JHOS4, JHOS4-PR, OVCAR3, UWB, UWB/53BP1; 0.5 μM: PEO1-PR, PEO1-CR, PEO4, FUOV1, Kuramochi, OVKATE; 1 μM, COV318; 2 μM, UWB/B1), ATRi (0.1 μM: JHOS4, UWB, UWB/B1, UWB/53BP1, FUOV1; 0.25 μM, Kuramochi, COV318, OVKATE; 0.3 μM: PEO1-CR; 0.5 μM: PEO4, PEO1, PEO1-PR, JHOS4-PR, OVCAR3) and combination for 13 days; colonies quantified using ImageJ. CF for PARPi–ATRi was lower than PARPi (***P < 0.0001) or ATRi monotherapy for all lines (PARPi–ATRi vs ATRi, UWB 53BP1, P = 0.0003; remaining lines, P < 0.0001), except OVKATE (PARPi–ATRi vs PARPi P = 0.3035, PARPi–ATRi vs ATRi P = 0.5073). Data analyzed using one-way ANOVA followed by Tukey’s multiple-comparisons test with data shown as mean ± SD; n = 3 biologically independent samples. f, g Mean % survival and colony formation of a single representative experiment with three determinations was used to calculate coefficient of drug interaction (CDI). CDI < 1 indicated synergism, CDI < 0.7 significant synergism, CDI = 1 additivity, CDI > 1 antagonism. Source data are provided as a source data file.
Fig. 3
Fig. 3. Treatment effects on cell cycle in acquired PARPi and platinum-resistant cells.
ac Parental BRCAMUT (PEO1, JHOS4) (a), acquired PARPi and platinum-resistant (PEO-PR, JHOS4-PR, PEO1-CR, and PEO1-CR2) (b), and platinum-resistant CCNE1AMP (OVCAR3, COV318, and FUOV1) (c), cells were treated with PARPi (1 μM for PEO1, JHOS4, PEO-PR, JHOS4-PR, PEO1-CR, PEO1-CR2, and OVCAR3; 2 μM for COV318 and FUOV1) and ATRi (1 μM for all cell lines) monotherapy and their combination, and then evaluated for cell-cycle by flow cytometry; G2-M phase changes (left panel) and cell-cycle phase distribution at 24 h (right panel) are shown. In parental BRCA1/2MUT PARPi-sensitive cells, there was a significant increase in G2-M with PARPi treatment that was overcome with the addition of ATRi treatment (PEO1 and JHOS4, P < 0.0001 Control vs PARPi and PARPi vs Both). In platinum-resistant, CCNE1AMP (OVCAR3, COV318, and FUOV1) cells, there was a significant increase in G2-M with PARPi treatment that was overcome with the addition of ATRi (OVCAR3 and COV318, P < 0.0001 Control vs PARPi and PARPi vs Both; FUOV1, P = 0.0005 Control vs PARPi, P = 0.004 PARPi vs Both). In the acquired PARPi and platinum-resistant cells, effects of PARPi treatment on G2/M were insignificant (P > 0.05) and with the addition of ATRi, the effects on G2-M were less striking as in parental and CCNE1AMP lines (P > 0.05 except P < 0.0001 for JHOS4-PR and P = 0.01 for PEO1-CR2). The data are presented as mean ± SD (n = 3 biologically independent samples). Individual samples are presented as data points overlaying bar grafts. The data were analyzed with one-way ANOVA followed by Tukey’s test. ***P < 0.001, **P < 0.01, *P < 0.05, NS = not significant. Source data are provided as a source data file.
Fig. 4
Fig. 4. Drug effects on homologous recombination and DNA double-strand breaks.
ac Parental BRCAMUT (BRCA2MUT PEO1; BRCA1MUT JHOS4, UWB), PARPi-resistant (PEO1-PR, JHOS4-PR, Kuramochi, UWB/B1 where B1 denotes BRCA1+/−), and platinum-resistant (PEO1-CR, PEO4; CCNE1Amp OVCAR3, FUOV1) were treated with PARPi (1 μM), ATRi (1 μM), or combination for 24 h. a, b RAD51 (green) nuclear foci were detected in geminin positive (red) cells by immunofluorescence staining. Magnification is ×60 for large panel and ×100 for insert. Scale bar = 20 μm. b Cells with >5 foci in the nucleus were counted as a positive RAD51 cell. Each dot represents the mean number of events per high-power fields (n = 5 fields) with mean ± SD shown. RAD51 in PARPi group was higher than control for PEO1-PR (P < 0.0001), UWB/B1 (P < 0.0001), PEO4 (P < 0.0001), FUOV1 (P < 0.0001), PEO1-CR (P = 0.002), and OVCAR3 (P = 0.0003) lines, and RAD51 in PARPi–ATRi treatment group was lower than PARPi monotherapy for these cell lines (P < 0.0001). c Detection of γH2AX-positive cells in S phase of PARPi–ATRi-treated parental BRCAMUT, PARPi-resistant, and platinum-resistant cells. Cells were treated with 1 μM PARPi, 0.5 μM ATRi or combination, and JHOS4-PR and OVCAR3 were treated with 1 μM PARPi, 1 μM ATRi, or combination. After treatment for 24 h (JHOS4-PR 36 h), cells were fixed and stained with γH2AX and PI for flow cytometry, and γH2AX-positive cells in S phase were quantified. Representative images of PEO1-PR cells (left) and quantified data (right) were shown. γH2AX-positive cells in PARPi–ATRi group was higher than ATRi monotherapy for all cell lines (JHOS4, P = 0.0003; FUOV1, P = 0.0002; and remaining cells, P < 0.0001) except OVKATE, P = 0.3703). Data shown is mean ± SD (n = 3 biologically independent samples). Individual samples are presented as data points. Data was analyzed by one-way ANOVA test followed by Tukey’s multiple-comparisons test; ***P < 0.001, NS = not significant. Source data are provided as a source data file.
Fig. 5
Fig. 5. Combination PARPi–ATRi increases replication stress and apoptosis.
af Experimental design for replication fork analysis for parental BRCAMUT (PEO1), acquired PARPi and platinum-resistant (PEO1-PR, PEO1-CR, and JHOS4-PR), and platinum-resistant CCNE1AMP (OVCAR3) cells were pretreated with PARPi (1 μM), ATRi (1 μM), or combination for 30 min, subsequently pulse-labeled with CldU (red) followed by IdU (green) for 15 min each, in the continuous presence of inhibitors. b, c Replication fork speed as calculated by length of track/duration both pulses and >100 intact unidirectional tracks were counted. ATRi exposure attenuated fork speed compared with control (P < 0.0001, all lines). PARPi–ATRi further reduced fork speed compared with ATRi alone in all lines (PEO1-PR and JHOS4-PR, P < 0.0001; PEO1-CR, P = 0.02; OVCAR3, P = 0.04; PEO1, P = 0.03). d, e Fork asymmetry as calculated by long green/short green length of replication initiation tracks and >100 intact initiation tracks were counted for each condition. PARPi treatment produced asymmetric forks in parental cells (PEO1, P < 0.0001). ATRi caused an increase in fork asymmetry in all lines (PEO1, PEO1-PR, PEO1-CR, and OVCAR3, P < 0.0001; JHOS4-PR, P = 0.0102). ATRi with PARPi further increased asymmetric fork ratios in all models (PEO1-PR, JHOS4-PR, and OVCAR3, P < 0.0001; PEO1-CR, P = 0.005; PEO1, P = 0.01). Data shown are median ± 95% CI; n = 2 biological independent samples and two slides per condition counted for DNA combing. One-way ANOVA followed by nonparametric Kruskal–Wallis test for (c) and (e). f The coefficient of drug interaction (CDI) was calculated to determine drug interaction effects. CDI < 1 indicated synergism, CDI = 1 additivity, CDI > 1 antagonism (g, h). Cells treated with control, PARPi (1 μM), ATRi (1 μM), or combination for 3 days (PEO1, PEO1-PR, PEO1-CR, and OVCAR3) and 5 days (JHOS4 and JHOS4-PR). Apoptosis was evaluated by Annexin V-APC and propidium iodide staining (g). Apoptosis was higher in PARPi–ATRi group compared with ATRi monotherapy in all cell lines (PEO1-PR, P = 0.0022; all remaining lines P < 0.001). Immunoblot detection of cleaved-caspase-3 in cells treated as indicated (h). Data shown mean ± SD (n = 3 biologically independent samples), individual samples are presented as data points. One-way ANOVA followed by Tukey’s multiple-comparisons test for (g). ***P < 0.001, **P < 0.01, *P < 0.05. Source data are provided as a source data file.
Fig. 6
Fig. 6. Combination effects of PARPi–ATRi in drug-resistant ovarian cancer PDXs.
ad PARPi pretreatment tumor growth curve (left), tumor volume growth curve (middle) and survival by Kaplan–Meier analysis (right) after randomization. a WO-2PR was from a gBRCA2 mutation carrier whose PDXs were treated with olaparib until progression. Treatment groups: (1) control (n = 3), (2) PARPi 100 mg/kg/day OG 6 days weekly (n = 5), (3) ATRi 50 mg/kg/day OG 5 days weekly (n = 5), (4) PARPi 50+ATRi 50 mg/kg/day OG 5 days weekly (n = 6). Due to progression in combination group by week 10, PARPi was increased to 75 mg/kg/day 6 days weekly. b WO-57 was from a PARPi-resistant gBRCA1 mutation carrier. Treatment groups: (1) control (n = 4), (2) PARPi 75 mg/kg/day OG 6 days weekly (n = 7), (3) ATRi 40 mg/kg/day OG 5 days weekly (n = 7), (4) Both (n = 10). c WO-58 was from a PARPi-resistant gBRCA1 mutation carrier with elevated CCNE1 copy number and protein. Treatment groups similar to (b): (1) control (n = 6), (2) PARPi (n = 6), (3) ATRi (n = 8), (4) Both (n = 9). d WO-19 was from a platinum-resistant, BRCAWT patient with CCNE1 amplification and protein overexpression by IHC magnification ×20. Scale bar = 50 μm. Treatment groups: (1) control (n = 5), (2) carboplatin 30 mg/kg IP weekly (n = 5), (3) PARPi 75 mg/kg/day OG 5 days weekly (n = 3), (4) ATRi 50 mg/kg/day OG 5 days weekly (n = 4), (5) Both (n = 6). Tumor growth shown is mean ± SEM. Longitudinal analysis by Linear Mixed-Effects modeling with type II ANOVA and pairwise comparisons across groups. Survival is shown by Kaplan–Meier curve using the Mantel-Cox log-rank test. P values provided in Supplementary Fig. 8. eg H&E 10× and IHC 20× with 40× insets of pCHK1(S345), γH2AX, and cleaved-caspase-3 in WO-2PR and WO-19 PDXs at 2 weeks post-randomization. In box plots, bounds of boxes show interquartile range, whiskers show maximum and minimum, center lines indicate median. One-way ANOVA followed by Tukeys multiple comparison test for (eg) (n = 27 HPF per group n = 3 mice, 9 HPF per tumor). ****P < 0.0001, WO-2 γH2AX P = 0.0039 (top), 0.0072 (bottom), cleaved-caspase-3 P = 0.0118, WO-19 γH2AX P = 0.0082. Scale bar = 100 μm. ****P < 0.0001, ***P < 0.001, **P < 0.01, *P < 0.05. Data are provided as a source data file.

References

    1. Cancer Genome Atlas Research N. Integrated genomic analyses of ovarian carcinoma. Nature. 2011;474:609–615. - PMC - PubMed
    1. Salani R, et al. Posttreatment surveillance and diagnosis of recurrence in women with gynecologic malignancies: Society of Gynecologic Oncologists recommendations. Am. J. Obstet. Gynecol. 2011;204:466–478. - PubMed
    1. Zivanovic O, Aldini A, Carlson JW, Chi DS. Advanced cytoreductive surgery: American perspective. Gynecologic Oncol. 2009;114:S3–S9. - PubMed
    1. Siegel RL, Miller KD, Jemal A. Cancer statistics, 2018. CA: Cancer J. Clin. 2018;68:7–30. - PubMed
    1. Kristeleit R, et al. A Phase I-II study of the oral PARP inhibitor rucaparib in patients with germline BRCA1/2-mutated ovarian carcinoma or other solid tumors. Clin. Cancer Res. 2017;23:4095–4106. - PubMed

Publication types

MeSH terms