. 2020 Jul 24;9(7):68.
doi: 10.1038/s41389-020-00253-3.

Cyclin D1 targets hexokinase 2 to control aerobic glycolysis in myeloma cells

Affiliations

Cyclin D1 targets hexokinase 2 to control aerobic glycolysis in myeloma cells

M Caillot et al. Oncogenesis. .

Abstract

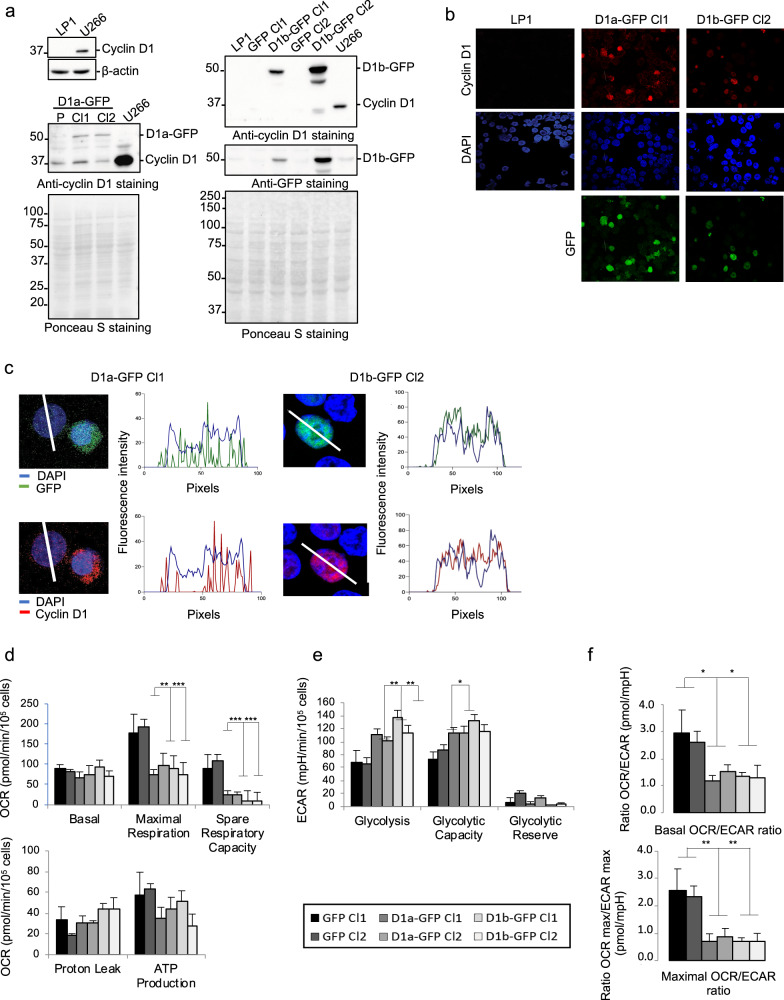
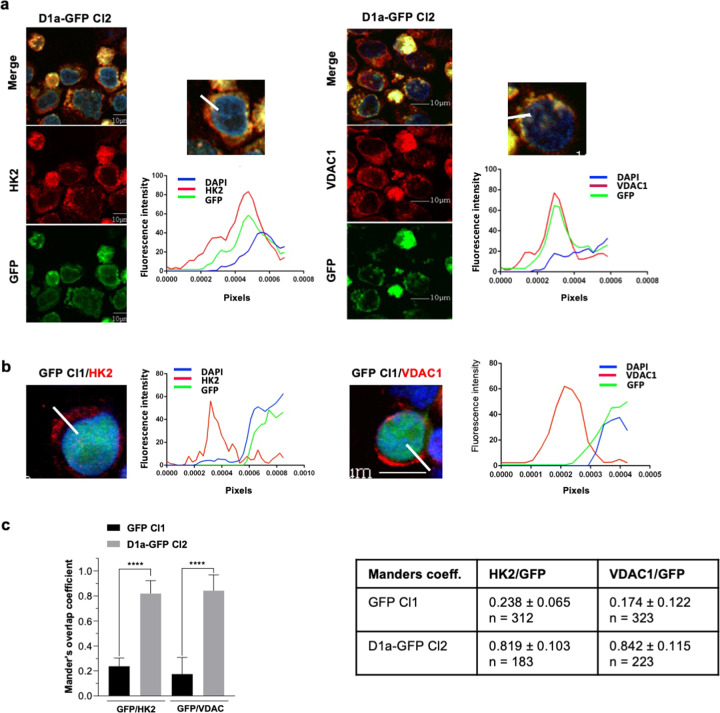
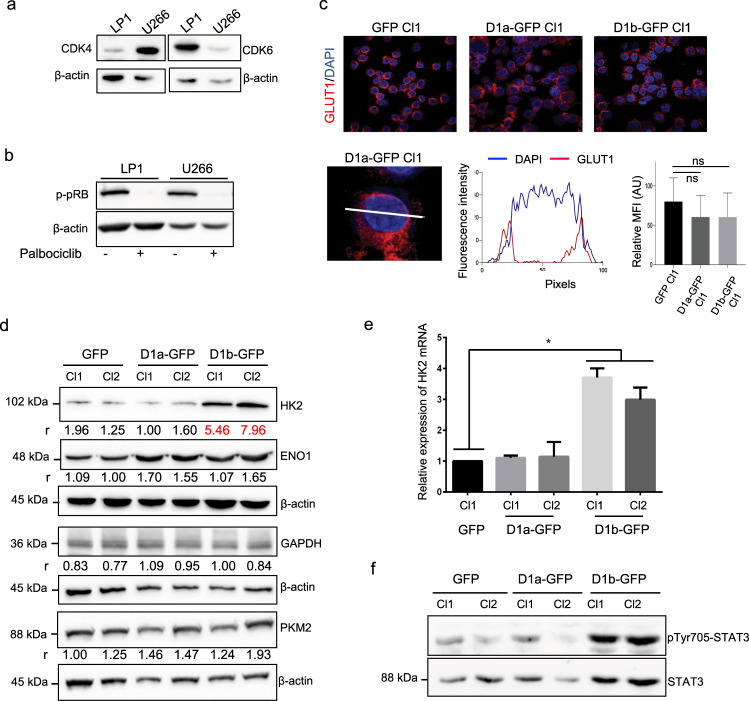
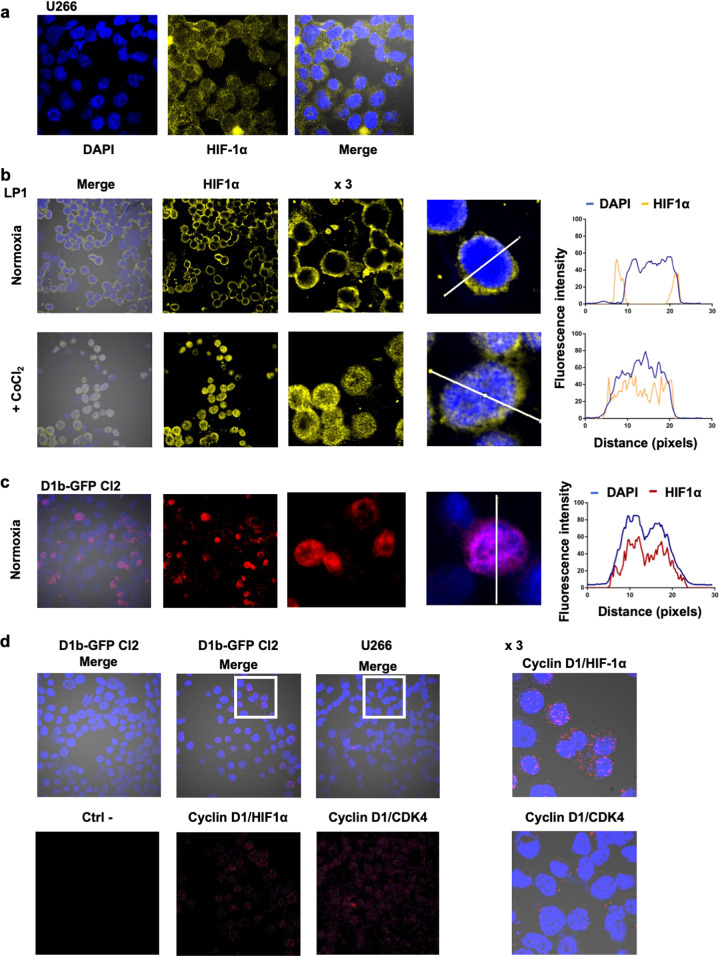
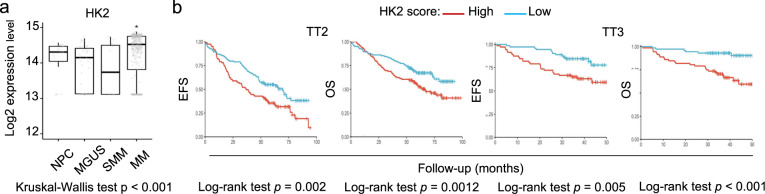
Cancer cells are characterized by the Warburg effect, a shift from mitochondrial respiration to oxidative glycolysis. We report here the crucial role of cyclin D1 in promoting this effect in a cyclin-dependent kinase (CDK)4/6-independent manner in multiple myeloma (MM) cells. We show that the cyclin D1 oncoprotein targets hexokinase 2 (HK2), a major glycolysis regulator, through two original molecular mechanisms in the cytoplasmic and nuclear compartments. In the cytoplasm, cyclin D1 binds HK2 at the outer mitochondrial membrane, and in the nucleus, it binds hypoxia-inducible factor-1α (HIF1α), which regulates HK2 gene transcription. We also show that high levels of HK2 expression are correlated with shorter event-free survival (EFS) and overall survival (OS) in MM patients. HK2 may therefore be considered as a possible target for antimyeloma therapy.


Conflict of interest statement

The authors declare that they have no conflict of interest.

Figures

Fig. 1
Fig. 1. Long and short forms of cyclin D1 induce a metabolic shift in LP1 cells.
a Whole-cell extracts were obtained from cultured LP1, D1a–GFP Cl1/Cl2, D1b–GFP Cl1/2, and U266 MM cells. Proteins were subjected to SDS-PAGE, transferred onto nitrocellulose sheets that were stained with Ponceau S, and analyzed by WB. The blots were incubated with the indicated Abs. An anti-β-actin Ab was used as a loading control. The sizes of the molecular weight markers are indicated on the blots. b LP1, D1a–GFP Cl1, and D1b–GFP Cl2 cells were analyzed by IF and confocal microscopy after DAPI (in blue) or cyclin D1 (in red) staining, or for GFP (in green) expression (×180 magnification). c Merged and enlarged (×3) images of representative cells were processed with the ImageJ software, and the curves of fluorescence intensity (FI, in AU) as a function of distance (in pixels) along the white line crossing one cell were exported. df The evaluation of mitochondrial respiration and glycolytic function in LP1 GFP (Cl1 and Cl2, in black and dark gray), D1a–GFP (Cl1 and Cl2, in medium gray), and D1b–GFP-expressing cells (Cl1 and Cl2, in light gray and white) was performed on a Seahorse analyzer. Basal and maximal respiration, spare respiratory capacity, ATP-linked, and proton leakage (d) were determined by measuring OCR (pmoles/min/105 cells) as described in Figure S1a,c. Glycolysis, glycolytic capacity, and glycolytic reserve (e) were determined by measuring ECAR (mpH/min/105 cells) as described in Fig. S1b, d. Measurements were normalized for cell concentration, and the means ± SEM from four independent experiments are plotted. f The basal OCR/ECAR and maximal OCR/ECAR ratios were determined in the same clone. *p < 0.05; **p < 0.01; ***p < 0.001 in paired t tests.
Fig. 2
Fig. 2. Cyclin D1 and HK2 are bound in D1a–GFP-expressing LP1 cells.
a Cultured GFP-D1a Cl1 cells were cytospun and analyzed by confocal microscopy for GFP expression (in green) or after DAPI (in blue), HK2, or VDAC (in red) staining (×180 magnification). Representative images are shown. In the merged and enlarged (×3) image, the FI of each fluorophore was estimated with ImageJ, and data were exported to generate the curves of fluorescence intensity as a function of the distance. This experiment was performed twice. b The localizations of VDAC1 and HK2 and GFP fluorescence were studied in LP1–GFP cells and exported with ImageJ as previously described. c The colocalization of VDAC1 and HK2 with cyclin D1a was confirmed with the Manders’ overlap coefficient from stained cells on three independent images for each staining condition (https://imagej.nih.gov/ij/). Means ± SD are indicated on the histograms and in the accompanying table, together with the number of cells analyzed for each condition. ****p < 0.0001 with the t test.
Fig. 3
Fig. 3. Nuclear cyclin D1 increases HK2 mRNA and protein levels.
a Whole-cell proteins were obtained from the LP1 and U266 MM cell lines, subjected to SDS-PAGE, transferred onto nitrocellulose sheets, and incubated with the indicated Abs. As before, an anti-β-actin Ab was used as a loading control. b LP1 cells were treated with 2 μM palbociclib for 24 h (+) or with vehicle (0.01% DMSO) and harvested. Whole-cell proteins were prepared and analyzed by WB with the indicated Abs. c LP1-derived clones were cytospun on glass slides, stained with an anti-GLUT1 primary Ab and a goat Alexa Fluor 546-conjugated anti-rabbit IgG as a secondary Ab (in red), and counterstained with DAPI (in blue). The slides were analyzed by confocal microscopy (×180 magnification). In the merged and enlarged image (×3), the FI of each fluorophore was estimated with ImageJ software and data were exported. The FI was recorded from 90 individual cells from each clone analyzed, with ImageJ software. The means and SD of fluorescence intensity (MFI) are presented in the histograms. ns, not significant in the t test. d Whole-cell proteins were obtained from GFP and D1a/b-GFP-expressing clones, subjected to SDS-PAGE, and transferred onto nitrocellulose sheets. Blots were cut into strips and incubated with the indicated Abs. An anti-β-actin Ab was used as a loading control. The level of each glycolytic enzyme was estimated by densitometry and normalized against the β-actin level. The calculated ratios (r) are indicated under the blots. e RT-qPCR analysis of HK2 transcripts in LP1-derived clones. The results are presented as the fold change in cyclin D1-expressing cells (2−ΔΔCt values) relative to GFP-expressing cells (normalized to 1). The experiments were performed twice, with triplicate samples. The data shown are means ± SD, *p < 0.05 in the t test. f Whole-cell proteins were purified from cultured clones and analyzed by WB with the indicated Abs as previously described.
Fig. 4
Fig. 4. The nuclear form of cyclin D1 binds HIF1α.
a U266 cells were cultured under normoxia and analyzed by IF and confocal microscopy after DAPI (in blue) or HIF1α (in yellow) staining (×180 magnification). b LP1 cells were cultured under normoxia or treated with 300 μM CoCl2 overnight and analyzed after DAPI (in blue) or HIF1α (in red) staining. Merged images of representative cells were processed with ImageJ software, and the curves of FI as a function of distance were exported. c D1b–GFP Cl2 cells were cultured under normoxia and analyzed by IF, as previously described. d Duolink PLA technology was used on D1b–GFP Cl2 cells treated with CoCl2 (to enhance the signal) and U266 cells (as a control), to investigate cyclin D1/HIF1α and cyclin D1/CDK4 interactions, respectively. Slides were incubated with the primary Abs, except for the negative control (Ctrl−), and then with the secondary Abs conjugated to the MINUS and PLUS probes. The slides were counterstained with DAPI before confocal microscopy examination (×180 magnification). Representative fields (white squares) were enlarged (×3).
Fig. 5
Fig. 5. A cyclin D1–HIF1α axis regulates HK2 transcription.
a Schematic representation of the luciferase reporter plasmids. b LP1 and D1b–GFP Cl2 cells were treated for 6 h with 300 μM CoCl2 to mimic hypoxia or left untreated (−), then transfected by electroporation with either the 3× HRE-Luc or 3× HRE-δpTK-Luc plasmids. Luciferase activity was measured 48 h later, and data were normalized according to the total protein content of the samples. The experiment was performed twice, with triplicate samples. Data are means ± SD. ****p < 0.0001 in the t test. c LP1, D1b–GFP Cl2, and D1b–GFP Cl2 cells transduced with lentiviruses bearing shRNAs against HIF1α or HIF2α were electroporated with 3× HRE-Luc, 3× HRE-δpTK-Luc, or −255-HK2-Luc reporter plasmids. Luciferase activity was measured and data were normalized. The experiments were performed twice, with triplicate samples. *p < 0.05, ***p < 0.001, ****p < 0.0001 in the t test. d RT-qPCR analyses of HK2 transcripts in GFP Cl2 and D1b–GFP Cl2 cells uninfected or infected with shHIF1α or shHIF2α lentiviruses. The results are presented as the fold change in D1b–GFP Cl2 cells (2−ΔΔCt values) relative to GFP Cl2 cells (normalized to 1). **p < 0.01, ns not significant in the t test.
Fig. 6
Fig. 6. HK2 is overexpressed in MM patients and is associated with a poor prognosis.
a Boxplots of HK2 expression in NPCs (n = 22), MGUS (n = 40), SMM (n = 12), and MM (n = 388) samples. A pairwise statistical comparison between groups was performed with a nonparametric Wilcoxon test followed by Benjamini–Hochberg correction (*p < 0.05). b Kaplan–Meier curves showing the correlation of HK2 expression with event-free survival (EFS) and overall survival (OS) in two independent MM cohorts: TT2 (n = 243) and TT3 (n = 145). High and low scores, defined as above and below the median level of expression, respectively. Log-rank test p values are indicated on the curves.

References

    1. Larocca A, Mina R, Gay F, Bringhen S, Boccadoro M. Emerging drugs and combinations to treat multiple myeloma. Oncotarget. 2017;8:60656–60672. - PMC - PubMed
    1. Bergsagel PL, et al. Cyclin D dysregulation: an early and unifying pathogenic event in multiple myeloma. Blood. 2005;106:296–303. - PMC - PubMed
    1. Ely S, et al. Mutually exclusive cyclin-dependent kinase 4/cyclin D1 and cyclin-dependent kinase 6/cyclin D2 pairing inactivates retinoblastoma protein and promotes cell cycle dysregulation in multiple myeloma. Clin. Cancer Res. 2005;65:11345–11353. - PubMed
    1. Hydbring P, Malumbres M, Sicinski P. Non-canonical functions of cell cycle cyclins and cyclin-dependent kinases. Nat. Rev. Mol. Cell Biol. 2016;17:280–292. - PMC - PubMed
    1. Tchakarska G, Sola B. The double dealing of cyclin D1. Cell Cycle. 2020;19:163–178. - PMC - PubMed