. 2020 Jul 24;3(1):394.
doi: 10.1038/s42003-020-01122-w.

T cell-specific deletion of Pgam1 reveals a critical role for glycolysis in T cell responses

Affiliations

T cell-specific deletion of Pgam1 reveals a critical role for glycolysis in T cell responses

Koji Toriyama et al. Commun Biol. .

Abstract

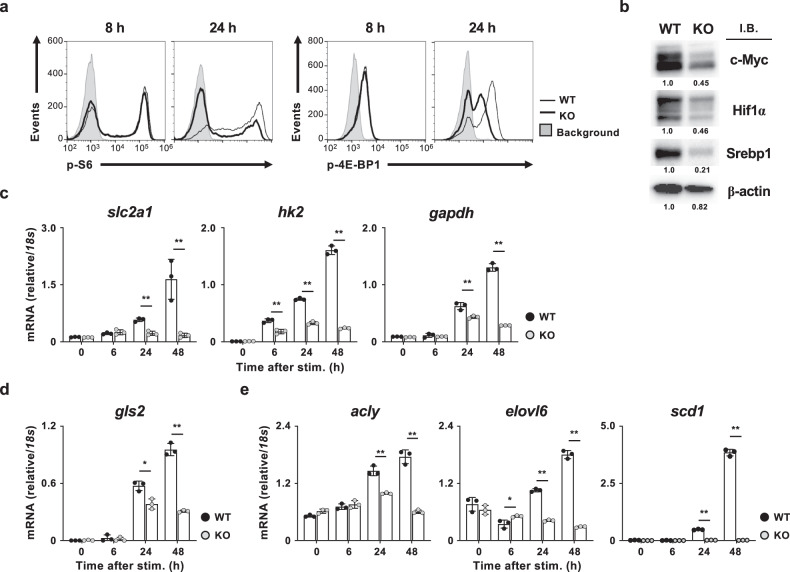
Although the important roles of glycolysis in T cells have been demonstrated, the regulatory mechanism of glycolysis in activated T cells has not been fully elucidated. Furthermore, the influences of glycolytic failure on the T cell-dependent immune response in vivo remain unclear. We therefore assessed the role of glycolysis in the T cell-dependent immune response using T cell-specific Pgam1-deficient mice. Both CD8 and CD4 T cell-dependent immune responses were attenuated by Pgam1 deficiency. The helper T cell-dependent inflammation was ameliorated in Pgam1-deficient mice. Glycolysis augments the activation of mTOR complex 1 (mTORC1) and the T-cell receptor (TCR) signals. Glutamine acts as a metabolic hub in activated T cells, since the TCR-dependent increase in intracellular glutamine is required to augment glycolysis, increase mTORC1 activity and augment TCR signals. These findings suggest that mTORC1, glycolysis and glutamine affect each other and cooperate to induce T cell proliferation and differentiation.


Conflict of interest statement

The authors declare no competing interests.

Figures

Fig. 1
Fig. 1. Glycolysis controls TCR-mediated signal transduction.
a, b WT and Pgam1 KO naive CD8 T cells were stimulated for 24 h, and then a the extracellular acidification rate (ECAR) and b oxygen consumption rate (OCR) were determined (n = 3, technical replicate). Error bars represent the standard deviation. The results of the analyses are representative of at least three independent experiments with similar results. c WT and Pgam1 KO naïve CD8 T cells were stimulated with anti-TCR-β and anti-CD28 mAbs for 6 or 24 h, and the intracellular amounts of glycolytic intermediates were determined by metabolic profiling (n = 3–4, biological replicates). d The intracellular amount of ATP of the cells in c. e The phospho-tyrosine and β-actin levels in WT and Pgam1 KO CD8 T cells stimulated for indicated periods were determined by an immunoblot analysis. The protein amount of β-actin was used as a loading control. The numbers below the bands indicate the densitometry ratio with WT stimulated for 24 h. f The results of the immunoblot analysis of phospho-Zap70 (Tyr319), phosphor-Plcγ1 (Tyr783), and β-actin (control) in cells in e are shown. The numbers below the bands indicate the densitometry ratio with WT stimulated for 24 h. The results of the immunoblot analyses are representative of at least three independent experiments with similar results and are presented as cropped images. The full-length blots are presented in Supplementary Fig. 18. *P < 0.05, **P < 0.01 (Student’s t test).
Fig. 2
Fig. 2. Glycolysis is required for the development of effector CD8 T cells.
a Representative staining profile of CD25, CD44, and CD69 in WT and Pgam1 KO CD8 T cells stimulated with anti-TCR-β plus anti-CD28 mAbs for 36 h. b Representative staining profiles of phospho-STAT5 (Tyr694) in activated CD8 T cells. WT and Pgam1 KO naïve CD8 T cells were stimulated with anti-TCR-β mAb plus anti-CD28 mAb for 48 h, and then the cells were cultured with or without IL-2 for 24 h. c WT and Pgam1 KO naive CD8 T cells were labeled with eFluor670 and stimulated with anti-TCR-β mAb plus anti-CD28 mAb. The cell division was detected by flow cytometry at the indicated number of hours after the initial stimulation. d The immune response of antigen-specific CD8 T cells after Lm-OVA infection was analyzed by staining with an OVA-specific tetramer (Tet). A representative staining profile of Tet/CD8 gated on the CD8-positive cells in the spleen at 7 days post infection (upper). The percentages of cells are indicated in the circle. The absolute number of Tet+ CD8 T cells in the spleen is shown (lower). Each point represents an individual mouse. e Representative results of the intracellular FACS analysis of IFN-γ/IL-2 in the WT and Pgam1 KO CD8 T cells cultured under IL-2 conditions on day 5. The percentages of cells are indicated in each quadrant. f The results of an ELISA for IL-2, IFN-γ, and TNF-α in the supernatants of the cells in e (n = 3, biological replicate). The results of the analyses are representative of at least three independent experiments with similar results. The results are indicated with the standard deviation. *P < 0.05, **P < 0.01 (Student’s t-test).
Fig. 3
Fig. 3. Impaired TH2 and TH17 cell differentiation in Pgam1 KO naïve CD4 T cells.
a Representative results of the intracellular FACS analysis of IFN-γ/IL-4 in the WT and Pgam1 KO CD4 T cells cultured under Th1 conditions for 5 days. b WT and Pgam1 KO CD4 T cells cultured under Th1 conditions in the presence or absence of pyruvate for 5 days. Then the cells were restimulated with immobilized ani-TCRβ mAb for 16 h. The amounts of IL-2, IFN-γ, and TNF-α in the supernatants was determined by an ELISA (n = 3, biological replicate). c Representative results of the intracellular FACS analysis of IFN-γ/IL-4 in the WT and Pgam1 KO CD4 T cells cultured under Th2 conditions for 5 days. d WT and Pgam1 KO CD4 T cells cultured under Th2 conditions in the presence or absence of pyruvate for 5 days. Then the cells were restimulated with immobilized ani-TCRβ mAb for 16 h. The amounts of IL-4, IL-5, and IL-13 in the supernatants was determined by an ELISA (n = 3, biological replicate). e Representative results of the intracellular FACS analysis of Foxp3/IL-17A in the WT and Pgam1 KO CD4 T cells cultured under Th17 condition for 3 days (left panel). The ratio of Foxp3-positive cells/IL-17A-positive cells is shown in the right panel. f WT and Pgam1 KO CD4 T cells cultured under Th17 conditions in the presence or absence of pyruvate for 3 days. Then the cells were restimulated with immobilized ani-TCRβ mAb for 16 h. The amounts of IL-17A and IL-17F in the supernatants was determined by an ELISA (n = 3, biological replicate). The results of the FACS analyses are representative of at least three independent experiments with similar results. The percentages of cells are indicated in each quadrant. The results are indicated with the standard deviation. *P < 0.05, **P < 0.01 (Student’s t-test).
Fig. 4
Fig. 4. Attenuated helper T-cell-dependent inflammatory responses in Pgam1 KO mice.
ac WT and T-cell-specific Pgam1 KO mice were immunized intraperitoneally with 100 μg OVA in 2 mg of aluminum hydroxide gel. The immunized mice were intranasally challenged with OVA in saline (100 μg per mouse) on days 7, 8, and 9 to induce allergic airway inflammation. Twenty-four hours after the last OVA challenge, the lung samples (a) and BAL fluid samples (c) were prepared. a The microscopic appearance of the lungs fixed and stained with hematoxylin and eosin (H&E; left panel) or periodic acid-Schiff (PAS) reagent (right panel). Original magnification ×200 (Scale bars = 100 μm). b The results of the quantitative RT-PCR analysis of the muc5ac and clca3 mRNA in the lungs. The results are presented relative to the expression of 18s rRNA. Each point represents an individual mouse. c Quantification of eosinophils, neutrophils, lymphocytes, macrophages, and total cells in the BAL fluid (n = 8 per group). Each point represents an individual mouse. The results are presented relative to the expression of 18s rRNA. Each point represents an individual mouse. df WT and Pgam1 KO mice were immunized with MOG35–55 peptides in CFA and pertussis toxin to induce experimental autoimmune encephalomyelitis. d The clinical scores (upper panel) and weight change (lower panel) were indicated (n = 6–7 per group). e Mice were killed on day 17, and the number of CD3+ and total cells in the spinal cord were analyzed by flow cytometry (n = 7 per group). f The microscopic appearance of the spinal cords stained with H&E (left panels; arrows highlight inflammatory foci) or Luxol fast blue (LFB; right panels; arrows highlight demyelinated foci). Scale bars = 100 μm. The results are indicated with the standard deviation. *P < 0.05, **P < 0.01 (Student’s t test).
Fig. 5
Fig. 5. Glycolysis supports the sustained activation of mTORC1 signaling.
a Representative results of the intracellular FACS analysis of phospho-ribosomal S6 (S6; Ser235/236) and eukaryotic translation initiation factor 4E-binding protein 1 (4E-BP1; Thr37/46) in WT and Pgam1 KO CD8 T cells stimulated with anti-TCR-β mAb plus anti-CD28 mAb for the indicated number of hours. The results of the FACS analyses are representative of at least three independent experiments with similar results. b The results of the immunoblot analysis of c-myc, Hif1α, SREBP1 and β-actin in WT and Pgam1 KO CD8 T cells stimulated with anti-TCR-β mAb plus anti-CD28 mAb for 24 h. The protein amount of β-actin was used as a loading control. The numbers below the bands indicate the densitometry ratio with WT. The results of the immunoblot analyses are representative of at least three independent experiments with similar results and are presented as cropped images. The full-length blots are presented in Supplementary Figure 18. ce WT and Pgam1 KO CD8 T cells were stimulated with anti-TCR-β mAb plus anti-CD28 mAb for the indicated number of hours, and the mRNA expression of the enzymes for glycolysis (c), glutaminolysis (d), and lipid synthesis (e) were determined by qRT-PCR. The results are presented relative to the expression of 18s rRNA with the standard deviation (n = 3, technical replicates). *P < 0.05, **P < 0.01 (Student’s t test).
Fig. 6
Fig. 6. The glycolysis-dependent glutamine uptake is required for the sustained activation of mTORC1 signaling.
a The intracellular amounts of glutamine and glutamate in WT and Pgam1 KO CD8 T cells stimulated with anti-TCR-β mAb plus anti-CD28 mAb for 6 or 24 h (n = 3–4, biological replicate). b The intracellular amounts of glutamine and glutamate in WT CD8 T cells stimulated with anti-TCR-β mAb plus anti-CD28 mAb in the presence or absence of 10 mM 2-DG for 24 h (n = 3, biological replicate). c WT naïve CD8 T cells were stimulated in the presence or absence of glutamine for 36 h, and then the ECAR was determined. The results are indicated with the standard deviation (right panel; n = 3, technical replicate). d The intracellular levels of lactate in activated CD8 T cells in the presence or absence of glutamine for 24 h are indicated with the standard deviation (n = 3, biological replicate). e Representative results of the intracellular FACS analysis of phospho-S6 (Ser235/236) in CD8 T cells stimulated in the presence or absence of glutamine for the indicated number of hours. f The results of the immunoblot analysis of c-Myc, Hif1α, Srebp1, and β-actin in CD8 T cells cultured in the presence or absence of glutamine and rapamycin for 24 h. The protein amount of β-actin was used as a loading control. The results are presented as cropped images. The numbers below the bands indicate the densitometry ratio with CD8 T cells cultured under Gln (+), Rapa (−) conditions. The results of the immunoblot analyses are representative of at least three independent experiments with similar results. The full-length blots are presented in Supplementary Fig. 18. f The levels of Pgam1, Gapdh, Scd1, and Elovl6 mRNA in CD8 T cells stimulated in the presence or absence of glutamine for the indicated number of hours were determined by the quantitative RT-PCR analysis. The effect of rapamycin on glutamine-dependent alteration was also determined. The results are presented relative to the expression of 18s rRNA with the standard deviations (n = 3, technical replicates). The results of the FACS analyses are representative of at least three independent experiments with similar results. *p < 0.05, **p < 0.01 (Student’s t test).
Fig. 7
Fig. 7. Glutamine controls TCR- and IL-2-mediated signaling in activated CD8 T cells.
a The intracellular amounts of ATP in CD8 T cells stimulated with anti-TCR-β mAb plus anti-CD28 mAb in the presence or absence of glutamine for the indicated number of hours. The results are presented with the standard deviations (n = 3, biological replicate). b The results of the immunoblot analysis of protein-tyrosine phosphorylation and β-actin in naïve CD8 T cells cultured with or without glutamine for the indicated number of hours. The protein amount of β-actin was used as a loading control. The numbers below the bands indicate the densitometry ratio with CD8 T cells cultured with glutamine. c The effect of rapamycin on glutamine-induced protein-tyrosine phosphorylation. Naïve CD8 T cells were stimulated under glutamine-sufficient conditions in the presence or absence of rapamycin for the indicated number of hours. The numbers below the bands indicate the densitometry ratio with CD8 T cells cultured without rapamycin. d The results of the immunoblot analysis of phospho-Zap70 (Tyr319), phosphor-Plcγ1 (Tyr783) and β-actin (control) in cells in (b). The numbers below the bands indicate the densitometry ratio with CD8 T cells cultured with glutamine. e The results of the immunoblot analysis of phospho-Zap70 (Tyr319), phosphor-Plcγ1 (Tyr783) and β-actin (control) in cells in (c). The numbers below the bands indicate the densitometry ratio with CD8 T cells cultured without rapamycin. f Representative results of the FACS analysis of CD25 and CD69 in CD8 T cells stimulated under the indicated conditions for 48 h. g Representative results of the intracellular FACS analysis of phosphor-Stat5 in CD8 T cells cultured with or without IL-2 stimulation. Naïve CD8 T cells were stimulated with anti-TCR-β mAb plus anti-CD28 mAb for 48 h, and then the cells were cultured with or without IL-2 for 24 h. The results of the FACS and immunoblot analyses are representative of at least three independent experiments with similar results. The results of the immunoblot analyses are presented as cropped images. The full-length blots are presented in Supplementary Fig. 18. *p < 0.05, **p < 0.01 (Student’s t test).

References

    1. Ganeshan K, Chawla A. Metabolic regulation of immune responses. Annu. Rev. Immunol. 2014;32:609–634. - PMC - PubMed
    1. Pearce EL, Poffenberger MC, Chang CH, Jones RG. Fueling immunity: insights into metabolism and lymphocyte function. Science. 2013;342:1242454. - PubMed
    1. Pollizzi KN, Powell JD. Integrating canonical and metabolic signalling programmes in the regulation of T cell responses. Nat. Rev. Immunol. 2014;14:435–446. - PMC - PubMed
    1. MacIver NJ, Michalek RD, Rathmell JC. Metabolic regulation of T lymphocytes. Annu Rev. Immunol. 2013;31:259–283. - PMC - PubMed
    1. Rathmell JC, Vander Heiden MG, Harris MH, Frauwirth KA, Thompson CB. In the absence of extrinsic signals, nutrient utilization by lymphocytes is insufficient to maintain either cell size or viability. Mol. Cell. 2000;6:683–692. - PubMed

Publication types

Substances