. 2021 Jun;39(6):1707-1716.
doi: 10.1007/s00345-020-03357-y. Epub 2020 Jul 24.

A temperature model for laser lithotripsy

Affiliations

A temperature model for laser lithotripsy

J G Williams et al. World J Urol. 2021 Jun.

Abstract

Objective: To derive and validate a mathematical model to predict laser-induced temperature changes in a kidney during kidney stone treatment.

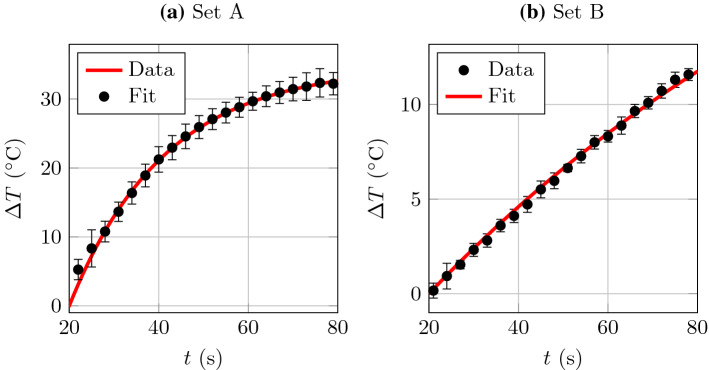
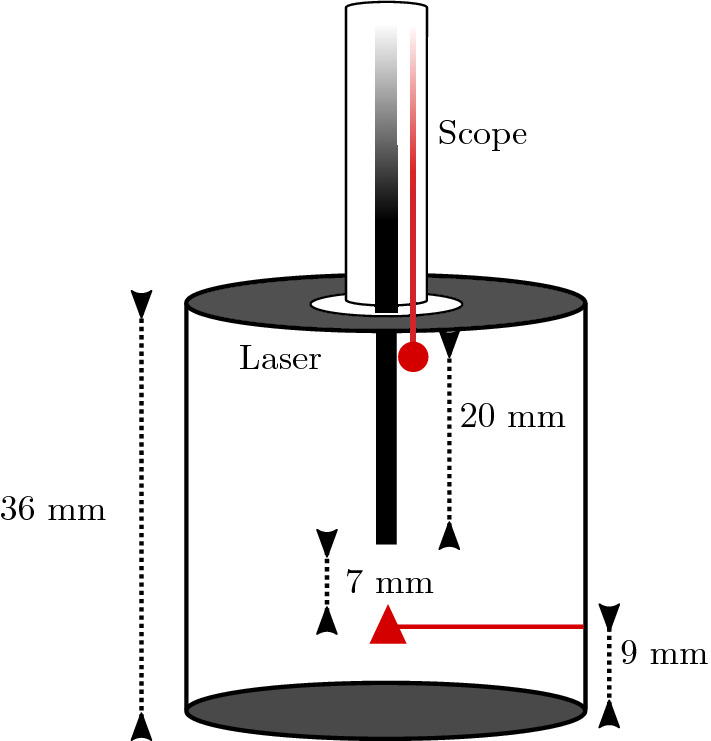
Methods: A simplified mathematical model to predict temperature change in the kidney for any given renal volume, irrigation flow rate, irrigation fluid temperature, and laser power was derived. We validated our model with matched in vitro experiments.

Results: Excellent agreement between the mathematical model predictions and laboratory data was obtained.

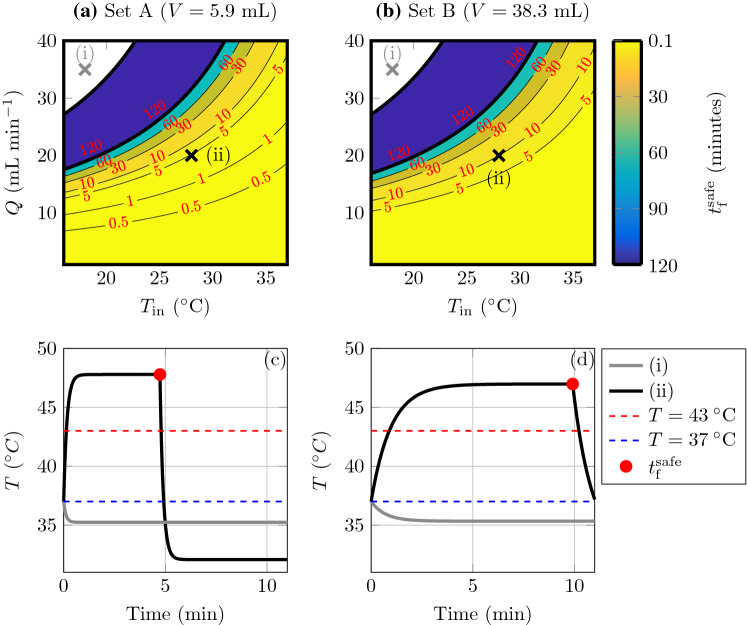
Conclusion: The model obviates the need for repeated experimental validation. The model predicts scenarios where risk of renal tissue damage is high. With real-time knowledge of flow rate, irrigating fluid temperature and laser usage, safety warning levels could be predicted. Meanwhile, clinicians should be aware of the potential risk from thermal injury and take measures to reduce the risk, such as using room temperature irrigation fluid and judicious laser use.

Keywords: In vitro experiments; Lithotripsy; Mathematical modelling; Thermal tissue damage.


Conflict of interest statement

Boston Scientific provided equipment for experiments and funding to support research time for J.G. Williams as part of a joint funding project with industry. B.W. Turney is a consultant for Boston Scientific.

Figures

Fig. 1
Fig. 1
The laser fibre is 10 mm distal to the scope tip. Two thermocouples measured temperature over time positioned at the scope tip and 9 mm from the base of the container. These are indicated by a circle and triangle, respectively. Diagram not to scale
Fig. 2
Fig. 2
The unknown parameter was obtained by fitting the analytical solution for Q=0 mL/min, W=40 Watts: a data from Set A, b data from Set B. The best-fit values are a β1.14 Watts/C and b β1.36 Watts/C
Fig. 3
Fig. 3
A comparison of the model predictions (solid lines) with the experimental data from Set A (symbols)
Fig. 4
Fig. 4
A dimensional comparison of the model predictions (solid lines) with the experimental data (symbols). Triangles are from the thermocouple 9 mm from the base of the container and circles from the thermocouple at the level of the scope tip (see Fig. 1)
Fig. 5
Fig. 5
Predicted temperature change after 60 s of laser firing for T0=37C. In the top row Tin=37C and in the bottom row Tin=23C. The colours provide ΔT and white regions indicate where ΔT<0. a, d V=30 mL and Q, W varied. b, e Q=20 mL min-1 and V, W varied. c, f W=20 Watts and Q, V varied
Fig. 6
Fig. 6
a and b Predicted tfsafe (in minutes), as a function of Tin and Q, such that t43=120 min for a conditions for experiment Set A and b conditions for experiment Set B. c and d Example temperature curves for labelled points (i) (gray) and (ii) (black) in (a) and (b), respectively. Red dots indicates tfsafe, the dashed red line shows T=43C, and the dashed blue line shows T=37C. In all figures, T0=37C and W=40 Watts. The two thicker black lines in (a ) and (b ) denote T=37C and T=43C
Fig. 7
Fig. 7
The laser fibre is 20 mm distal to the scope tip. Two thermocouples measured temperature over time positioned at the scope tip and 9 mm from the base of the container. These are indicated by a circle and triangle, respectively. Diagram not to scale
Fig. 8
Fig. 8
A dimensional comparison of the model predictions (solid lines) with the experimental data (symbols). Triangles are from the thermocouple 9 mm from the base of the container and circles from the thermocouple at the level of the scope tip (see Fig. 7)
Fig. 9
Fig. 9
The considered domain

References

    1. Aldoukhi AH, Ghani KR, Hall TL, Roberts WW. Thermal response to high-power holmium laser lithotripsy. J Endourol. 2017;31(12):1308–1312. doi: 10.1089/end.2017.0679. - DOI - PubMed
    1. Winship B, Wollin DA, Carlos EC, Peters C, Li J, Terry R, Boydston K, Preminger GM, Lipkin ME. The rise and fall of high temperatures during ureteroscopic holmium laser lithotripsy. J Endourol. 2019;33(10):794–799. doi: 10.1089/end.2019.0084. - DOI - PubMed
    1. Aldoukhi AH, Hall TL, Ghani KR, Maxwell AD, MacConaghy B, Roberts WW. Caliceal fluid temperature during high-power holmium laser lithotripsy in an in vivo porcine model. J Endourol. 2018;32(8):724–729. doi: 10.1089/end.2018.0395. - DOI - PMC - PubMed
    1. Sapareto Stephen A, Dewey William C. Thermal dose determination in cancer therapy. Int J Radiat Oncol Biol Phys. 1984;10(6):787–800. doi: 10.1016/0360-3016(84)90379-1. - DOI - PubMed
    1. Kupeli Bora, Tunc Lutfi, Acar Cenk, Gurocak Serhat, Alkibay Turgut, Guneri Cagri, Bozkirli Ibrahim. The impact of pelvicaliceal anatomical variation between the stone-bearing and normal contralateral kidney on stone formation in adult patients with lower caliceal stones. Int Braz J Urol. 2006;32(3):287–292. doi: 10.1590/s1677-55382006000300005. - DOI - PubMed