

Direct measurement and correction of both megavoltage and kilovoltage scattered x-rays for orthogonal kilovoltage imaging subsystems with dual flat panel detectors
- PMID: 32710529
- PMCID: PMC7497931
- DOI: 10.1002/acm2.12986
Direct measurement and correction of both megavoltage and kilovoltage scattered x-rays for orthogonal kilovoltage imaging subsystems with dual flat panel detectors
Abstract
Purpose: To measure the scattered x-rays of megavoltage (MV) and kilovoltage (kV) beams (MV scatter and kV scatter, respectively) on the orthogonal kV imaging subsystems of Vero4DRT.
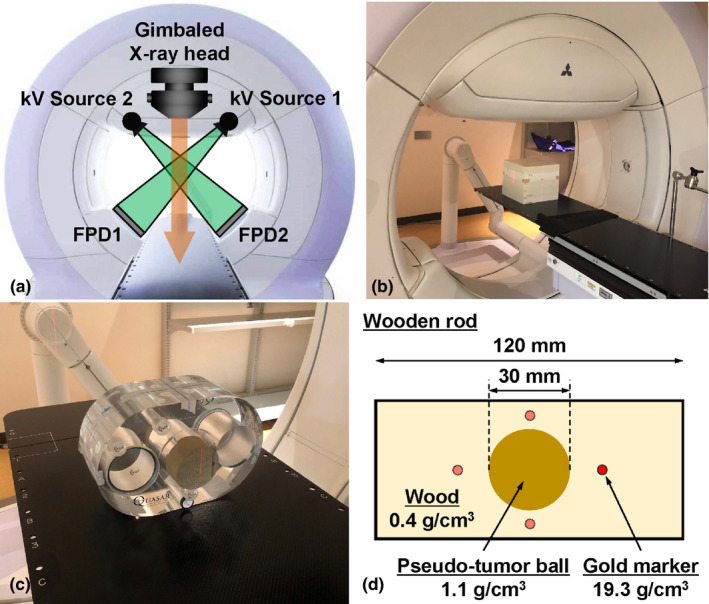
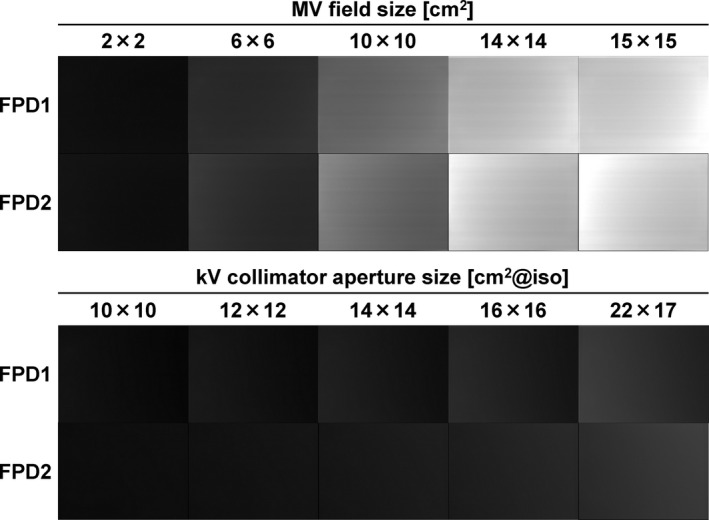
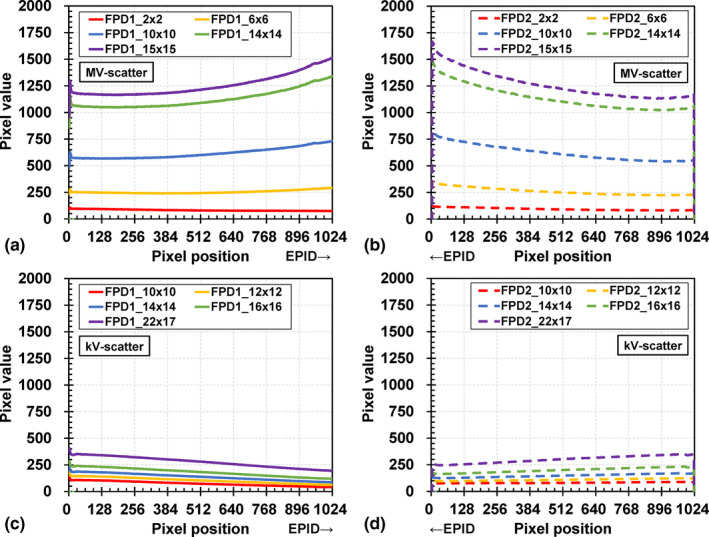
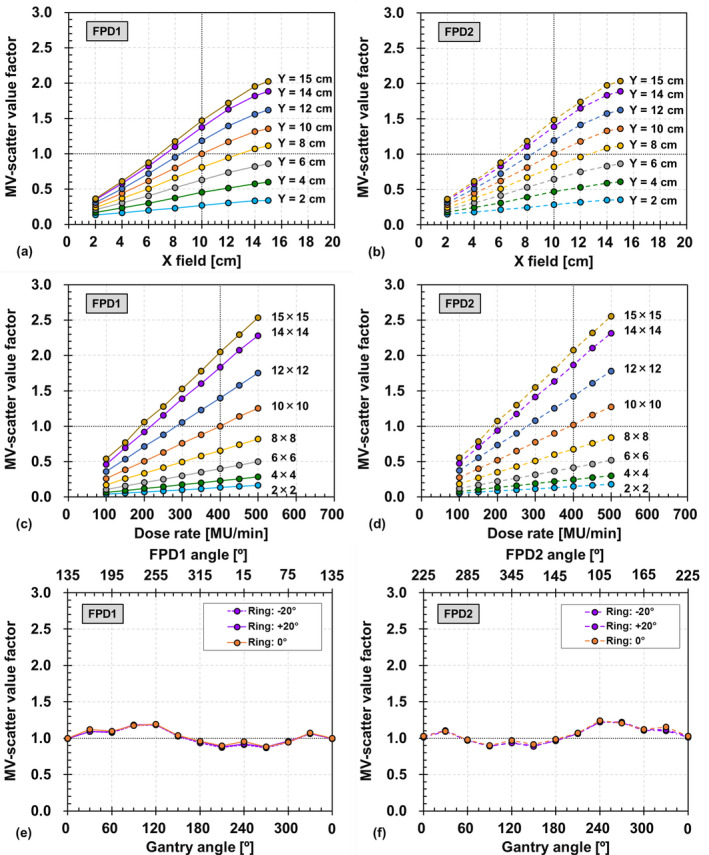
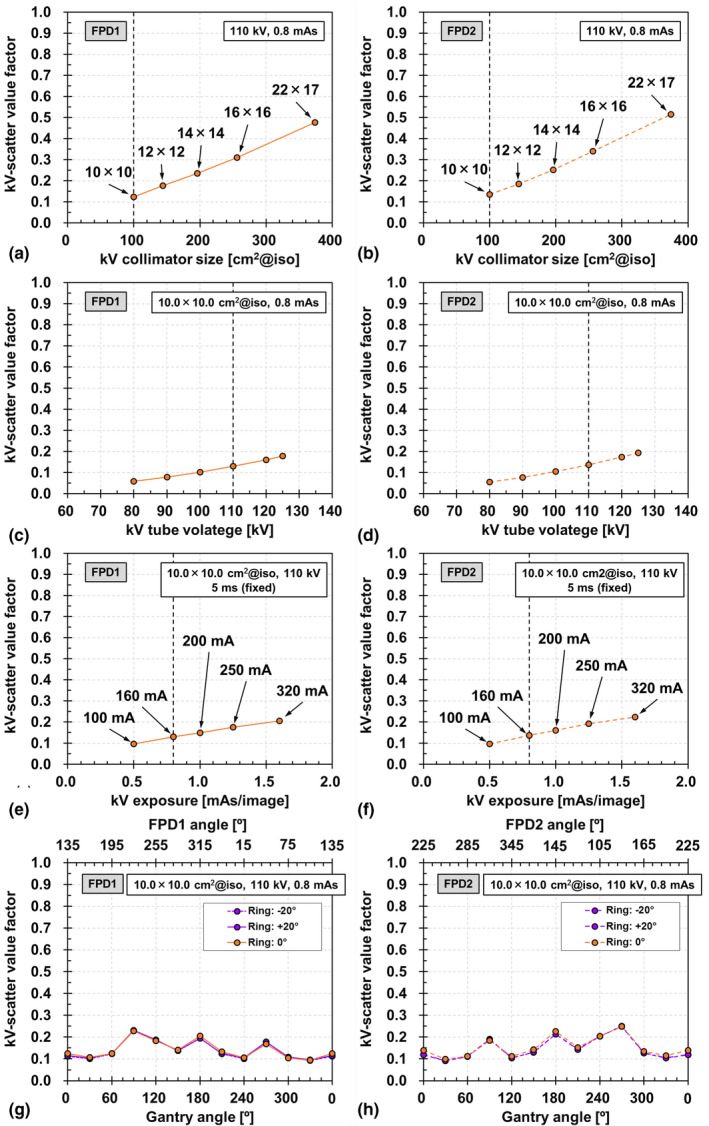
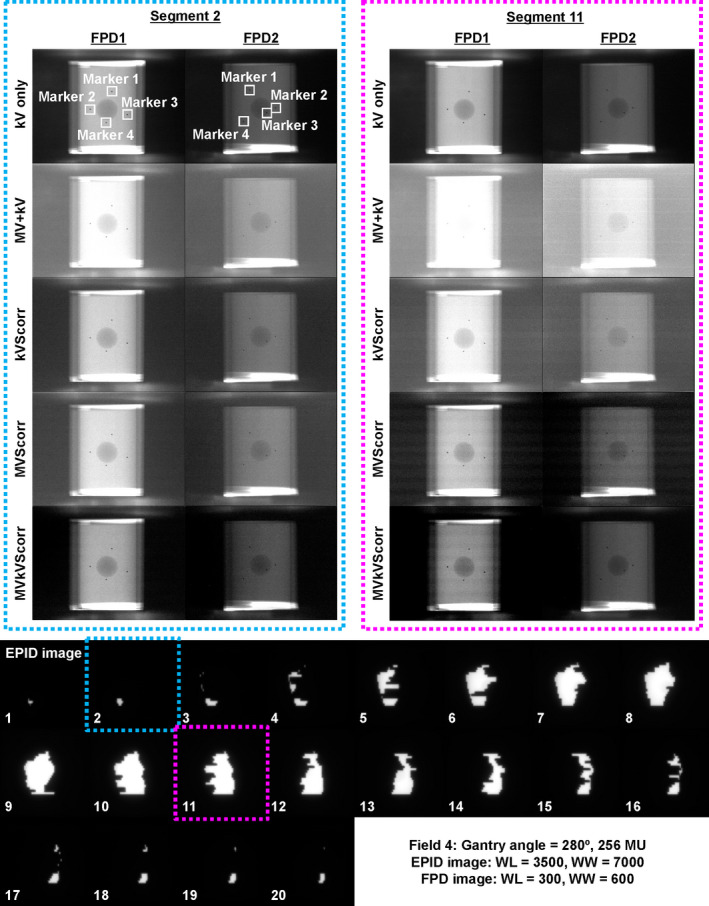
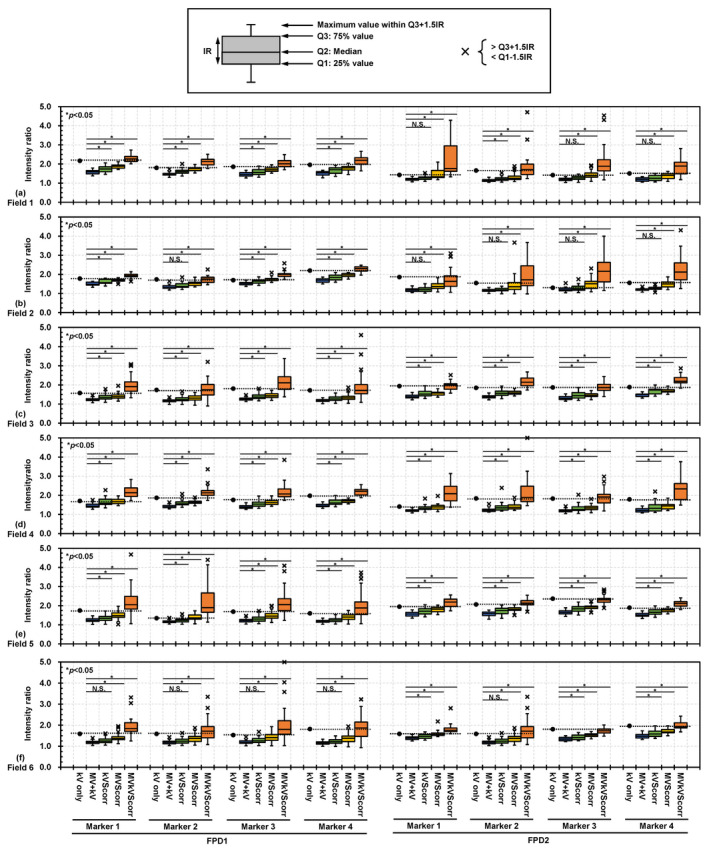
Methods: Images containing MV- and kV-scatter from another source only (i.e., MV- and kV-scatter maps) were acquired for each investigated flat panel detector. The reference scatterer was a water-equivalent cuboid phantom. The maps were acquired by changing one of the following parameters from the reference conditions while keeping the others fixed: field size: 10.0 × 10.0 cm2 ; dose rate: 400 MU/min; gantry and ring angles: 0°; kV collimator aperture size at isocenter: 10.0 × 10.0 cm2 : tube voltage: 110 kV; and exposure: 0.8 mAs. The average pixel values of MV- and kV-scatter (i.e., the MV- and kV-scatter values) at the center of each map were calculated and normalized to the MV-scatter value under the reference conditions (MV- and kV-scatter value factor, respectively). In addition, an MV- and kV-scatter correction experiment with intensity-modulated beams was performed using a phantom with four gold markers (GMs). The ratios between the intensities of the GMs and those of their surroundings were calculated.
Results: The measurements showed a strong dependency of the MV-scatter on the field size and dose rate. The maximum MV-scatter value factors were 2.0 at a field size of 15.0 × 15.0 cm2 and 2.5 at a dose rate of 500 MU/min. The maximum kV-scatter value was 0.48 with a fully open kV collimator aperture. In the phantom experiment, the intensity ratios of kV images with MV- and kV-scatter were decreased from the reference ones. After correction of kV-scatter only, MV-scatter only, and both MV- and kV-scatter, the intensity ratios gradually improved.
Conclusions: MV- and kV-scatter could be corrected by subtracting the scatter maps from the projections, and the correction improved the intensity ratios of the GMs.
Keywords: MV- and kV-scatter; Vero4DRT; dynamic tumor tracking; orthogonal imaging; radiotherapy.
© 2020 The Authors. Journal of Applied Clinical Medical Physics published by Wiley Periodicals LLC on behalf of American Association of Physicists in Medicine.
Conflict of interest statement
The authors of this publication have no conflict of interest to declare.
Figures
References
-
- Keall PJ, Mageras GS, Batler JM, et al. The management of respiratory motion in radiation oncology report of AAPM Task Group 76. Med Phys. 2006;33:3874–3900. - PubMed
-
- Lang S, Zeimetz J, Ochsner G, et al. Development and evaluation of a prototype tracking system using the treatment couch. Med Phys. 2014;41:021720. - PubMed
-
- Toftegaard J, Hansen R, Ravkilde T, Macek K, Poulsen PR. An experimentally validated couch and MLC tracking simulator used to investigate hybrid couch‐MLC tracking. Med Phys. 2017;44:798–809. - PubMed
-
- Shirato H, Shimizu S, Kunieda T, et al. Physical aspects of a real‐time tumor‐tracking system for gated radiotherapy. Int J Radiat Oncol Biol Phys. 2000;48:1187–1195. - PubMed
MeSH terms
Grants and funding
LinkOut - more resources
Full Text Sources
Medical
Research Materials
