. 2020 Sep 18;48(16):8977-8992.
doi: 10.1093/nar/gkaa608.

Gcn2 eIF2α kinase mediates combinatorial translational regulation through nucleotide motifs and uORFs in target mRNAs

Affiliations

Gcn2 eIF2α kinase mediates combinatorial translational regulation through nucleotide motifs and uORFs in target mRNAs

Yuji Chikashige et al. Nucleic Acids Res. .

Abstract

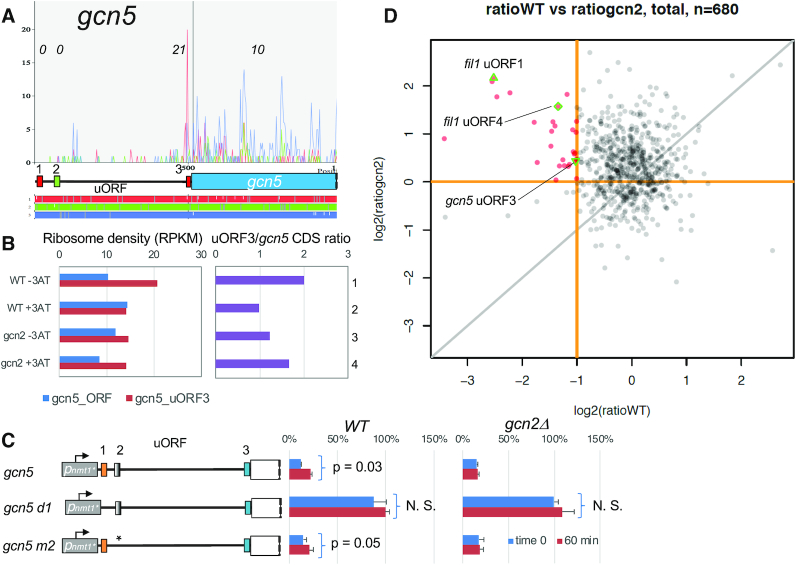
The protein kinase Gcn2 is a central transducer of nutritional stress signaling important for stress adaptation by normal cells and the survival of cancer cells. In response to nutrient deprivation, Gcn2 phosphorylates eIF2α, thereby repressing general translation while enhancing translation of specific mRNAs with upstream ORFs (uORFs) situated in their 5'-leader regions. Here we performed genome-wide measurements of mRNA translation during histidine starvation in fission yeast Schizosaccharomyces pombe. Polysome analyses were combined with microarray measurements to identify gene transcripts whose translation was up-regulated in response to the stress in a Gcn2-dependent manner. We determined that translation is reprogrammed to enhance RNA metabolism and chromatin regulation and repress ribosome synthesis. Interestingly, translation of intron-containing mRNAs was up-regulated. The products of the regulated genes include additional eIF2α kinase Hri2 amplifying the stress signaling and Gcn5 histone acetyl transferase and transcription factors, together altering genome-wide transcription. Unique dipeptide-coding uORFs and nucleotide motifs, such as '5'-UGA(C/G)GG-3', are found in 5' leader regions of regulated genes and shown to be responsible for translational control.


Figures

Figure 1.
Figure 1.
Polysome profiling analysis of S. pombe histidine starvation response. (A) A wild-type yeast strain was grown in EMM-Complete (EMMC) (left) or EMM-C-His till A600 = 0.3–0.5 and 10 mM 3AT (inhibitor of histidine synthesis) was added to the latter medium for 30 min (right). After cycloheximide treatment, cell extracts were prepared and resolved by sucrose gradient velocity sedimentation as described (53), as A254 profile was being monitored (shown on Top panels). (B) Representative microarray data of gradient fractions. Fixed amounts of RNA isolated from each fraction were processed for DNA microarray hybridization, after the addition of external RNA standards (spike RNAs). The mRNA abundance across the gradient was normalized by spike RNA hybridization signals and presented as percentage (%) distribution as fi, n after correction by the fraction of RNA used for hybridization reactions. Values for indicated genes under four conditions, WT or gcn2Δ with or without 3AT, are presented. The diagram to the right of the gene name depicts its genomic structure; brown boxes, exons; horizontal lines, introns; and blue boxes, UTR.
Figure 2.
Figure 2.
Determination of ribosome density (δi) by polysome profiling and analysis of genes translationally controlled by Gcn2. (A), the ribosome number indicated was assigned to fractions 3–7, based on simulation of ribosome mass in each fraction (blue bars) in comparison to A254 profile. δi was computed for every mRNA using these values. (B) Graphs indicated ribosome density fold increase by 3AT plotted against fold increase in mRNA amount (transcription rate) by 3AT. This is shown for WT and gcn2Δ cells. Note a smaller variation in y axis in gcn2Δ, as Gcn2 is responsible for transcriptional induction. Both WT and gcn2Δ show a positive correlation between more mRNA translation and higher δi. (C) The rate of 3AT-induced ribosome loading against different groups of mRNAs. ΔUp values in WT (blue bars) and gcn2Δ (red bars) yeasts, as defined in Table 1, are shown for the groups of poly(A) RNAs designated to the left of the graph. Left column, the number of RNA species in each group. (D) Analysis of mRNAs with one or more introns. Table shows the P value for enrichment of these mRNAs in the indicated list of genes/mRNAs. Graph, the total abundance (blue) and ribosome load (red) of mRNAs of this type was computed and compared to the values for total RNA in the cell. (E), the UGA(C/G)GG-like motif. Four motifs obtained in our motif analysis of the group TA4 under the following conditions are presented to the left, K = 6, 0th, K = 7, 0th, K = 6, 5th and K = 7, 5th (see Supplementary Methods for details) from top. Numbers to the right of each motif are MEME e value for enrichment in TA4 and the frequency of mRNA with each motif found in TA4. Venn diagram indicates the number of genes with this motif or more strict UGACGG sequence (in parenthesis) inside or outside of the group TA4. For mRNAs with these motifs, see Supplementary Table S6.
Figure 3.
Figure 3.
uORF-dependent regulation of hri2. (A) Transformants of S. pombe wild type (WT) or isogenic gcn2 Δ strain carrying dual luciferase plasmids with 5′ leader from indicated genes were grown in a minimal medium (EMMC-Leu-His) and assayed for dual luciferase after 3AT addition. Schematics to the left indicates the arrangement of uORFs (shaded boxes – orange, positive element; blue, negative element), drawn to scale, preceding the Fluc coding region (large empty box). The luciferase mRNA is transcribed from a weakened nmt1 promoter (gray box) with its transcription start site (arrow) located 72-bp upstream of the MCS. Graphs indicate normalized luciferase expression compared to untreated vector control with bars indicating standard error of the mean (SE). Blue, expression at time 0. Red and green, 10 mM 3AT treatment for 30 and 60 min, respectively. (B) Luciferase assay was done with indicated mutant constructs altering hri2 leader region in WT and gcn2Δ strains. Horizontal bar indicates the region left in the construct.
Figure 4.
Figure 4.
Translational control of gcn5. (A) The graphs on top present read counts from the ribosome profiling data in the wild-type control experiments (12) plotted against the nucleotide positions within the 5′ half of gcn5 mRNA. Plots are color-coded by three reading frames presented on bottom. Schematics in the middle represent uORF structures and the main CDS also color-coded similarly. Trips-vis was used for the graphical presentation (54). Ribosome density at each ORF is presented italicized as RPKM. (B) Left graph, ribosome densities in RPKM for gcn5 CDS (blue) and uORF3 (red) are presented in RPKM for four experiments with WT and gcn2Δ strains (12). Right graph, the ribosome density ratio of uORF3 against gcn5 CDS. (C) The dual luciferase reporter with Gcn5::Fluc missing the start codon of uORF1 (row 2) and changing that of uORF2 (row 3) were generated and used for dual luciferase assay in the indicated strain grown in the presence of 3AT for 60 min. Schematics to the left show the uORF structures of wild type and mutant versions of the reporter constructs, as in Figure 3. (D) 680 uORFs displaying reasonable ribosome protection were chosen to study Gcn2- and uORF-dependent regulation (see SI Methods for details). 3AT-induced fold-change in uORF/CDS values in WT (ratioWT) is plotted against 3AT-induced fold-change in these values in gcn2Δ (ratio gcn2), Red lines indicate the threshold of ratio gcn2 = 1 and ratio WT = 0.5. Red dots, 28 uORFs suggested to display Gcn2-dependent induction of CDS translation (see Supplementary Table S7 for their list).
Figure 5.
Figure 5.
Analysis of uORF codon composition suited for re-initiation. (A) 680 uORFs showing RPKM > 6 in the ribosome profiling data (12) were selected (see Supplementary Methods for detail), and relationship between the nucleotide compositions of their codons and their uORF/CDS ratio were analyzed and plotted. The box below indicates the definition of codon numbers relative to the stop codon of the uORFs analyzed. Significant P values were highlighted in red. Beyond pyrimidine-rich (more pyrimidine or MPyr) versus purine-rich (more purine or MPur), the following comparisons were made but not shown, because significant differences were not observed: only purine versus only pyrimidine; only CG versus only AT; of only AT, more A versus more T; of only CG, more G versus more C; more C or G versus more A or T. (B) Using the uORF/CDS dataset for 680 uORFs, comparisons were conducted at the position 1 defined in panel A (or the last codon prior to stop codon) by limiting the uORF size to encompassing two amino acid-long to n amino acid-long (where n is 3∼19). Shown are the comparisons yielding significant differences among those tested for the six categories designated in panel A. OCG, only C or G. OAT, only A or T.
Figure 6.
Figure 6.
Motif-dependent regulation. (A) S. pombe WT or (B) gcn2Δ transformants carrying dual luciferase plasmids with indicated 5′-UTR sequences before Fluc are grown and assayed as in Figure 3. hrd1 d6, hrd1 (motif) and hrd1 d22 are deletion derivatives of wild-type hrd1 shown on top, with TGA(C/A)GG-like motifs highlighted in red. In parenthesis a part of the BamHI site used for cloning is shown with its distance in bp from the adenine residue at the transcription start point (TSP). Italicized, sequence from the vector portion. (C) S. pombe WT, atf1Δ, pcr1Δ, int6Δ or gcn2Δ transformants carrying indicated dual luciferase plasmids with WT or mutant hrd1 leader sequences were grown in EMMC-LH and assayed for Fluc/Rluc activity. The normalized Fluc activities relative to WT control were presented. Data for WT and gcn2Δ were taken from panels A and B. (D) Predicted secondary structure of hrd1 5′ UTR with the location of UGACGG highlighted.
Figure 7.
Figure 7.
Conservation and diversity of translational control in fungi. (A) Left diagram depicts a simplified fungal tree of life. Columns 1–3 indicate the presence of eIF2α kinases Gcn2 and Hri, and the translational regulator 5MP, a competitive inhibitor mimicking a part of translation factor eIF5 (55) (for phylogenetic trees of Hri and 5MP, see Supplementary Figure S10). Columns 4 and 5 list the Gcn4/CpcA/Cpc1 ortholog and whether its translational control is of the type found for S. cerevisiae GCN4. The schematics to the right depict the uORF arrangement, drawn to scale, of mRNA coding for the relevant Gcn4 homolog (56,57), where boxes indicate uORFs (colored yellow for positive, and blue for negative element) or the main CDS (shaded). The conserved proteins listed in columns 1–4 are as follows: from Aspergillus representing the class Eurotiomycetes, A. fumigatus CpcC (37) and A. nidulans AN2246 (38) (Gcn2 homologs), A. nidulans HriA (AN7321, XP_680590) (38), and A. fumigatus CpcA (58) and A. nidulans CpcA (56); from Neurospora representing the class Sordariomycetes, Cpc3 (59) and Cpc1 (57); from Saccharomyces representing the class Saccharomycetes, Gcn2 and Gcn4 (3); from Neolecta representing Neolectales, OLL26911 (Gcn2) and OLL24616 (CpcA); from Taphrinomycotina incertae sedis, Saitoella, XP_019023598 (Gcn2), XP_019024465 (Hri), XP_019027573 (5MP) and XP_019021532 (CpcA); and from Coprinopsis representing the subphylum Agaricomycotina class Agaricomycetes, XP_001828226 (Gcn2), XP_001830176 (5MP) and Cpc1 (57). (B-D) uORFs found in Hri (B), Gcn5 (C) and Fil1 (D) mRNAs in Schizosaccharomyces (Taphrinomycotina) and Aspergillus (Pezizomycotina) species. Their arrangement was depicted in the schematics as defined for Gcn4/CpcA mRNAs as in (A). Bars within the boxes indicate additional AUG start codons that initiate uORF in the same reading frame. For di- or tripeptide-coding uORFs, the coded peptides are listed by arrows. Accession numbers of the depicted mRNAs are; for Hri, XM_013160615 (Hri2), AN7321 in AspGD (HriA), XM_025542713, and XM_025617590; for Gcn5, XM_002173929; and for Fil1, NM_001022957, XM_013163848 and XM_013169711. In (D), the nucleotide sequences of di- or tripeptide coding uORFs found in fil1 mRNA are listed with start and stop codons underlined and pyrimidines in other codons boldfaced.

References

    1. Dever T.E. Gene-specific regulation by general translation factors. Cell. 2002; 108:545–556. - PubMed
    1. Asano K. Dubitzky W., Wolkenhauser O., Cho K-.H., Yokota H.. Encyclopedia of Systems Biology. 2013; NY: Springer; 2278–2282.
    1. Hinnebusch A.G., Dever T.E., Asano K.. Mathews M.B., Sonenberg N., Hershey J.W.B.. Translational Control in Biology and Medicine. 2007; NY: Cold Spring Harbor Lab Press; 225–268.
    1. Vattem K.M., Wek R.C.. Reinitiation involving upstream ORFs regulates ATF4 mRNA translation in mammalian cells. Proc. Natl. Acad. Sci. U.S.A. 2004; 101:11269–11274. - PMC - PubMed
    1. Ye J., Kumanova M., Hart L.S., Sloane K., Zhang H., De Panis D., Bobrovnikova-Marjon E., Alan Diehl J, Ron D., Koumenis C.. The GCN2-ATF4 pathway is critical for tumor cell survival and proliferation in response to nutrient deprivation. EMBO J. 2010; 29:2082–2094. - PMC - PubMed

Publication types

MeSH terms