. 2022 Aug 24;226(2):278-286.
doi: 10.1093/infdis/jiaa451.

Reliability of Self-Sampling for Accurate Assessment of Respiratory Virus Viral and Immunologic Kinetics

Affiliations

Reliability of Self-Sampling for Accurate Assessment of Respiratory Virus Viral and Immunologic Kinetics

Alpana Waghmare et al. J Infect Dis. .

Abstract

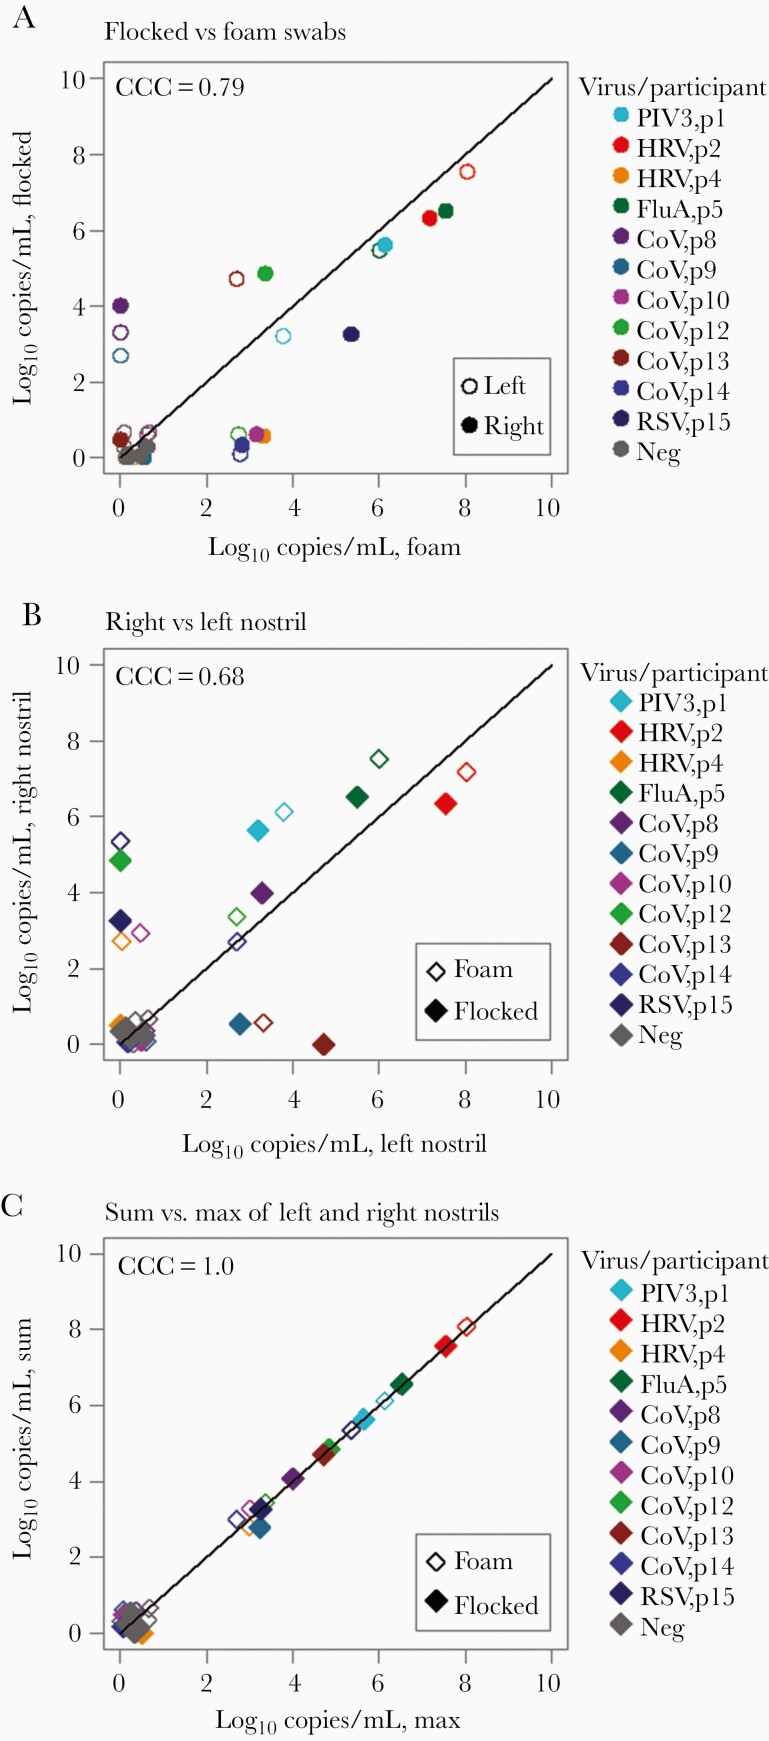
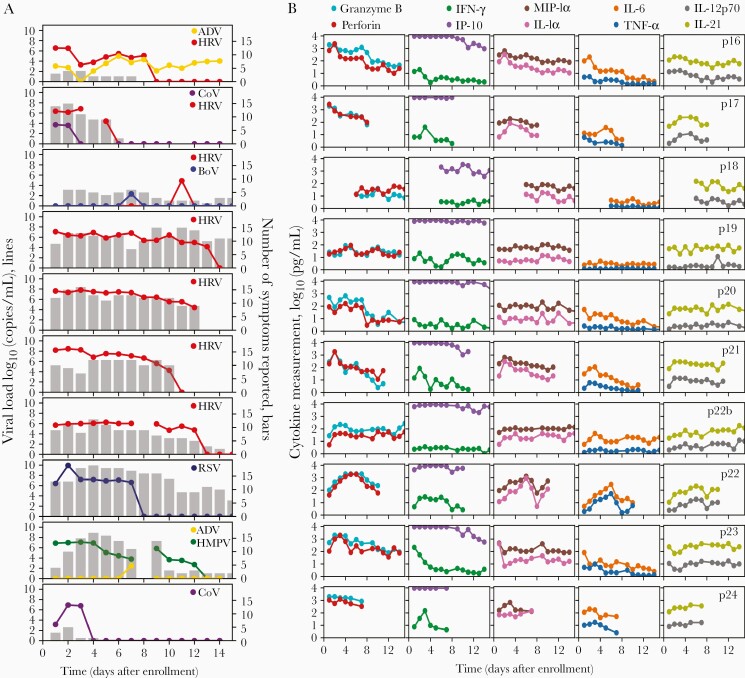
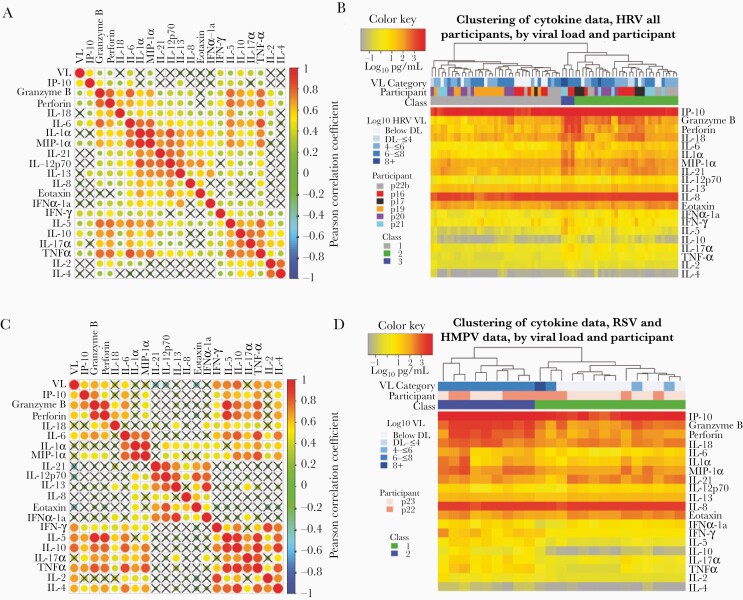
The severe acute respiratory syndrome coronavirus 2 (SARS-CoV-2) pandemic demonstrates the need for accurate and convenient approaches to diagnose and therapeutically monitor respiratory viral infections. We demonstrated that self-sampling with mid-nasal foam swabs is well-tolerated and provides quantitative viral output concordant with flocked swabs. Using longitudinal home-based self-sampling, we demonstrate that nasal cytokine levels correlate and cluster according to immune cell of origin. Periods of stable viral loads are followed by rapid elimination, which could be coupled with cytokine expansion and contraction. Nasal foam swab self-sampling at home provides a precise, mechanistic readout of respiratory virus shedding and local immune responses.

Keywords: cytokines; immune response; respiratory virus; viral diagnostics.


Figures

Figure 1.
Figure 1.
Comparison between self-collected mid-nasal foam and mid-turbinate flocked swabs. A, Viral loads from the same nostril using flocked and foam swabs are concordant, particularly at higher viral loads. B, Differential viral loads with the same swab type, observed between nostrils, show moderate concordance. C, Viral load from the highest nostril strongly agrees with the sum of the 2 nostrils, suggesting that a majority of sampled virus comes from 1 side. Overlapping data points have been jittered to allow viewing of all data points. Abbreviations: CCC, concordance correlation coefficient; CoV, coronavirus; FluA, influenza A; HRV, human rhinovirus; Neg, negative; PIV3, parainfluenza virus 3; RSV, respiratory syncytial virus.
Figure 2.
Figure 2.
Viral load, symptoms, and cytokine levels in serial sampling in both nostrils. Each row represents a participant. A, Viral load (lines) and quantity of symptoms (bars) are shown on left and often tracked with each other longitudinally. Serial sampling in both nostrils with foam swabs reveals a steady state for human rhinovirus, respiratory syncytial virus, and human metapneumovirus viral loads prior to rapid elimination. B, Levels for each cytokine are shown on the right. Paired cytokines show concordant expansion and clearance phases. Abbreviations: ADV, adenovirus; BoV, bocavirus; CoV, coronavirus; HMPV, human metapneumovirus; HRV, human rhinovirus; IFN-γ, interferon gamma; IL, interleukin; IP-10, Interferon gamma-induced protein 10; MIP-1α, macrophage inflammatory protein 1 alpha; RSV, respiratory syncytial virus; TNF-α, tumor necrosis factor alpha.
Figure 3.
Figure 3.
Cytokines correlate according to cellular origin during respiratory virus infection, whereas samples cluster according to level of inflammation. A and B, Data from participants p16, p17, p18, p19, p20, p21, and p22b who have human rhinovirus (HRV) infection. C and D, Data from participants p22 and p23 who have respiratory syncytial virus (RSV) and human metapneumovirus (HMPV), respectively. A and C, Correlation plots with strong correlation according to cell type origin. X indicates a nonsignificant correlation. Color intensity and the size of the dot are proportional to the Pearson correlation coefficient. For both datasets, strong positive correlations are noted within cytokines linked with cytolytic T-cell responses, macrophage responses, and Th2 responses. B and D, Linkage clustering analysis of samples (columns) demonstrates classes of samples based on the concentration of inflammatory cytokines. B, For HRV infections, a minority of samples (class 3) from 2 participants and with the highest levels granzyme B, perforin, interleukin 6, interleukin 1α, macrophage inflammatory protein 1α, and interferon-γ all had high viral loads. All 6 participants had samples in the least inflammatory class (class 1) and 5 participants had samples in the moderate inflammatory class (class 2). D, For RSV and HMPV, inflammatory (class 2) and noninflammatory (class 1) sample clusters are evident. The inflammatory class of samples is highly associated with the highest viral loads. Abbreviations: DL, detection limit; HMPV, human metapneumovirus; HRV, human rhinovirus; IFN-α, interferon alpha; IFN-γ, interferon gamma; IL, interleukin; IP-10, interferon gamma-induced protein 10; MIP-1α, macrophage inflammatory protein 1 alpha; RSV, respiratory syncytial virus; TNF-α, tumor necrosis factor alpha; VL, viral load.

Update of

References

    1. Dong E, Du H, Gardner L. An interactive web-based dashboard to track COVID-19 in real time. Lancet Infect Dis 2020; 20:533–4. - PMC - PubMed
    1. Gutierrez P. Coronavirus mapped: which countries have the most cases and deaths?https://www.theguardian.com/world/2020/mar/27/coronavirus-mapped-map-whi.... Accessed 30 March 2020.
    1. Lipsitch M, Swerdlow DL, Finelli L. Defining the epidemiology of Covid-19—studies needed. N Engl J Med 2020; 382:1194–6. - PubMed
    1. Clark TW, Ewings S, Medina MJ, et al. Viral load is strongly associated with length of stay in adults hospitalised with viral acute respiratory illness. J Infect 2016; 73:598–606. - PMC - PubMed
    1. Hijano DR, Brazelton de Cardenas J, Maron G, et al. Clinical correlation of influenza and respiratory syncytial virus load measured by digital PCR. PLoS One 2019; 14:e0220908. - PMC - PubMed

Publication types